Comprehensive Business Analysis Report: PBP Group Berhad Overview
VerifiedAdded on 2020/06/06
|20
|4595
|55
Report
AI Summary
This report presents a comprehensive business analysis of PBP Group Berhad, a public listed company operating in food production, agriculture, and other sectors. It begins with an introduction and company background, highlighting key issues and a comparative value proposition with competitors like British American Tobacco and HEXA Food Company. The financial analysis section employs ratio analysis, including return on invested capital, net profit margin, return on assets, current ratio, and quick ratio, to assess PBP Group Berhad's performance relative to its competitors. Strategic analysis utilizes PESTLE analysis to examine political, economic, social, technological, and environmental factors influencing the company. The report also identifies strategic options using Ansoff's Matrix. Limitations of financial models and conventional analysis are also discussed. The report concludes with recommendations and a conclusion, providing a detailed overview of PBP Group Berhad's competitive position and strategic considerations.
Business
Analysis Projects
Analysis Projects
Paraphrase This Document
Need a fresh take? Get an instant paraphrase of this document with our AI Paraphraser
Table of Contents
INTRODUCTION...........................................................................................................................1
1. COMPANY BACKGROUND....................................................................................................1
1.1 Key issues.........................................................................................................................1
1.2 Comparative Value Proposition.......................................................................................1
1.3 Rationale of choice of company.......................................................................................2
2. FINANCIAL ANALYSIS...........................................................................................................2
3. STRATEGIC ANALYSIS...........................................................................................................7
3.1 PESTLE analysis..............................................................................................................7
3.2 New forces in PBP Group Berhad....................................................................................9
3.3 Operations and analysis of organisation...........................................................................9
3.4 Success Factors.................................................................................................................9
4. IDENTIFYING STRATEGIES.................................................................................................11
4.1 Ansoff's Matrix...............................................................................................................11
5. LIMITATION OF FINANCIAL MODELS AND CONVENTIONAL ANALYSIS.....12
5.1 Limitation of Conventional analysis..............................................................................12
5.2 Limitation of financial model while analysing the performance....................................12
RECOMMENDATION.................................................................................................................12
CONCLUSION..............................................................................................................................13
Modelling.............................................................................................................................13
REFERENCES..............................................................................................................................15
APPENDIX....................................................................................................................................16
Index of Figures
Figure 1 Return on invested capital.................................................................................................3
Figure 2 Net profit margin...............................................................................................................4
Figure 3 return on assets ratio..........................................................................................................5
Figure 4 Current ratio......................................................................................................................6
Figure 5 Quick ratio.........................................................................................................................6
Figure 6 Malaysia consumer price index.........................................................................................8
Figure 7 Product market Ansoff Matrix........................................................................................11
⊘ This is a preview!⊘
Do you want full access?
Subscribe today to unlock all pages.
Trusted by 1+ million students worldwide
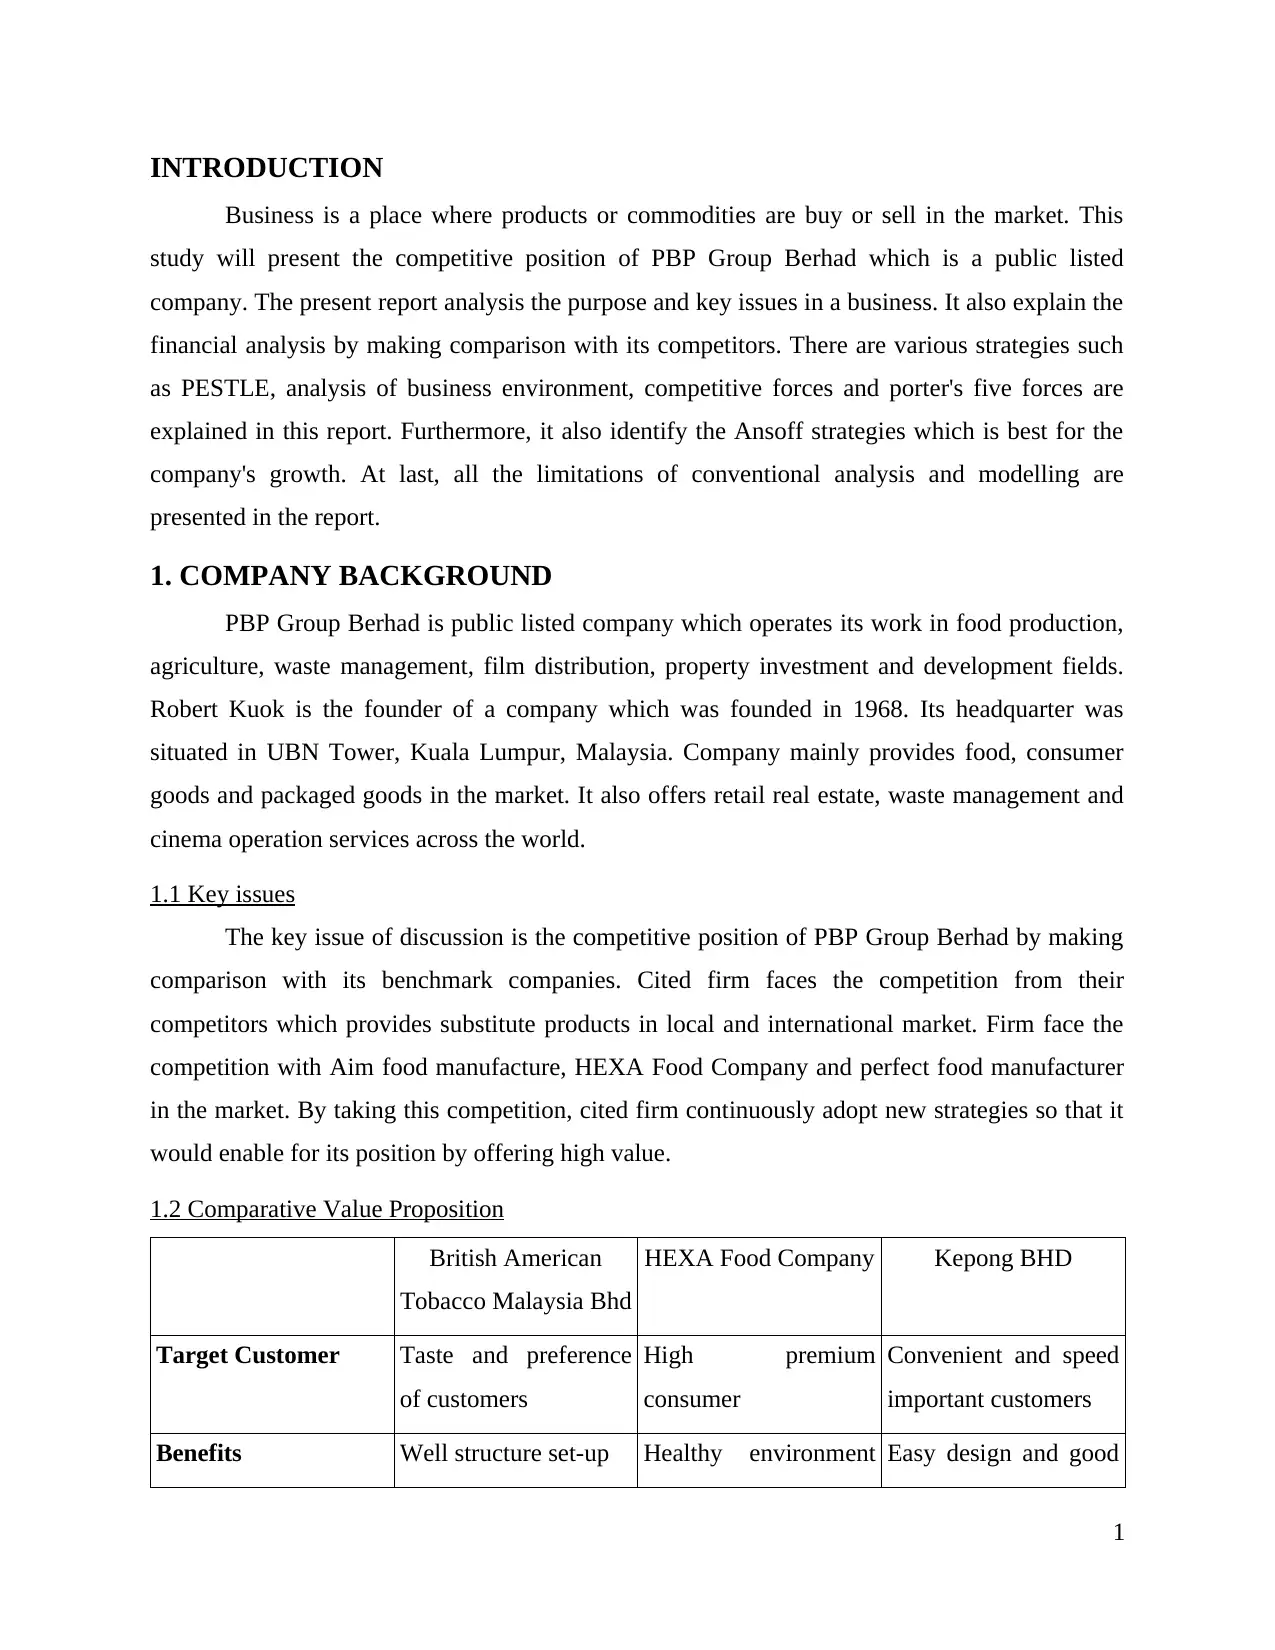
INTRODUCTION
Business is a place where products or commodities are buy or sell in the market. This
study will present the competitive position of PBP Group Berhad which is a public listed
company. The present report analysis the purpose and key issues in a business. It also explain the
financial analysis by making comparison with its competitors. There are various strategies such
as PESTLE, analysis of business environment, competitive forces and porter's five forces are
explained in this report. Furthermore, it also identify the Ansoff strategies which is best for the
company's growth. At last, all the limitations of conventional analysis and modelling are
presented in the report.
1. COMPANY BACKGROUND
PBP Group Berhad is public listed company which operates its work in food production,
agriculture, waste management, film distribution, property investment and development fields.
Robert Kuok is the founder of a company which was founded in 1968. Its headquarter was
situated in UBN Tower, Kuala Lumpur, Malaysia. Company mainly provides food, consumer
goods and packaged goods in the market. It also offers retail real estate, waste management and
cinema operation services across the world.
1.1 Key issues
The key issue of discussion is the competitive position of PBP Group Berhad by making
comparison with its benchmark companies. Cited firm faces the competition from their
competitors which provides substitute products in local and international market. Firm face the
competition with Aim food manufacture, HEXA Food Company and perfect food manufacturer
in the market. By taking this competition, cited firm continuously adopt new strategies so that it
would enable for its position by offering high value.
1.2 Comparative Value Proposition
British American
Tobacco Malaysia Bhd
HEXA Food Company Kepong BHD
Target Customer Taste and preference
of customers
High premium
consumer
Convenient and speed
important customers
Benefits Well structure set-up Healthy environment Easy design and good
1
Paraphrase This Document
Need a fresh take? Get an instant paraphrase of this document with our AI Paraphraser
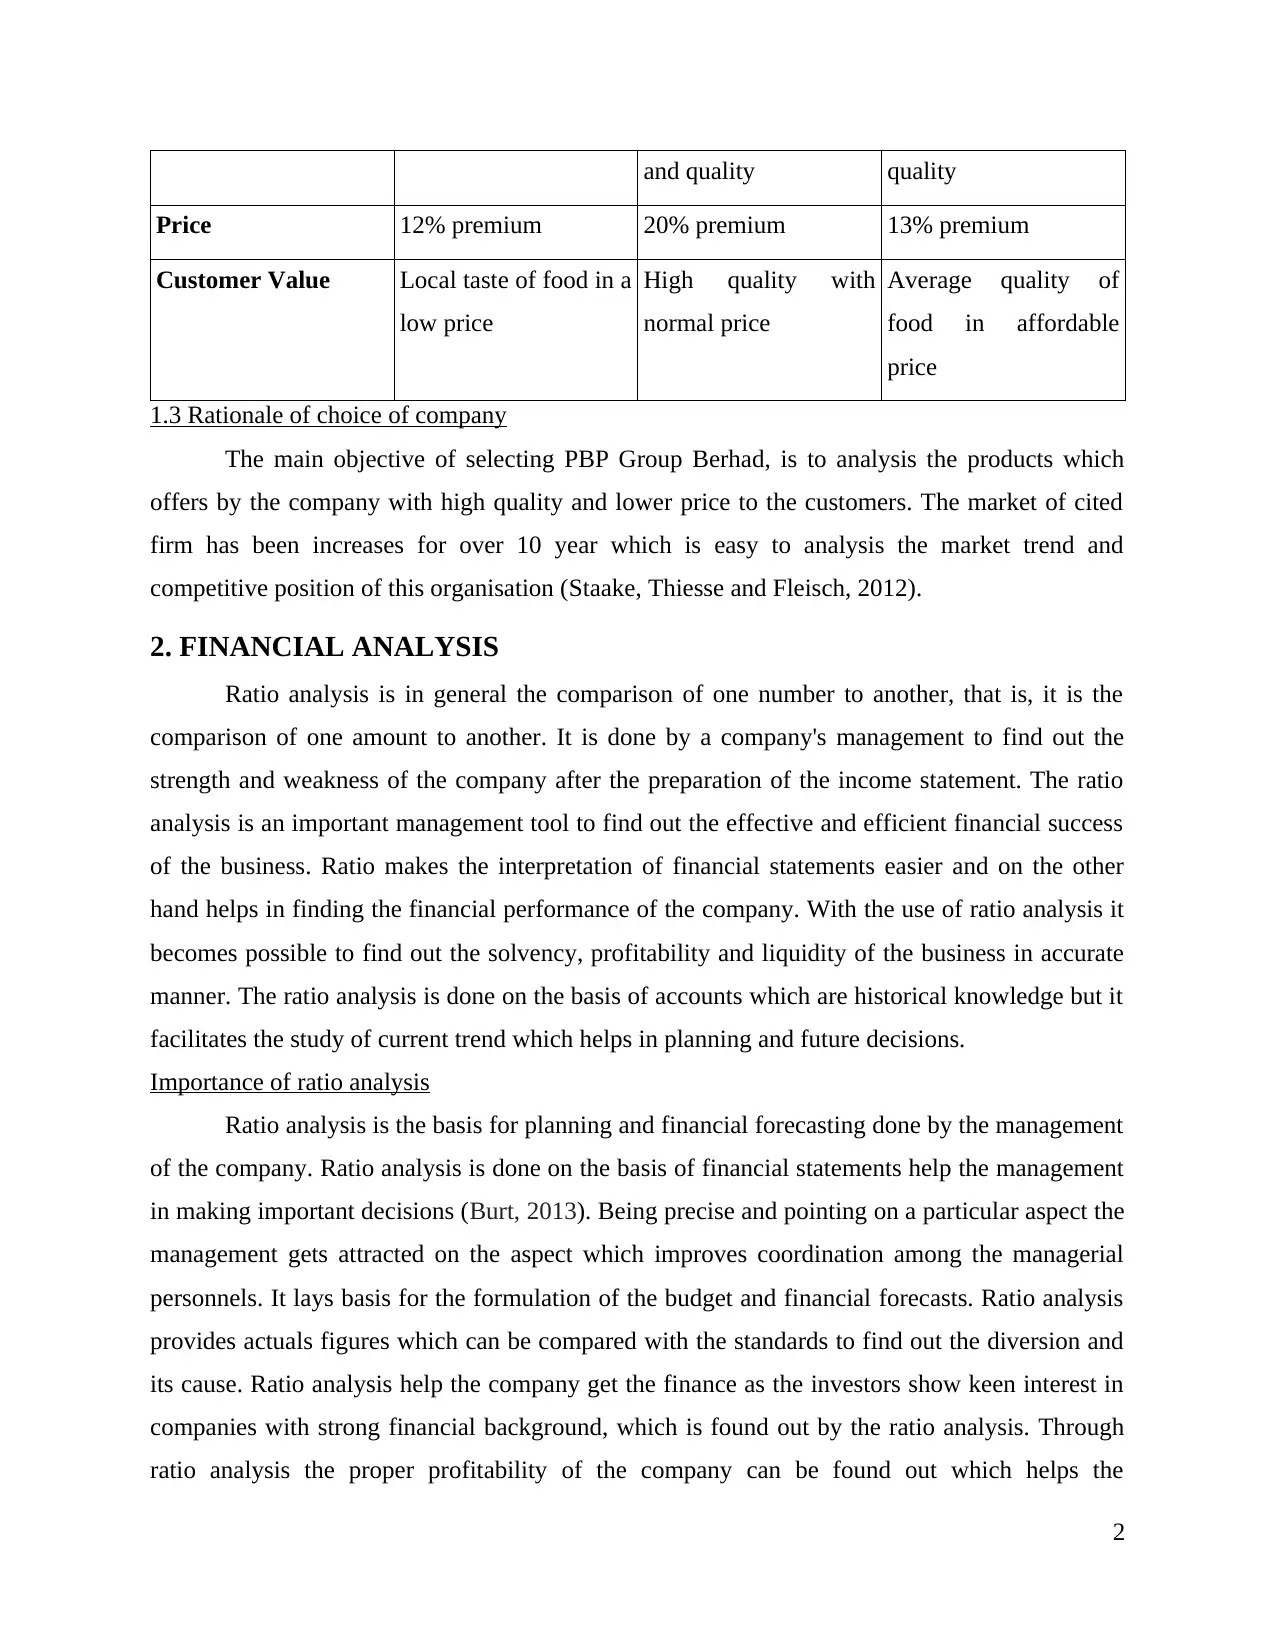
and quality quality
Price 12% premium 20% premium 13% premium
Customer Value Local taste of food in a
low price
High quality with
normal price
Average quality of
food in affordable
price
1.3 Rationale of choice of company
The main objective of selecting PBP Group Berhad, is to analysis the products which
offers by the company with high quality and lower price to the customers. The market of cited
firm has been increases for over 10 year which is easy to analysis the market trend and
competitive position of this organisation (Staake, Thiesse and Fleisch, 2012).
2. FINANCIAL ANALYSIS
Ratio analysis is in general the comparison of one number to another, that is, it is the
comparison of one amount to another. It is done by a company's management to find out the
strength and weakness of the company after the preparation of the income statement. The ratio
analysis is an important management tool to find out the effective and efficient financial success
of the business. Ratio makes the interpretation of financial statements easier and on the other
hand helps in finding the financial performance of the company. With the use of ratio analysis it
becomes possible to find out the solvency, profitability and liquidity of the business in accurate
manner. The ratio analysis is done on the basis of accounts which are historical knowledge but it
facilitates the study of current trend which helps in planning and future decisions.
Importance of ratio analysis
Ratio analysis is the basis for planning and financial forecasting done by the management
of the company. Ratio analysis is done on the basis of financial statements help the management
in making important decisions (Burt, 2013). Being precise and pointing on a particular aspect the
management gets attracted on the aspect which improves coordination among the managerial
personnels. It lays basis for the formulation of the budget and financial forecasts. Ratio analysis
provides actuals figures which can be compared with the standards to find out the diversion and
its cause. Ratio analysis help the company get the finance as the investors show keen interest in
companies with strong financial background, which is found out by the ratio analysis. Through
ratio analysis the proper profitability of the company can be found out which helps the
2
employees negotiate with the management about their wages and salaries. The critical valuation
of the ratios enables the company to makes contingency plans in case the analysis proves and
asks for improvement in the condition.
Types of ratio analysis
Ratio analysis contains numerous kind of ratios, the key ratios are current ratio, quick
ratio, return on assets, return on capital investment, return on equity, debt equity ratio, dividend
payout ratio, price earnings ratio, etc. (Calculation of the ratio for PBP is attached in appendix)
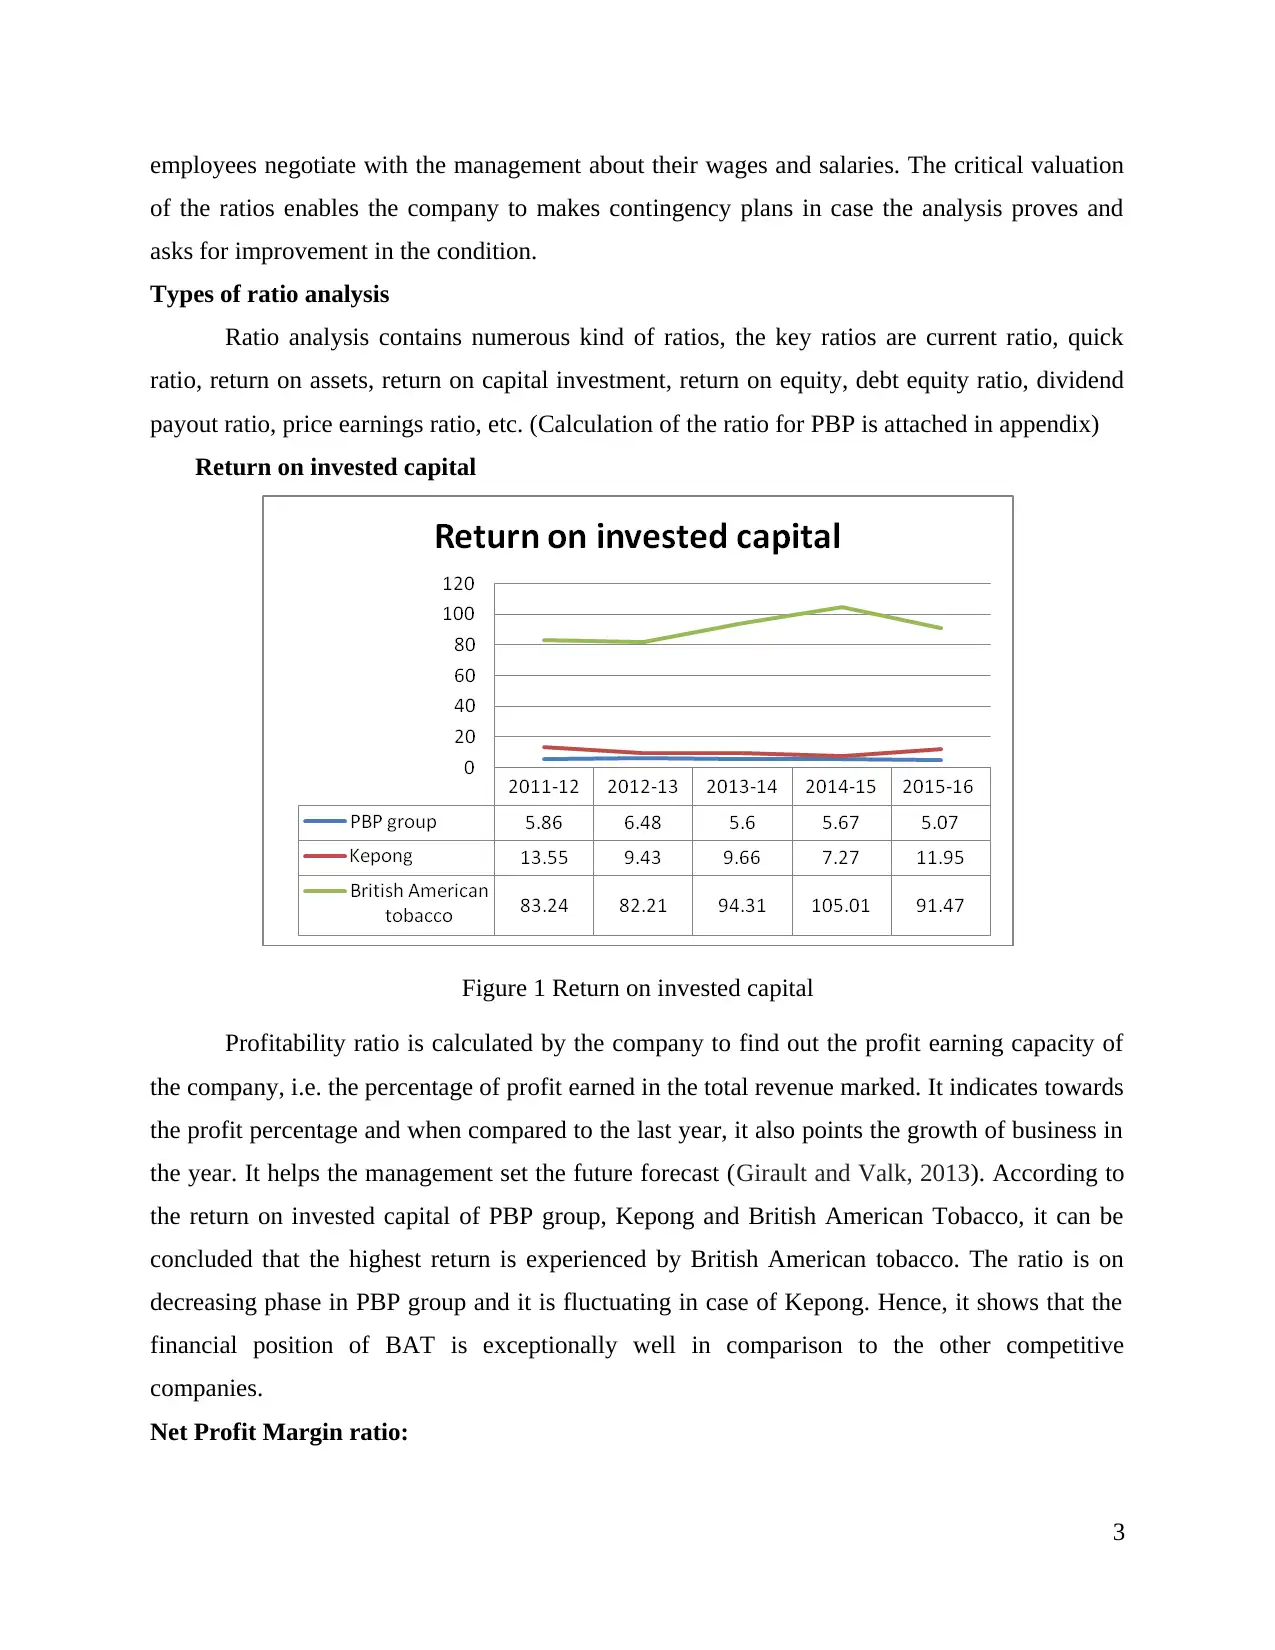
Return on invested capital
Figure 1 Return on invested capital
Profitability ratio is calculated by the company to find out the profit earning capacity of
the company, i.e. the percentage of profit earned in the total revenue marked. It indicates towards
the profit percentage and when compared to the last year, it also points the growth of business in
the year. It helps the management set the future forecast (Girault and Valk, 2013). According to
the return on invested capital of PBP group, Kepong and British American Tobacco, it can be
concluded that the highest return is experienced by British American tobacco. The ratio is on
decreasing phase in PBP group and it is fluctuating in case of Kepong. Hence, it shows that the
financial position of BAT is exceptionally well in comparison to the other competitive
companies.
Net Profit Margin ratio:
3
of the ratios enables the company to makes contingency plans in case the analysis proves and
asks for improvement in the condition.
Types of ratio analysis
Ratio analysis contains numerous kind of ratios, the key ratios are current ratio, quick
ratio, return on assets, return on capital investment, return on equity, debt equity ratio, dividend
payout ratio, price earnings ratio, etc. (Calculation of the ratio for PBP is attached in appendix)
Return on invested capital
Figure 1 Return on invested capital
Profitability ratio is calculated by the company to find out the profit earning capacity of
the company, i.e. the percentage of profit earned in the total revenue marked. It indicates towards
the profit percentage and when compared to the last year, it also points the growth of business in
the year. It helps the management set the future forecast (Girault and Valk, 2013). According to
the return on invested capital of PBP group, Kepong and British American Tobacco, it can be
concluded that the highest return is experienced by British American tobacco. The ratio is on
decreasing phase in PBP group and it is fluctuating in case of Kepong. Hence, it shows that the
financial position of BAT is exceptionally well in comparison to the other competitive
companies.
Net Profit Margin ratio:
3
⊘ This is a preview!⊘
Do you want full access?
Subscribe today to unlock all pages.
Trusted by 1+ million students worldwide
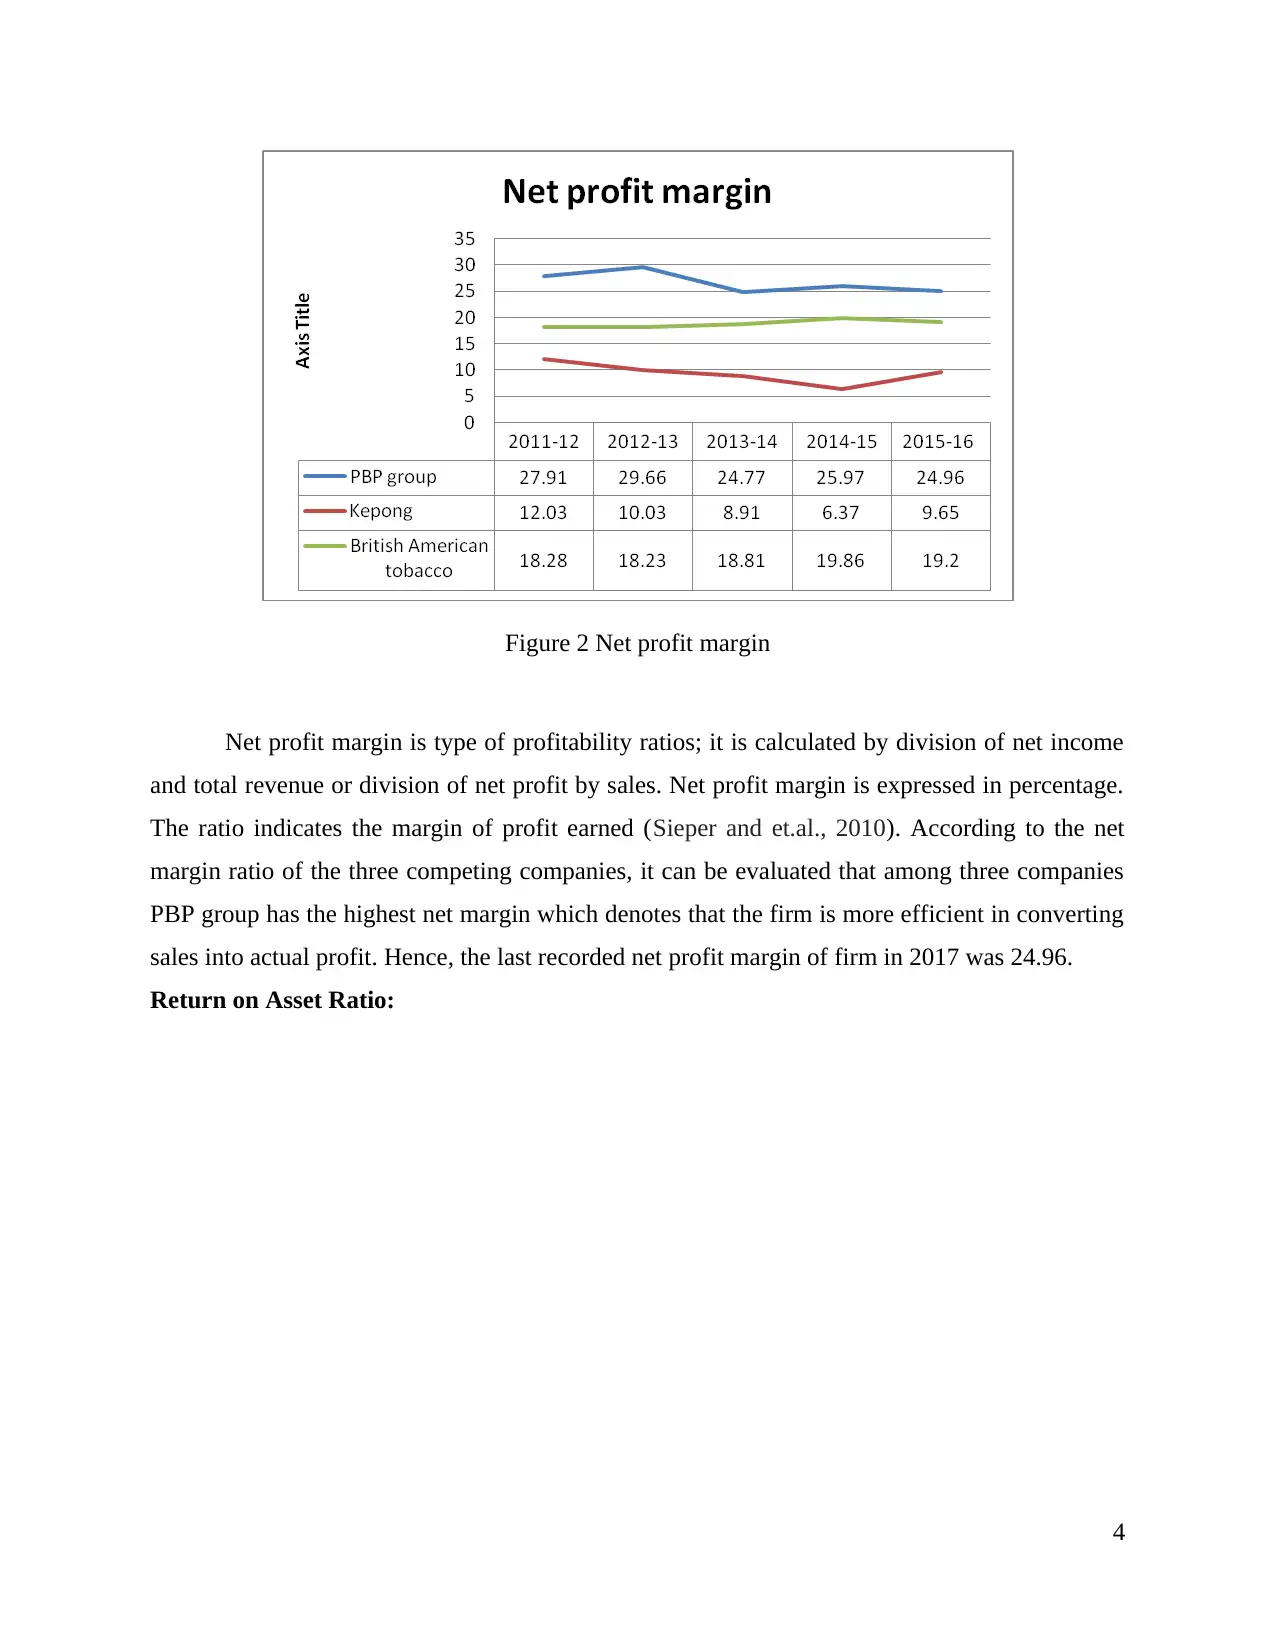
Figure 2 Net profit margin
Net profit margin is type of profitability ratios; it is calculated by division of net income
and total revenue or division of net profit by sales. Net profit margin is expressed in percentage.
The ratio indicates the margin of profit earned (Sieper and et.al., 2010). According to the net
margin ratio of the three competing companies, it can be evaluated that among three companies
PBP group has the highest net margin which denotes that the firm is more efficient in converting
sales into actual profit. Hence, the last recorded net profit margin of firm in 2017 was 24.96.
Return on Asset Ratio:
4
Paraphrase This Document
Need a fresh take? Get an instant paraphrase of this document with our AI Paraphraser
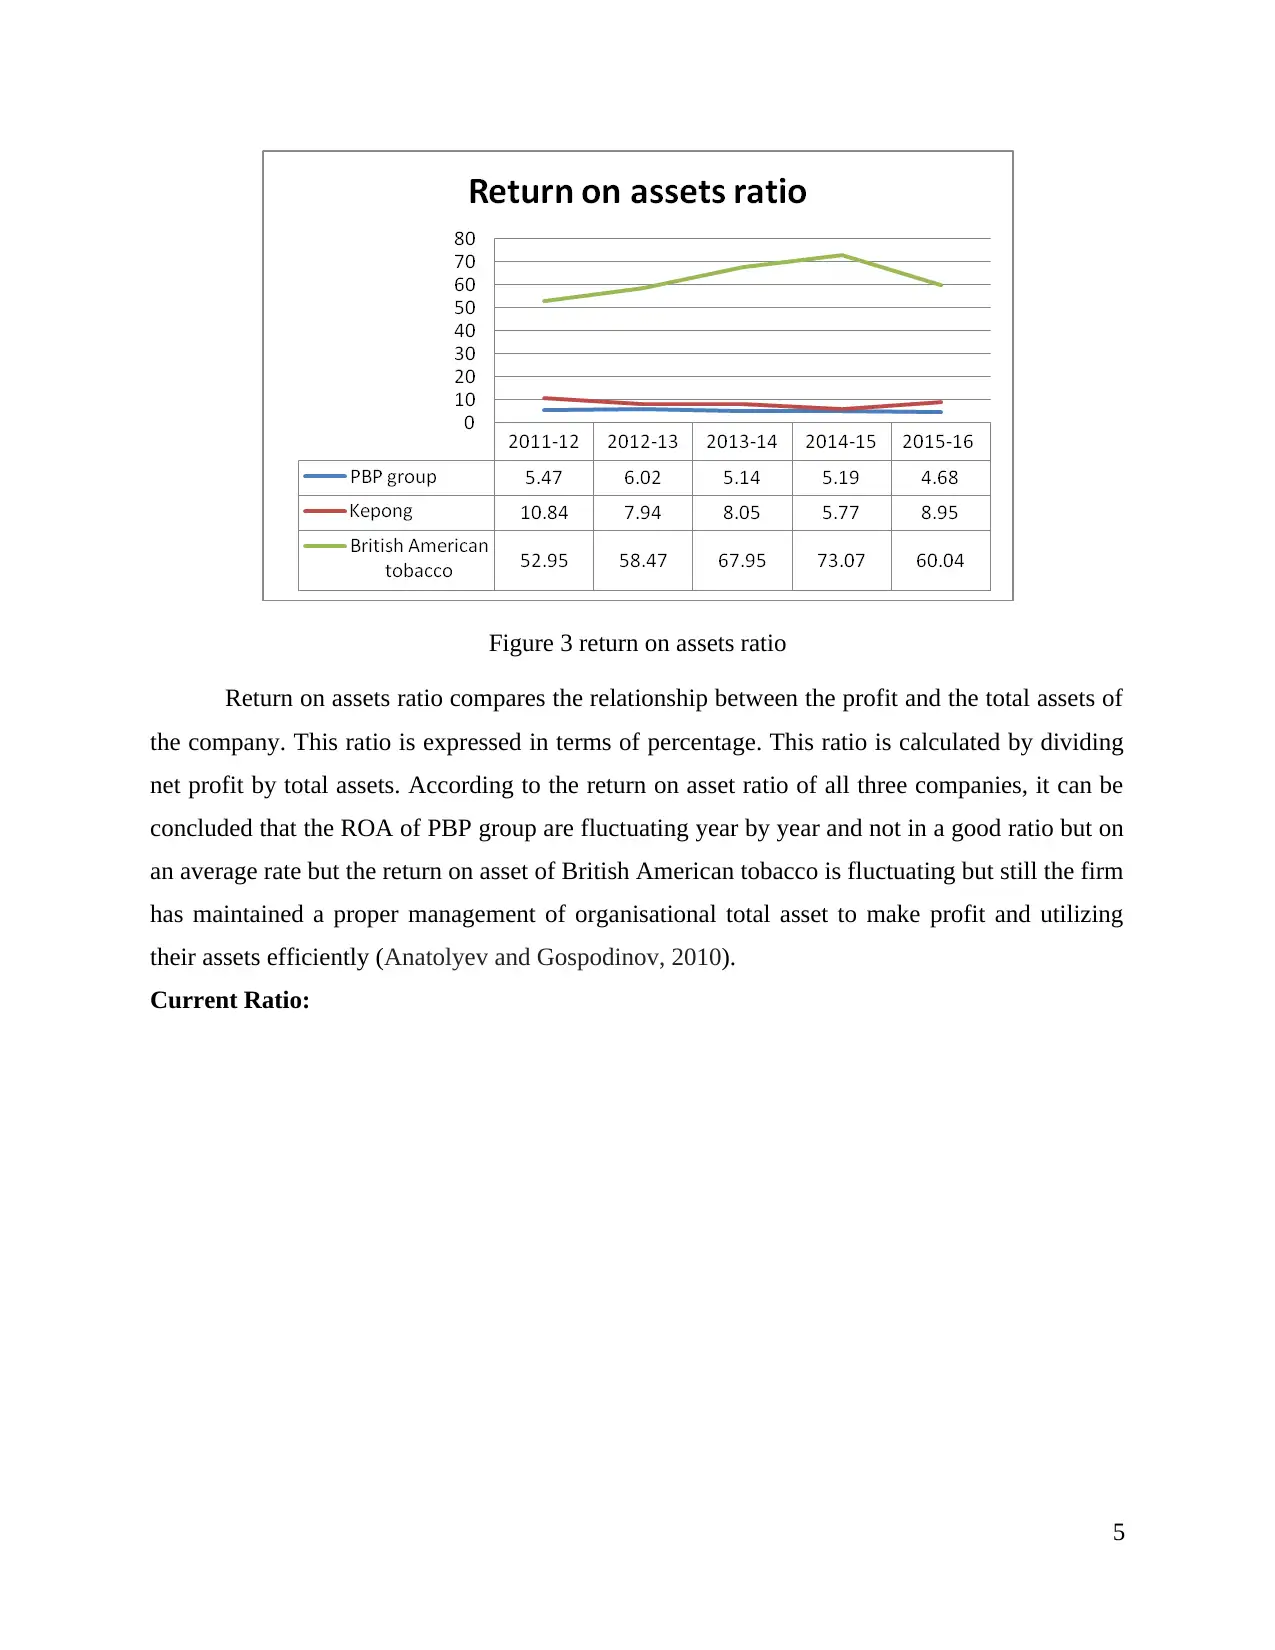
Figure 3 return on assets ratio
Return on assets ratio compares the relationship between the profit and the total assets of
the company. This ratio is expressed in terms of percentage. This ratio is calculated by dividing
net profit by total assets. According to the return on asset ratio of all three companies, it can be
concluded that the ROA of PBP group are fluctuating year by year and not in a good ratio but on
an average rate but the return on asset of British American tobacco is fluctuating but still the firm
has maintained a proper management of organisational total asset to make profit and utilizing
their assets efficiently (Anatolyev and Gospodinov, 2010).
Current Ratio:
5
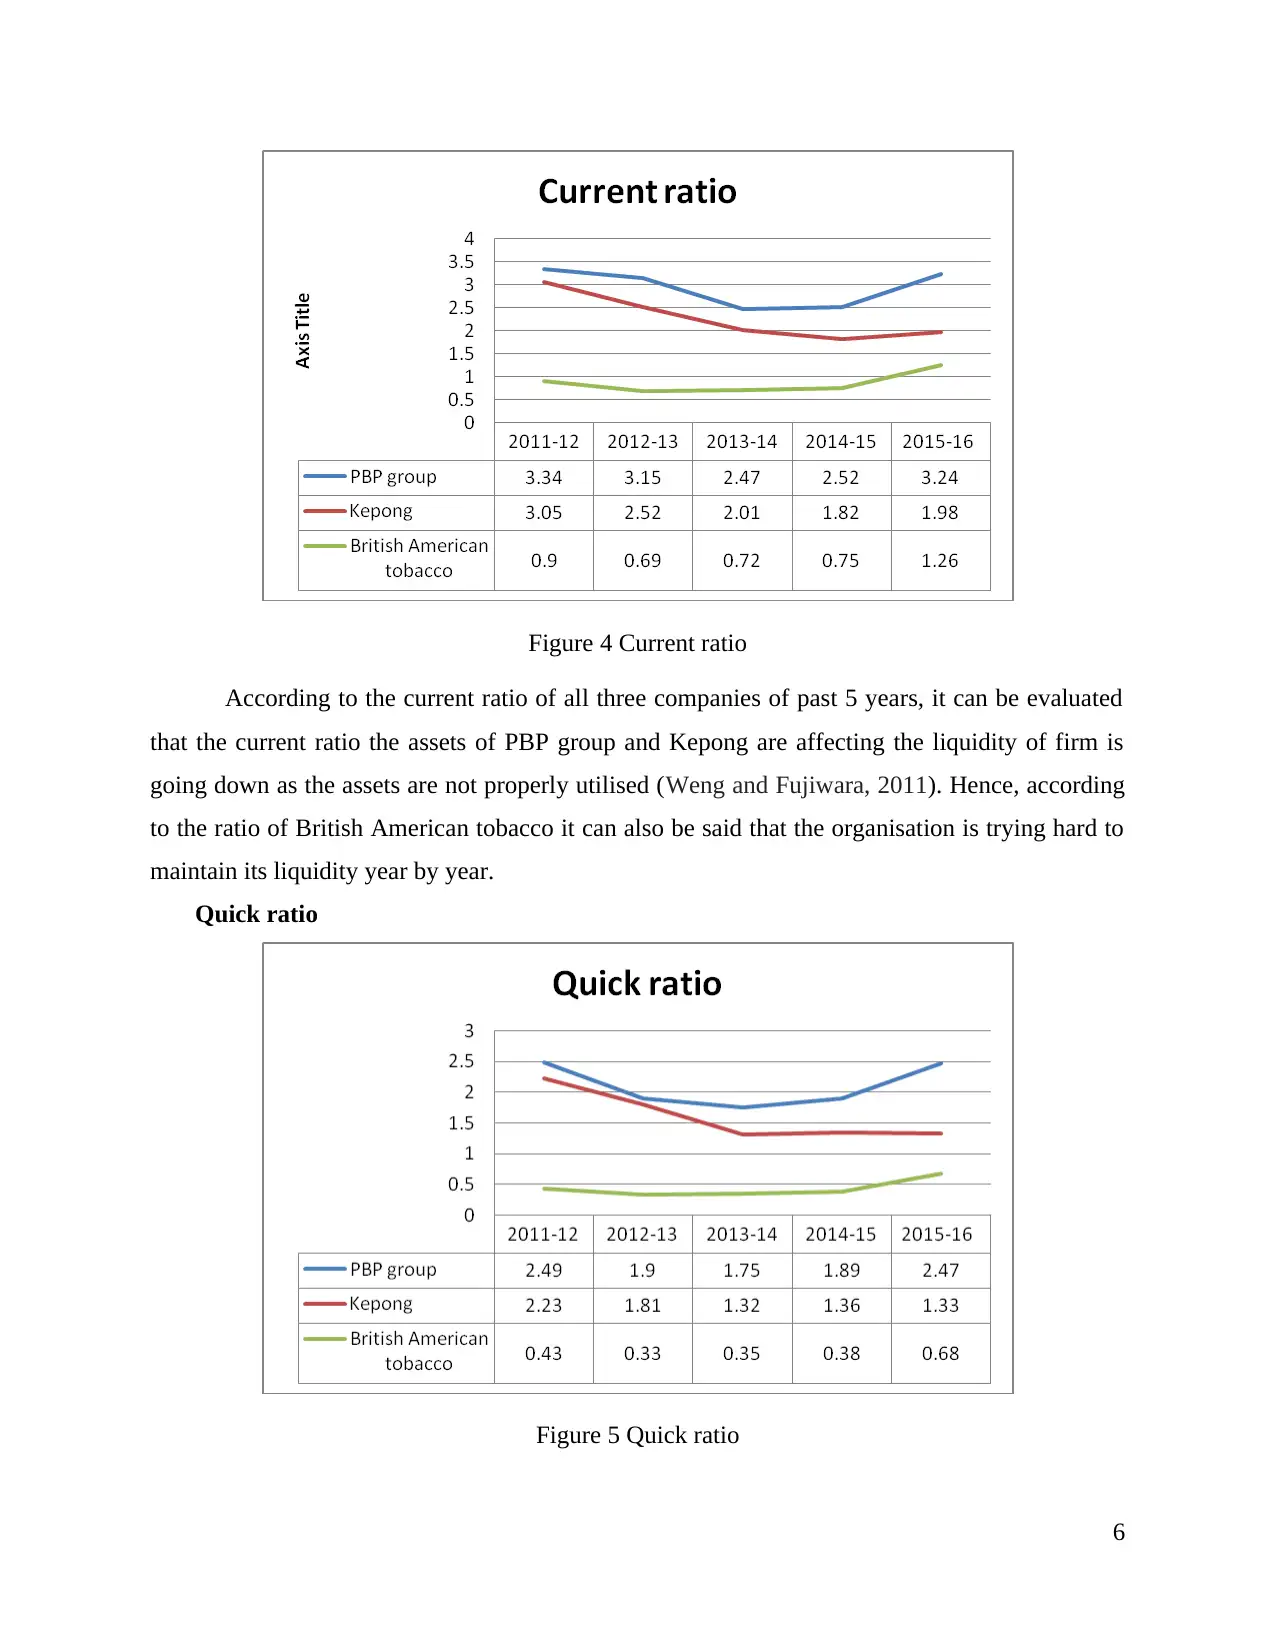
Figure 4 Current ratio
According to the current ratio of all three companies of past 5 years, it can be evaluated
that the current ratio the assets of PBP group and Kepong are affecting the liquidity of firm is
going down as the assets are not properly utilised (Weng and Fujiwara, 2011). Hence, according
to the ratio of British American tobacco it can also be said that the organisation is trying hard to
maintain its liquidity year by year.
Quick ratio
Figure 5 Quick ratio
6
⊘ This is a preview!⊘
Do you want full access?
Subscribe today to unlock all pages.
Trusted by 1+ million students worldwide
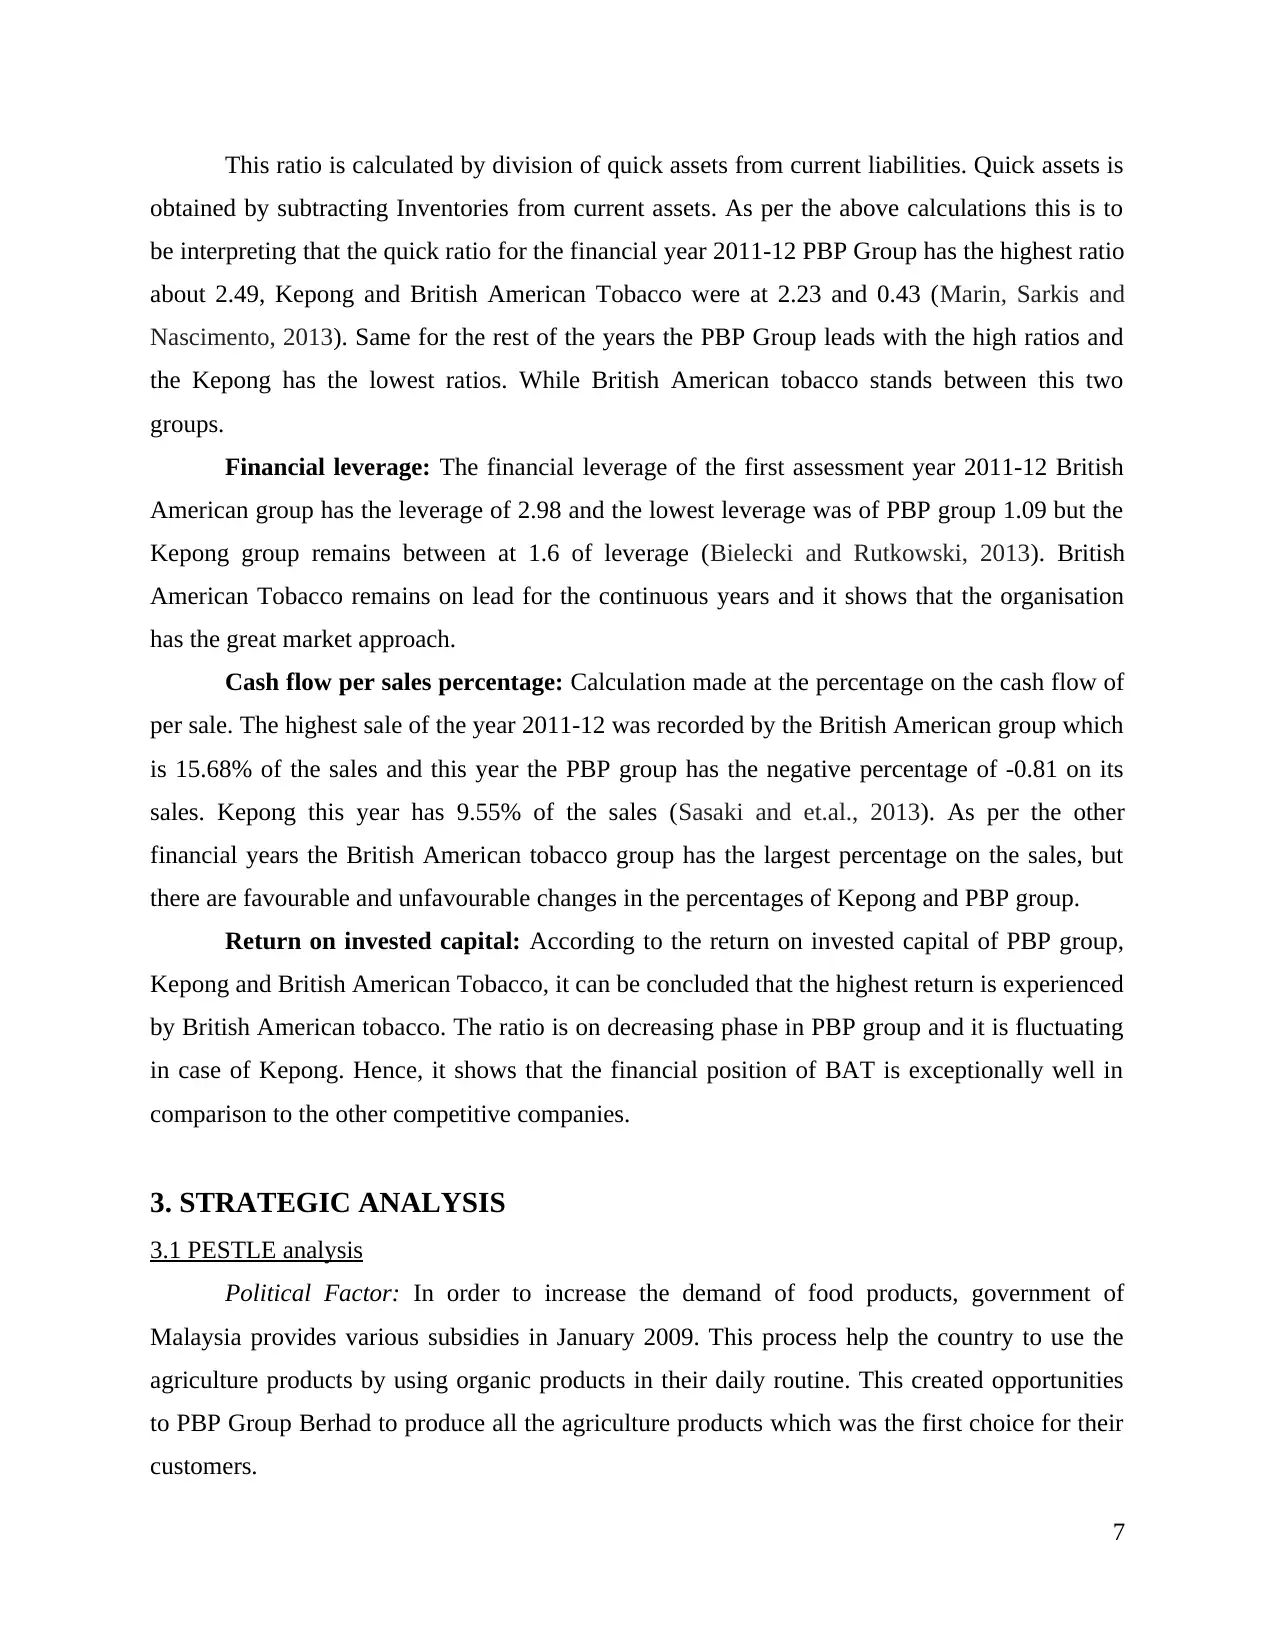
This ratio is calculated by division of quick assets from current liabilities. Quick assets is
obtained by subtracting Inventories from current assets. As per the above calculations this is to
be interpreting that the quick ratio for the financial year 2011-12 PBP Group has the highest ratio
about 2.49, Kepong and British American Tobacco were at 2.23 and 0.43 (Marin, Sarkis and
Nascimento, 2013). Same for the rest of the years the PBP Group leads with the high ratios and
the Kepong has the lowest ratios. While British American tobacco stands between this two
groups.
Financial leverage: The financial leverage of the first assessment year 2011-12 British
American group has the leverage of 2.98 and the lowest leverage was of PBP group 1.09 but the
Kepong group remains between at 1.6 of leverage (Bielecki and Rutkowski, 2013). British
American Tobacco remains on lead for the continuous years and it shows that the organisation
has the great market approach.
Cash flow per sales percentage: Calculation made at the percentage on the cash flow of
per sale. The highest sale of the year 2011-12 was recorded by the British American group which
is 15.68% of the sales and this year the PBP group has the negative percentage of -0.81 on its
sales. Kepong this year has 9.55% of the sales (Sasaki and et.al., 2013). As per the other
financial years the British American tobacco group has the largest percentage on the sales, but
there are favourable and unfavourable changes in the percentages of Kepong and PBP group.
Return on invested capital: According to the return on invested capital of PBP group,
Kepong and British American Tobacco, it can be concluded that the highest return is experienced
by British American tobacco. The ratio is on decreasing phase in PBP group and it is fluctuating
in case of Kepong. Hence, it shows that the financial position of BAT is exceptionally well in
comparison to the other competitive companies.
3. STRATEGIC ANALYSIS
3.1 PESTLE analysis
Political Factor: In order to increase the demand of food products, government of
Malaysia provides various subsidies in January 2009. This process help the country to use the
agriculture products by using organic products in their daily routine. This created opportunities
to PBP Group Berhad to produce all the agriculture products which was the first choice for their
customers.
7
Paraphrase This Document
Need a fresh take? Get an instant paraphrase of this document with our AI Paraphraser
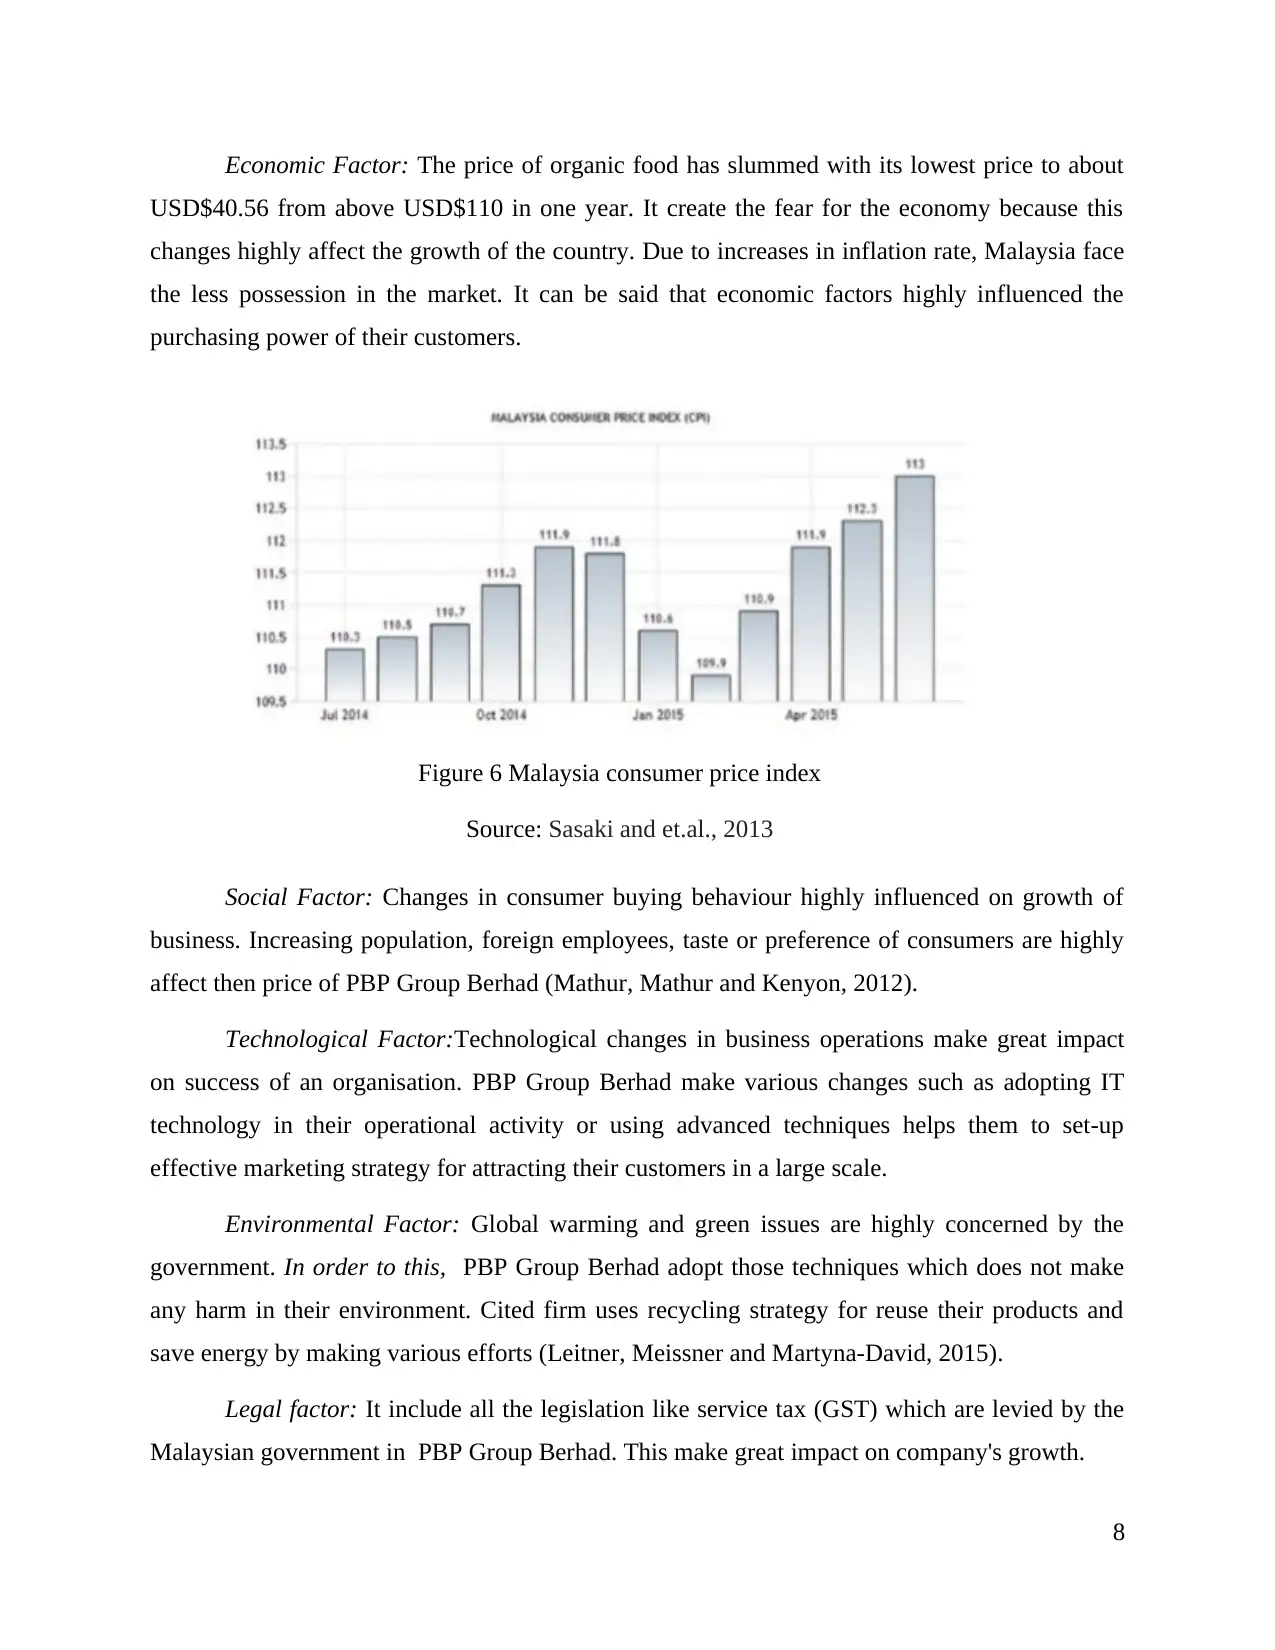
Economic Factor: The price of organic food has slummed with its lowest price to about
USD$40.56 from above USD$110 in one year. It create the fear for the economy because this
changes highly affect the growth of the country. Due to increases in inflation rate, Malaysia face
the less possession in the market. It can be said that economic factors highly influenced the
purchasing power of their customers.
Figure 6 Malaysia consumer price index
Source: Sasaki and et.al., 2013
Social Factor: Changes in consumer buying behaviour highly influenced on growth of
business. Increasing population, foreign employees, taste or preference of consumers are highly
affect then price of PBP Group Berhad (Mathur, Mathur and Kenyon, 2012).
Technological Factor:Technological changes in business operations make great impact
on success of an organisation. PBP Group Berhad make various changes such as adopting IT
technology in their operational activity or using advanced techniques helps them to set-up
effective marketing strategy for attracting their customers in a large scale.
Environmental Factor: Global warming and green issues are highly concerned by the
government. In order to this, PBP Group Berhad adopt those techniques which does not make
any harm in their environment. Cited firm uses recycling strategy for reuse their products and
save energy by making various efforts (Leitner, Meissner and Martyna-David, 2015).
Legal factor: It include all the legislation like service tax (GST) which are levied by the
Malaysian government in PBP Group Berhad. This make great impact on company's growth.
8
3.2 New forces in PBP Group Berhad
By analysing the various factors with the help of PESTLE, there are some other factors
with highly affect the PBP Group Berhad company. Nowadays, digitalisation, globalisation and
deregulation is major factors which affect the cited firm's operational activity. For example:
People have more information about the products and available market which render best quality
in a low price. It can be said that cited firm face the problem with digitalisation in present time.
3.3 Operations and analysis of organisation
PBP Group Berhad has continually adopt new strategies for expanding their business in a
global market. To beat the competitive situation, management of cited firm performs all the
operations in an effective manner. Diversified culture is managed by the business and it mainly
target the young and adults of ages 20-35 years (Kernbach, Eppler and Bresciani, 2015). Firm
also various issues like demand of customers which increases in a large scale. Digitalisation and
changes in market helps the customers to get the information about the products in online. For
example: Quality of products can be pre-determined by the customers through visiting the page
of a particular company. This has make a great pressure on firm's operational process. Cited firm
also face the problem of their competitors which are available in the market with their substitute
products. In order to this, company need to adopt effective pricing strategies and complete
analysis of market so that it can overcome its threat in the competitive market.
3.4 Success Factors
There are some factors which make positive impact on PBP Group Berhad company's
success. It includes wide range of quality products, highly influenced taste in their food products
and innovation etc. Firm adopt innovative changes in their production strategies by which it can
attract the customers in large number. It deals in diversified culture, so that to satisfy the need of
every customer is the best fact which provides the firm for acquiring its pre-determined goals.
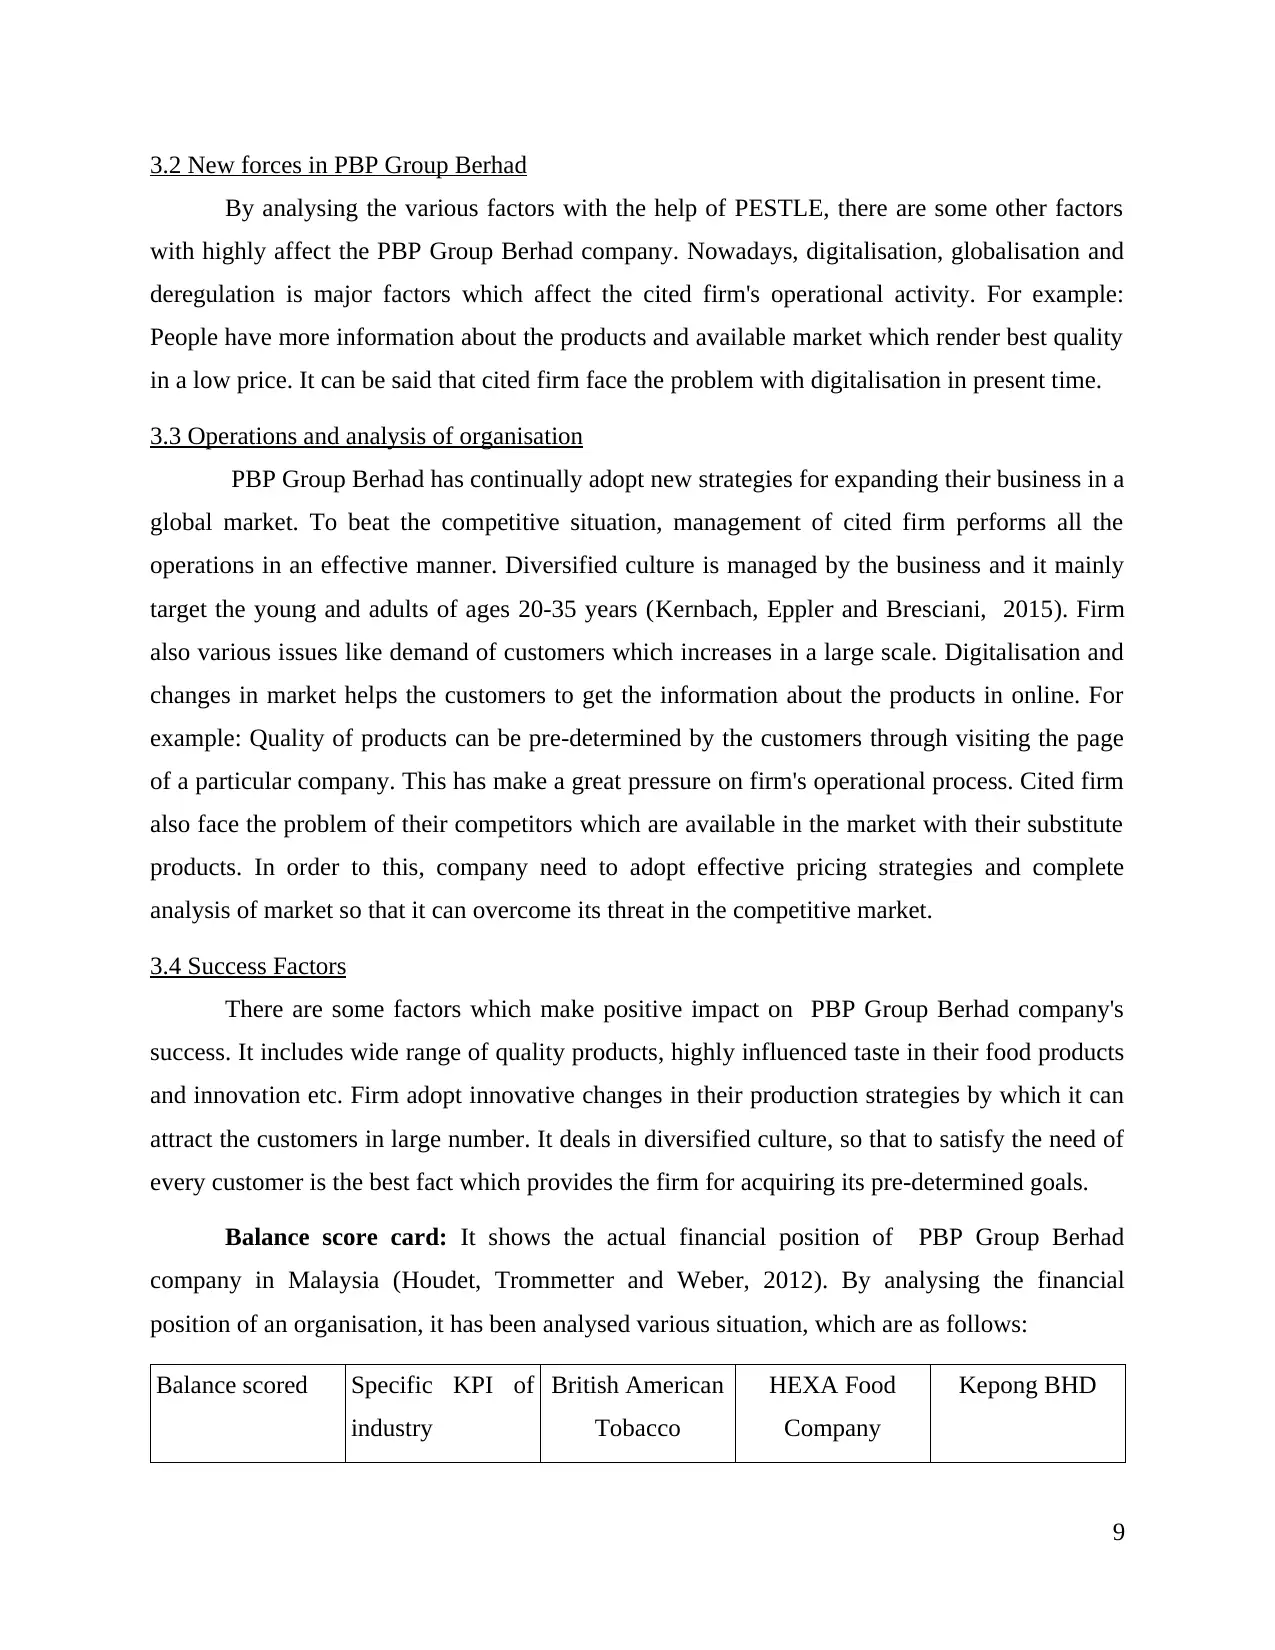
Balance score card: It shows the actual financial position of PBP Group Berhad
company in Malaysia (Houdet, Trommetter and Weber, 2012). By analysing the financial
position of an organisation, it has been analysed various situation, which are as follows:
Balance scored Specific KPI of
industry
British American
Tobacco
HEXA Food
Company
Kepong BHD
9
By analysing the various factors with the help of PESTLE, there are some other factors
with highly affect the PBP Group Berhad company. Nowadays, digitalisation, globalisation and
deregulation is major factors which affect the cited firm's operational activity. For example:
People have more information about the products and available market which render best quality
in a low price. It can be said that cited firm face the problem with digitalisation in present time.
3.3 Operations and analysis of organisation
PBP Group Berhad has continually adopt new strategies for expanding their business in a
global market. To beat the competitive situation, management of cited firm performs all the
operations in an effective manner. Diversified culture is managed by the business and it mainly
target the young and adults of ages 20-35 years (Kernbach, Eppler and Bresciani, 2015). Firm
also various issues like demand of customers which increases in a large scale. Digitalisation and
changes in market helps the customers to get the information about the products in online. For
example: Quality of products can be pre-determined by the customers through visiting the page
of a particular company. This has make a great pressure on firm's operational process. Cited firm
also face the problem of their competitors which are available in the market with their substitute
products. In order to this, company need to adopt effective pricing strategies and complete
analysis of market so that it can overcome its threat in the competitive market.
3.4 Success Factors
There are some factors which make positive impact on PBP Group Berhad company's
success. It includes wide range of quality products, highly influenced taste in their food products
and innovation etc. Firm adopt innovative changes in their production strategies by which it can
attract the customers in large number. It deals in diversified culture, so that to satisfy the need of
every customer is the best fact which provides the firm for acquiring its pre-determined goals.
Balance score card: It shows the actual financial position of PBP Group Berhad
company in Malaysia (Houdet, Trommetter and Weber, 2012). By analysing the financial
position of an organisation, it has been analysed various situation, which are as follows:
Balance scored Specific KPI of
industry
British American
Tobacco
HEXA Food
Company
Kepong BHD
9
⊘ This is a preview!⊘
Do you want full access?
Subscribe today to unlock all pages.
Trusted by 1+ million students worldwide
1 out of 20
Related Documents


Your All-in-One AI-Powered Toolkit for Academic Success.
+13062052269
info@desklib.com
Available 24*7 on WhatsApp / Email
![[object Object]](/_next/static/media/star-bottom.7253800d.svg)
Unlock your academic potential
Copyright © 2020–2026 A2Z Services. All Rights Reserved. Developed and managed by ZUCOL.