Analysis of the Pharmaceutical Benefits Scheme in Australia
VerifiedAdded on 2020/04/21
|18
|2759
|106
AI Summary
The Pharmaceutical Benefits Scheme (PBS) is crucial for ensuring drug affordability in Australia but faces challenges like rising costs. Between 2014 and 2023, PBS spending increased due to factors such as the introduction of new medications, high-cost biologics, and demographic shifts towards an aging population with chronic illnesses. Despite mechanisms to control costs, such as price negotiations and generic substitutions, expenditure continues to rise significantly. Recommendations suggest regular reviews of drug pricing policies, international benchmarking, advocacy for cost-effective drugs, independent governance, and establishment of a dedicated authority to oversee subsidized medicines. The goal is to achieve a balance between accessibility, affordability, and innovation in the healthcare system.
Running head: AUSTRALIAN PHARMACEUTICAL BENEFITS SCHEME 1
The Australian Pharmaceutical Benefits Scheme and the consumption of medicines in
Australia
Name
Institution
Table of Contents
The Australian Pharmaceutical Benefits Scheme and the consumption of medicines in
Australia
Name
Institution
Table of Contents
Paraphrase This Document
Need a fresh take? Get an instant paraphrase of this document with our AI Paraphraser
AUSTRALIAN PHARMACEUTICAL BENEFITS SCHEME 2
Executive summary....................................................................................................................3
Introduction................................................................................................................................4
Discussion..................................................................................................................................6
Decision Makers in the Structure of Australia’s Pharmaceutical Benefits Scheme..............6
The Costs of the Pharmaceutical Benefits Scheme................................................................8
Costs of Medicine Consumption in Australia........................................................................9
Types of Medicines Consumed............................................................................................10
Problems with the Pharmaceutical Benefits Scheme...........................................................12
Recommendations....................................................................................................................12
References................................................................................................................................14
AUSTRALIAN PHARMACEUTICAL BENEFITS SCHEME 3
Executive summary
The Pharmaceutical Benefits Scheme was introduced with the aim of reducing medical costs
incurred through pharmaceutical costs. However, through the years, the scheme has
evidenced an exponential growth in expenditure, making it less cost-effective compared to
similar schemes in other countries. Australia reports over a 5% increase expenditure each
year, translating to over 20% of the health sector’s department. Drugs commonly used such
as atorvastatin cost up to 50% more compared to New Zealand. Maybe it’s time for revising
the scheme and introduction of new measures such as revising of international benchmarks
and introducing an oversight authority over PBS.
⊘ This is a preview!⊘
Do you want full access?
Subscribe today to unlock all pages.
Trusted by 1+ million students worldwide
AUSTRALIAN PHARMACEUTICAL BENEFITS SCHEME 4
Introduction
The Pharmaceutical Benefits Scheme (PBS) is a program through which the Australian
government subsidises prescription drugs to Australians. The introduction of the scheme can
be traced back to 1944 but in which it had failed to sail through. The successful
reintroduction was attained in 1948 with a limit to offering free drugs for pensioners, while
the rest of Australians were eligible to a total of 139 free drugs which were considered as
“life-saving and disease preventing” (Grove, 2016). It wasn’t until 1960 that the program
attained maturity and was then able to provide access to a wide range of drugs. PBS stands
out as an integral part of Australia’s National Medicines Policy (NMP) whose aim is to foster
favourable health outcomes for Australians by improving accessibility to, and the rational use
of drugs (Department of Health (DoH), 2014). The Pharmaceutical Benefits Scheme is
founded by provisions of the National Health Act 1953 (Grove, 2016).
The 2014/15 annual report by the Department of Health (DoH) put the cost of PBS at $9.1
billion following over two hundred million prescriptions having been subsidised during the
same duration (DoH, 2015). This PBS cost accounted for 21% of the funds that were
administered by the department of health during the same duration (Grove, 2016). The
expenditure on the scheme is uncapped and as a result, it increases in relation to increase in
demand and the introduction of new drugs. Between 2005/6 and 2013/14, the total
expenditure on the scheme grew at about 4.9%, which however was not the case for the
duration between 2013/14 and 2014/15, in which the expenditure fell slightly by 0.5%
(Grove, 2016). Regardless of the marginal decrease, analysis of the projected government
spending on pharmaceutical shows a gradual increase. Evidenced by the fact that the
expenditure has more than doubled in the last ten years, the same is projected to continue,
Paraphrase This Document
Need a fresh take? Get an instant paraphrase of this document with our AI Paraphraser
AUSTRALIAN PHARMACEUTICAL BENEFITS SCHEME 5
making this expenditure one of the fastest growing areas of Australian government’s
expenditure. It has been established that the scheme pays an excess of at least $1.3 billion for
prescription drugs. Therefore, this report seeks to describe the scheme, investigate the costs
and causes of medicine consumption in the country, the types of medicines consumed,
characterise the problems with the scheme, and lastly make recommendations for cost
reduction and lower consumption.
AUSTRALIAN PHARMACEUTICAL BENEFITS SCHEME 6
Discussion
Decision Makers in the Structure of Australia’s Pharmaceutical Benefits Scheme
The PBS is undoubtedly an integral component of Australia’s health system that enables
consumers timely access to affordable medicines (close to 800 in number as of June 2015).
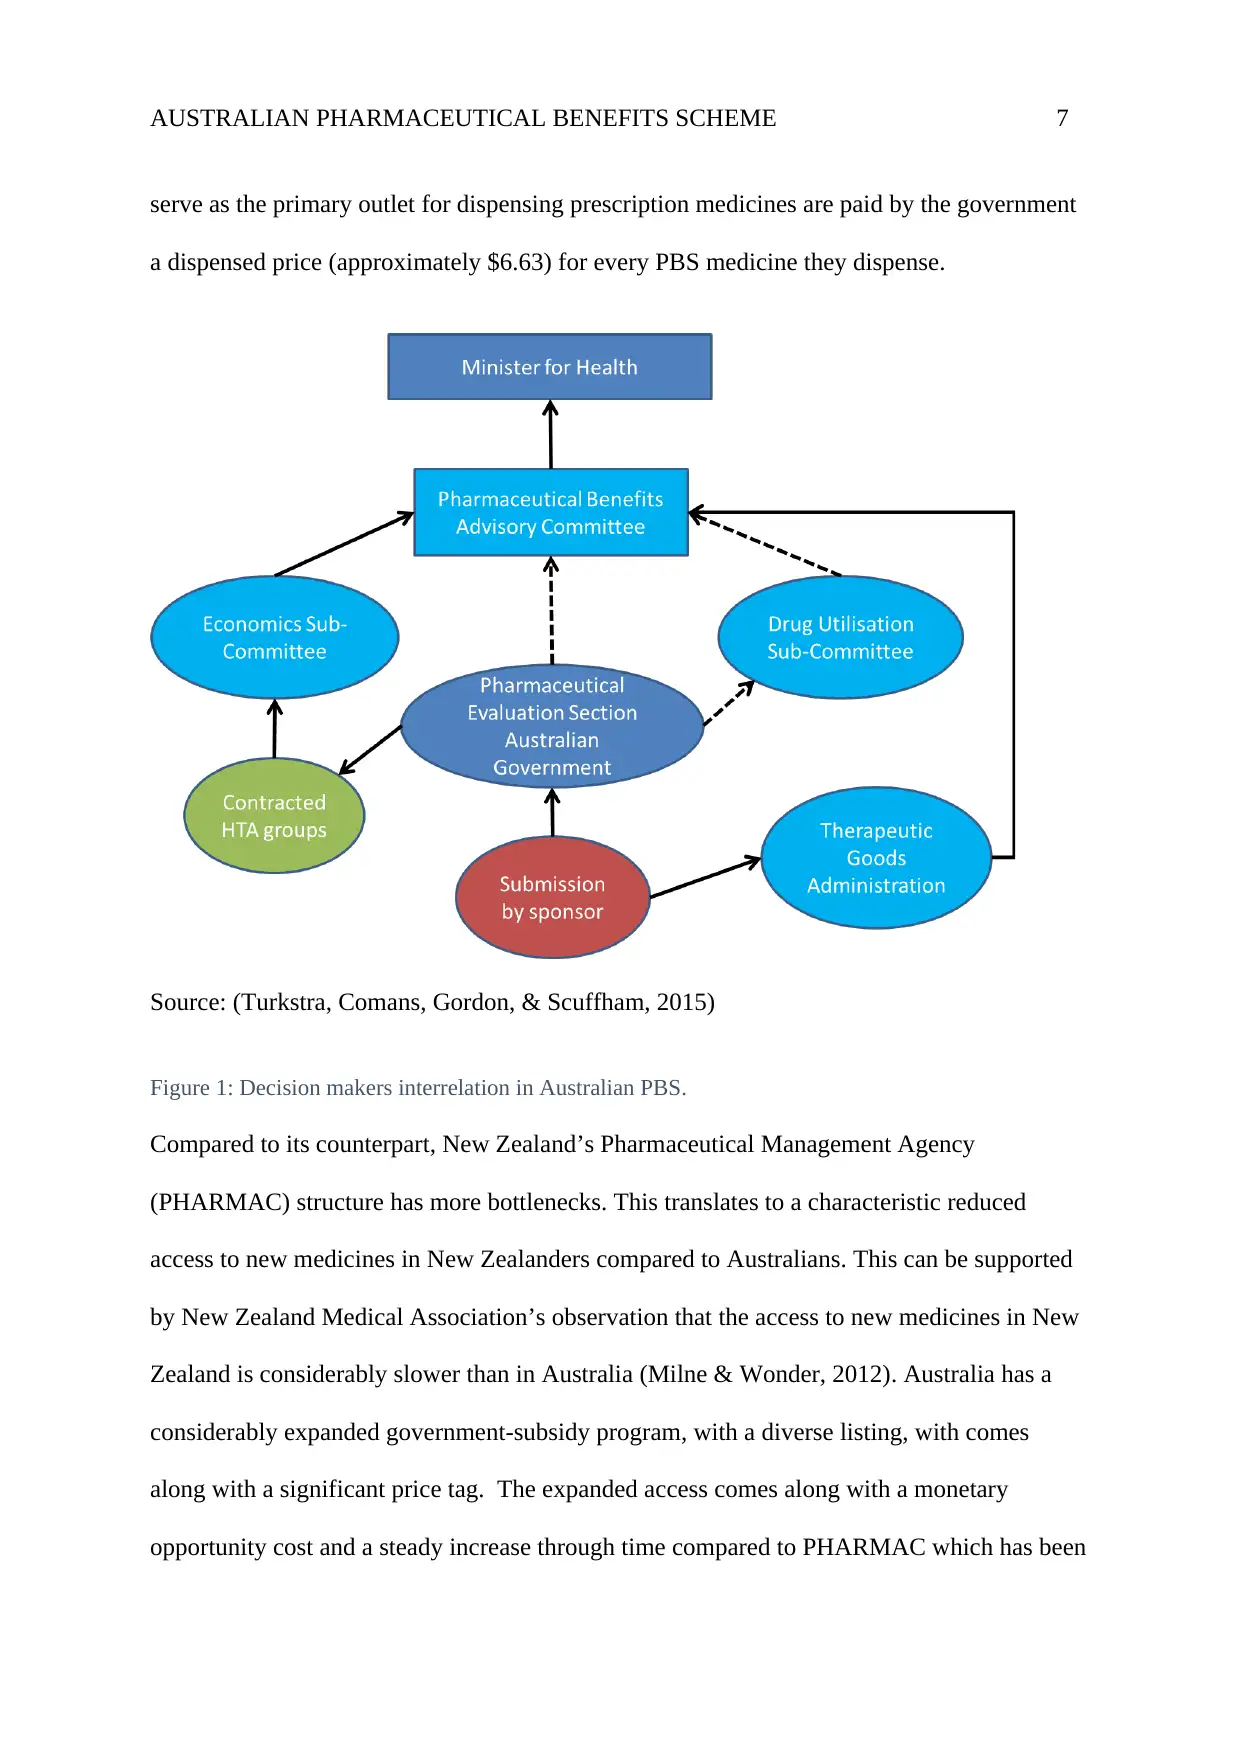
For a medicine to be subsidised, it has to undergo a hierarchical process that ends with the
minister who assents for inclusion in the schedule as shown in figure 1 below. Before a
medicine is listed on the PBS, it has to be approved by the Therapeutic Goods Administration
(TGA). TGA reviews evidence on the safety and effectiveness of the medication for the
proposed uses. Pharmaceutical manufacturers make submissions for listing on the PBS
schedule for medicines that are TGA-registered or are in the process of registration by TGA
(Turkstra, Comans, Gordon, & Scuffham, 2015). For a medicine to be listed on the PBS, it
has to be recommended by the Pharmaceutical Benefits Advisory Committee (PBAC) after
consideration of factors such as safety, cost, and effectiveness compared with others
(Wonder, Blackhouse, & Sullivan, 2012). PBAC also makes recommendations to the minister
on medicines for specific palliative listing. The Health Technology Assessment Section
(HTAS) looks after and provides secretariat support for PBAC, Economics Sub-
committee(ESC), and the Drug Utilisation Sub-Committee (DUSC) (Wonder, Blackhouse, &
Sullivan, 2012). The ESC has the mandate of reviewing submissions from sponsors and the
commentaries from the evaluation groups, while the DUSC provides advice pertaining to
expected drug utilisation prior to PBS listing and also monitors the use post-listing.
Consumers pay a co-payment for each medicine purchased with a PBS subsidy. For
concessional access, consumers pay $6.00 whereas for general access, $36.90, and the
government pays the rest (The Pharmaceutical Benefits Scheme, 2017). Pharmacies which
Discussion
Decision Makers in the Structure of Australia’s Pharmaceutical Benefits Scheme
The PBS is undoubtedly an integral component of Australia’s health system that enables
consumers timely access to affordable medicines (close to 800 in number as of June 2015).
For a medicine to be subsidised, it has to undergo a hierarchical process that ends with the
minister who assents for inclusion in the schedule as shown in figure 1 below. Before a
medicine is listed on the PBS, it has to be approved by the Therapeutic Goods Administration
(TGA). TGA reviews evidence on the safety and effectiveness of the medication for the
proposed uses. Pharmaceutical manufacturers make submissions for listing on the PBS
schedule for medicines that are TGA-registered or are in the process of registration by TGA
(Turkstra, Comans, Gordon, & Scuffham, 2015). For a medicine to be listed on the PBS, it
has to be recommended by the Pharmaceutical Benefits Advisory Committee (PBAC) after
consideration of factors such as safety, cost, and effectiveness compared with others
(Wonder, Blackhouse, & Sullivan, 2012). PBAC also makes recommendations to the minister
on medicines for specific palliative listing. The Health Technology Assessment Section
(HTAS) looks after and provides secretariat support for PBAC, Economics Sub-
committee(ESC), and the Drug Utilisation Sub-Committee (DUSC) (Wonder, Blackhouse, &
Sullivan, 2012). The ESC has the mandate of reviewing submissions from sponsors and the
commentaries from the evaluation groups, while the DUSC provides advice pertaining to
expected drug utilisation prior to PBS listing and also monitors the use post-listing.
Consumers pay a co-payment for each medicine purchased with a PBS subsidy. For
concessional access, consumers pay $6.00 whereas for general access, $36.90, and the
government pays the rest (The Pharmaceutical Benefits Scheme, 2017). Pharmacies which
⊘ This is a preview!⊘
Do you want full access?
Subscribe today to unlock all pages.
Trusted by 1+ million students worldwide
AUSTRALIAN PHARMACEUTICAL BENEFITS SCHEME 7
serve as the primary outlet for dispensing prescription medicines are paid by the government
a dispensed price (approximately $6.63) for every PBS medicine they dispense.
Source: (Turkstra, Comans, Gordon, & Scuffham, 2015)
Figure 1: Decision makers interrelation in Australian PBS.
Compared to its counterpart, New Zealand’s Pharmaceutical Management Agency
(PHARMAC) structure has more bottlenecks. This translates to a characteristic reduced
access to new medicines in New Zealanders compared to Australians. This can be supported
by New Zealand Medical Association’s observation that the access to new medicines in New
Zealand is considerably slower than in Australia (Milne & Wonder, 2012). Australia has a
considerably expanded government-subsidy program, with a diverse listing, with comes
along with a significant price tag. The expanded access comes along with a monetary
opportunity cost and a steady increase through time compared to PHARMAC which has been
Paraphrase This Document
Need a fresh take? Get an instant paraphrase of this document with our AI Paraphraser
AUSTRALIAN PHARMACEUTICAL BENEFITS SCHEME 8
able to contain the budget of subsidised medicines whereas widening access to other
medicines (Milne & Wonder, 2012).
The Costs of the Pharmaceutical Benefits Scheme
The growth in pharmaceutical benefits expenditure in Australia has been evidenced to be on
the rise since its inception. An exponential increase has been documented since the beginning
with a staggering 80% rise between 2004 and 2014. Precisely, between 1994/95 and 2004/5,
the expenditure on PBS grew by about 13% each year (DoH, 2017). This was followed by a
drop in its annual growth rate for the duration 2005/6 to 2013/14 by about 4.86%. In 2014-
15, the expenditure on PBS stood at $9.1 billion, followed by a 19.5% increase for the
following year (2015-2016) to stand at $10.8 billion. Notably, this is regardless of a drop in
the total volume of PBS prescriptions by 1.9% for the same duration (DoH, 2016).
According to the Parliamentary Budget Office, the expenditure on PBS is bound to level out
at 0.3% per annum in the medium level ( Parliamentary Budget Office, 2014), but at 4-5%
annually in the longer term (Senate Community Affairs Legislation Committee, 2014) one of
the possible explanations for the reduction can be partially attributed to the effect of various
policies on pricing and changes to arrangements in co-payments and the safety net as
introduced around the same time (2005) (Department of Health and Ageing (DoHA) and
Medicines Australia (MA), 2013).
AUSTRALIAN PHARMACEUTICAL BENEFITS SCHEME 9
2001-
2 2002-
03 2003-
04 2004-
05 2005-
06 2006-
07 2007-
08 2008-
09 2009-
10 2010-
11 2012-
13 2013-
14 2014-
15 2015-
16
0.00
2,000,000,000.00
4,000,000,000.00
6,000,000,000.00
8,000,000,000.00
10,000,000,000.00
12,000,000,000.00
PBS Expenditure 2001- 2016
Financial Year
Expenditure
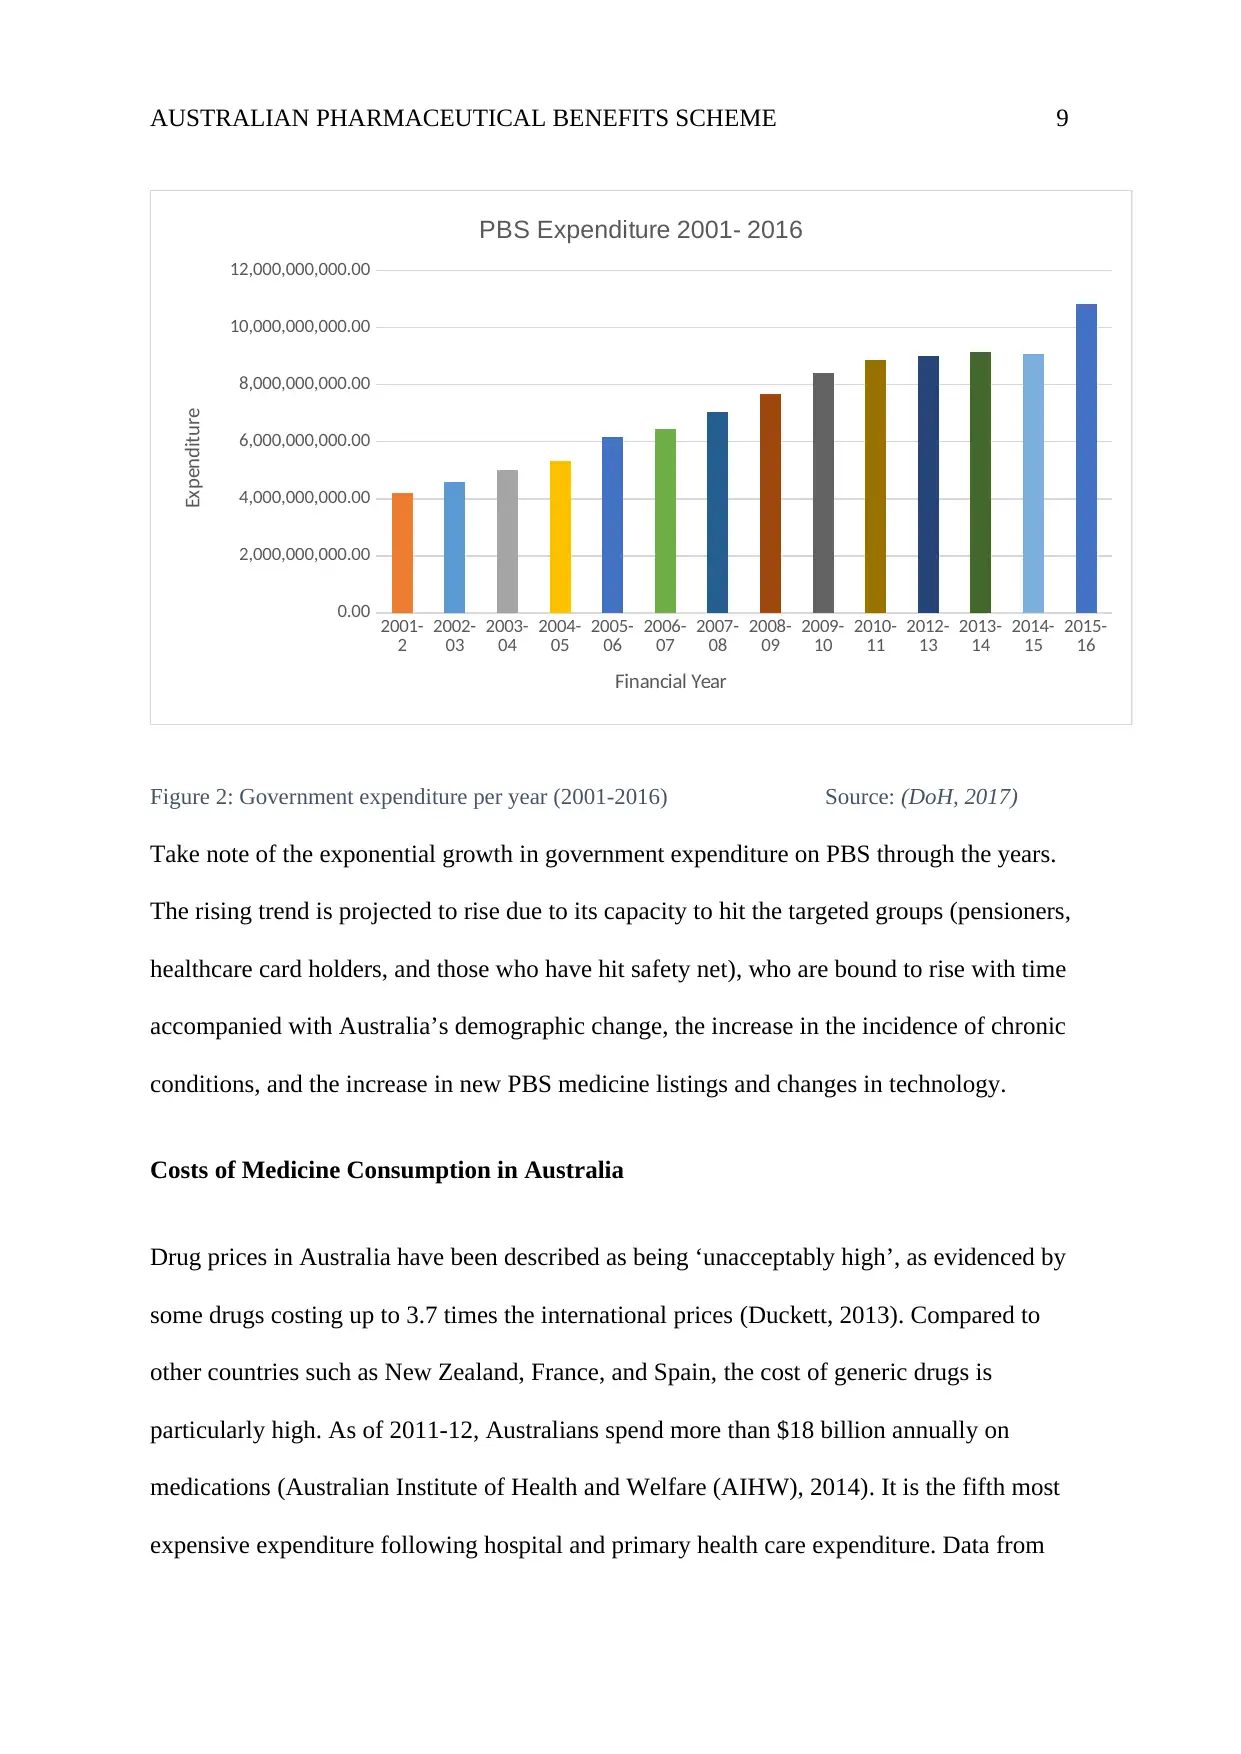
Figure 2: Government expenditure per year (2001-2016) Source: (DoH, 2017)
Take note of the exponential growth in government expenditure on PBS through the years.
The rising trend is projected to rise due to its capacity to hit the targeted groups (pensioners,
healthcare card holders, and those who have hit safety net), who are bound to rise with time
accompanied with Australia’s demographic change, the increase in the incidence of chronic
conditions, and the increase in new PBS medicine listings and changes in technology.
Costs of Medicine Consumption in Australia
Drug prices in Australia have been described as being ‘unacceptably high’, as evidenced by
some drugs costing up to 3.7 times the international prices (Duckett, 2013). Compared to
other countries such as New Zealand, France, and Spain, the cost of generic drugs is
particularly high. As of 2011-12, Australians spend more than $18 billion annually on
medications (Australian Institute of Health and Welfare (AIHW), 2014). It is the fifth most
expensive expenditure following hospital and primary health care expenditure. Data from
2001-
2 2002-
03 2003-
04 2004-
05 2005-
06 2006-
07 2007-
08 2008-
09 2009-
10 2010-
11 2012-
13 2013-
14 2014-
15 2015-
16
0.00
2,000,000,000.00
4,000,000,000.00
6,000,000,000.00
8,000,000,000.00
10,000,000,000.00
12,000,000,000.00
PBS Expenditure 2001- 2016
Financial Year
Expenditure
Figure 2: Government expenditure per year (2001-2016) Source: (DoH, 2017)
Take note of the exponential growth in government expenditure on PBS through the years.
The rising trend is projected to rise due to its capacity to hit the targeted groups (pensioners,
healthcare card holders, and those who have hit safety net), who are bound to rise with time
accompanied with Australia’s demographic change, the increase in the incidence of chronic
conditions, and the increase in new PBS medicine listings and changes in technology.
Costs of Medicine Consumption in Australia
Drug prices in Australia have been described as being ‘unacceptably high’, as evidenced by
some drugs costing up to 3.7 times the international prices (Duckett, 2013). Compared to
other countries such as New Zealand, France, and Spain, the cost of generic drugs is
particularly high. As of 2011-12, Australians spend more than $18 billion annually on
medications (Australian Institute of Health and Welfare (AIHW), 2014). It is the fifth most
expensive expenditure following hospital and primary health care expenditure. Data from
⊘ This is a preview!⊘
Do you want full access?
Subscribe today to unlock all pages.
Trusted by 1+ million students worldwide
AUSTRALIAN PHARMACEUTICAL BENEFITS SCHEME 10
OECD shows that Australia pays more for pharmaceuticals compared to other countries
(O’Neill, Puig-Peiró, Mestre-Ferrandiz, & Sussex, 2012).some of the possible explanations to
this scenario is that while some countries strived to contain the growth in prices, Australia
must have missed out, especially after a 2005 study that concluded Australian prices were
substantially lower (Duckett, 2013). There is also the likelihood that there is a limited number
of suppliers and tightly regulated prices which can cause some companies maintaining the
prices that high. In addition, drug prices are not the only factor that contributes to high
pharmaceutical expenditures, rather other factors such as demographics, clinical choices and
also comes into play.
Types of Medicines Consumed
● Subsidised drugs (PBS/RPBS)
The five major classes in Australia include ACE inhibitors, calcium channel blockers, proton
pump inhibitors, statins, selective serotonin reuptake inhibitors (Statistica, 2015). ACE
inhibitors are the most, with 15 drug types and a total of 242 products. Atorvastatin is the
most commonly administered calcium channel blocker (table 3), accounting for over $300
million each year.
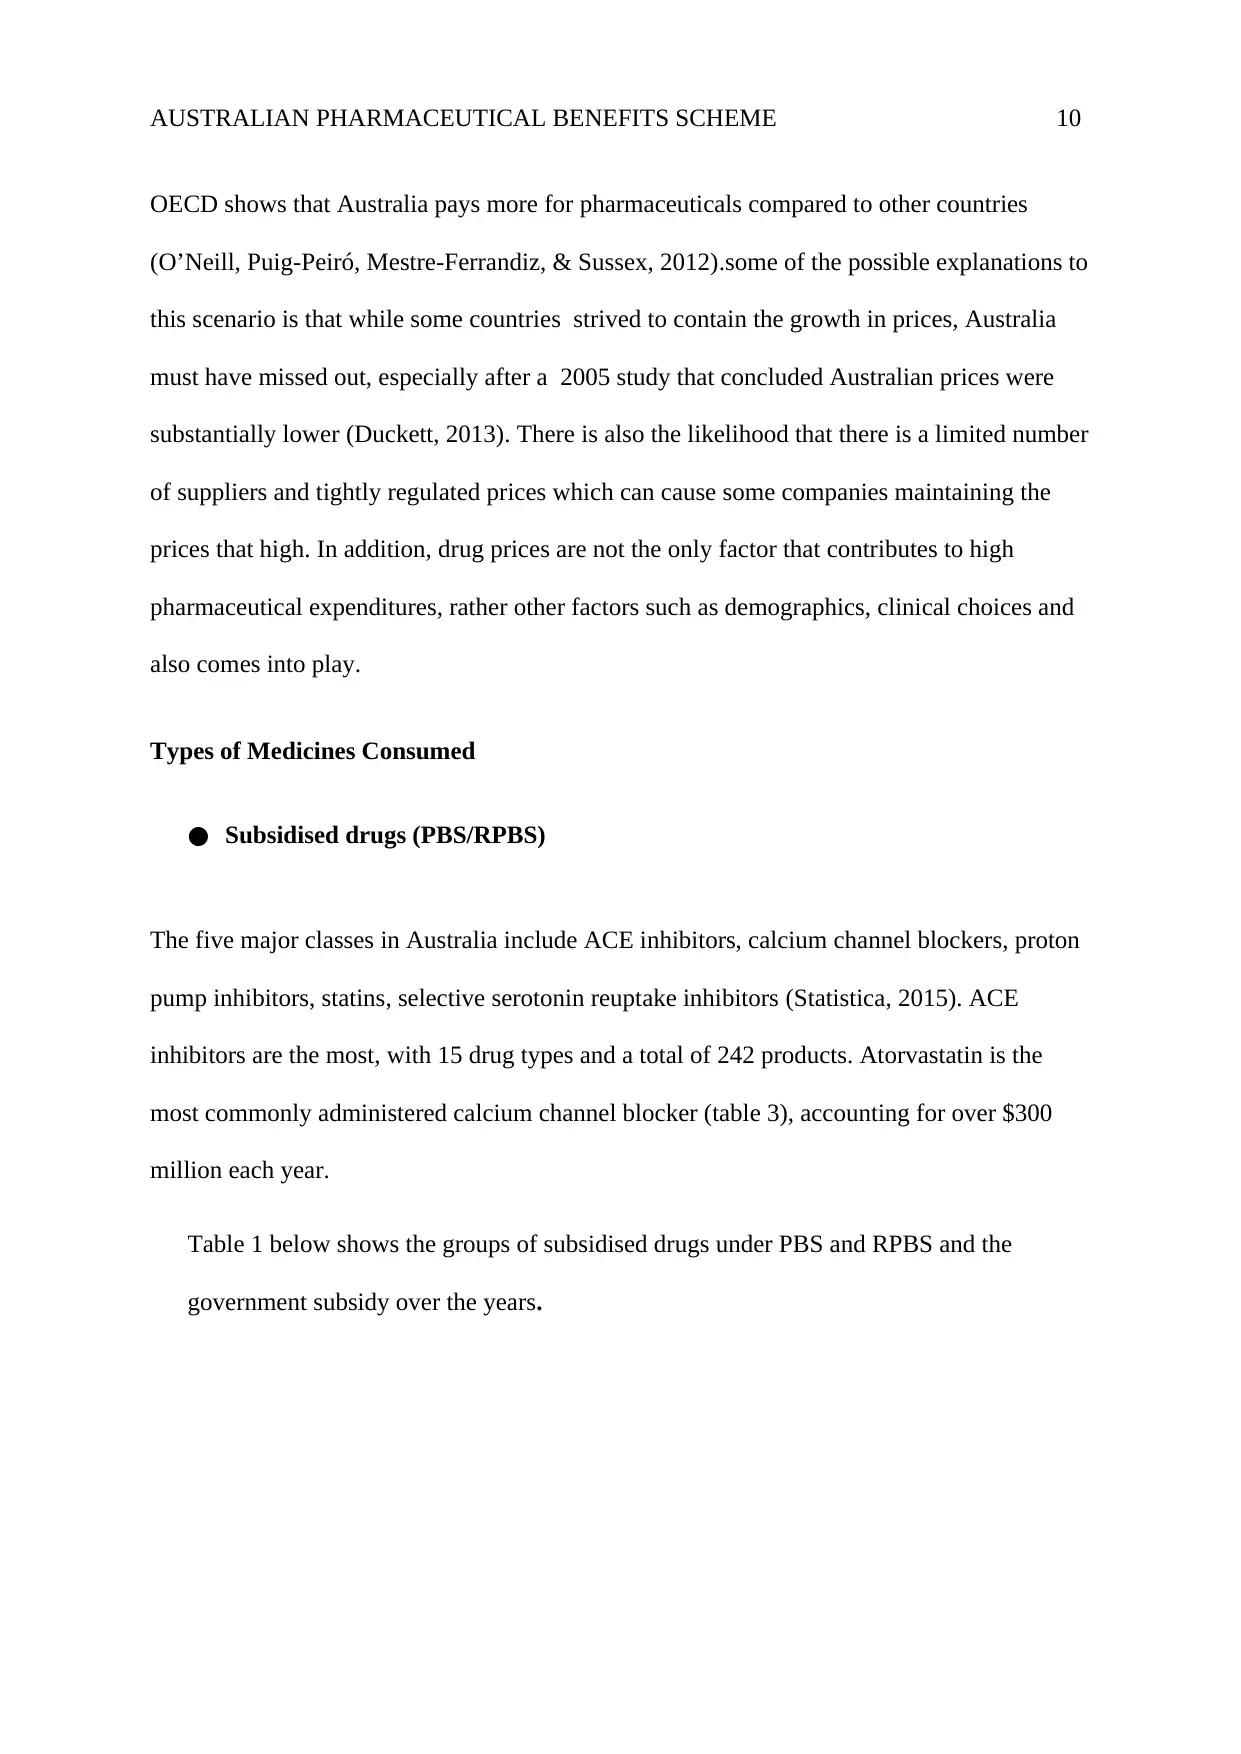
Table 1 below shows the groups of subsidised drugs under PBS and RPBS and the
government subsidy over the years.
OECD shows that Australia pays more for pharmaceuticals compared to other countries
(O’Neill, Puig-Peiró, Mestre-Ferrandiz, & Sussex, 2012).some of the possible explanations to
this scenario is that while some countries strived to contain the growth in prices, Australia
must have missed out, especially after a 2005 study that concluded Australian prices were
substantially lower (Duckett, 2013). There is also the likelihood that there is a limited number
of suppliers and tightly regulated prices which can cause some companies maintaining the
prices that high. In addition, drug prices are not the only factor that contributes to high
pharmaceutical expenditures, rather other factors such as demographics, clinical choices and
also comes into play.
Types of Medicines Consumed
● Subsidised drugs (PBS/RPBS)
The five major classes in Australia include ACE inhibitors, calcium channel blockers, proton
pump inhibitors, statins, selective serotonin reuptake inhibitors (Statistica, 2015). ACE
inhibitors are the most, with 15 drug types and a total of 242 products. Atorvastatin is the
most commonly administered calcium channel blocker (table 3), accounting for over $300
million each year.
Table 1 below shows the groups of subsidised drugs under PBS and RPBS and the
government subsidy over the years.
Paraphrase This Document
Need a fresh take? Get an instant paraphrase of this document with our AI Paraphraser
AUSTRALIAN PHARMACEUTICAL BENEFITS SCHEME 11
ATC Group 2013 2014 2015
(A) Alimentary Tract 31,263,367 31,645,647 31,767,987
(B) Blood and blood forming 9,234,564 9,546,756 10,657,784
(C) Cardiovascular system 71,646,657 70,876,657 69,897,768
(D) Dermatological 3,164,897 3,179,456 3,089,456
(G) Genitourinary system 3,421,345 3,545,768 3,705,768
(H) Hormonal Preparations 3,378,656 3,456,789 3,563,429
Source: (DoH, 2017)
Table 1: Subsidised drugs (PBS/RPBS)
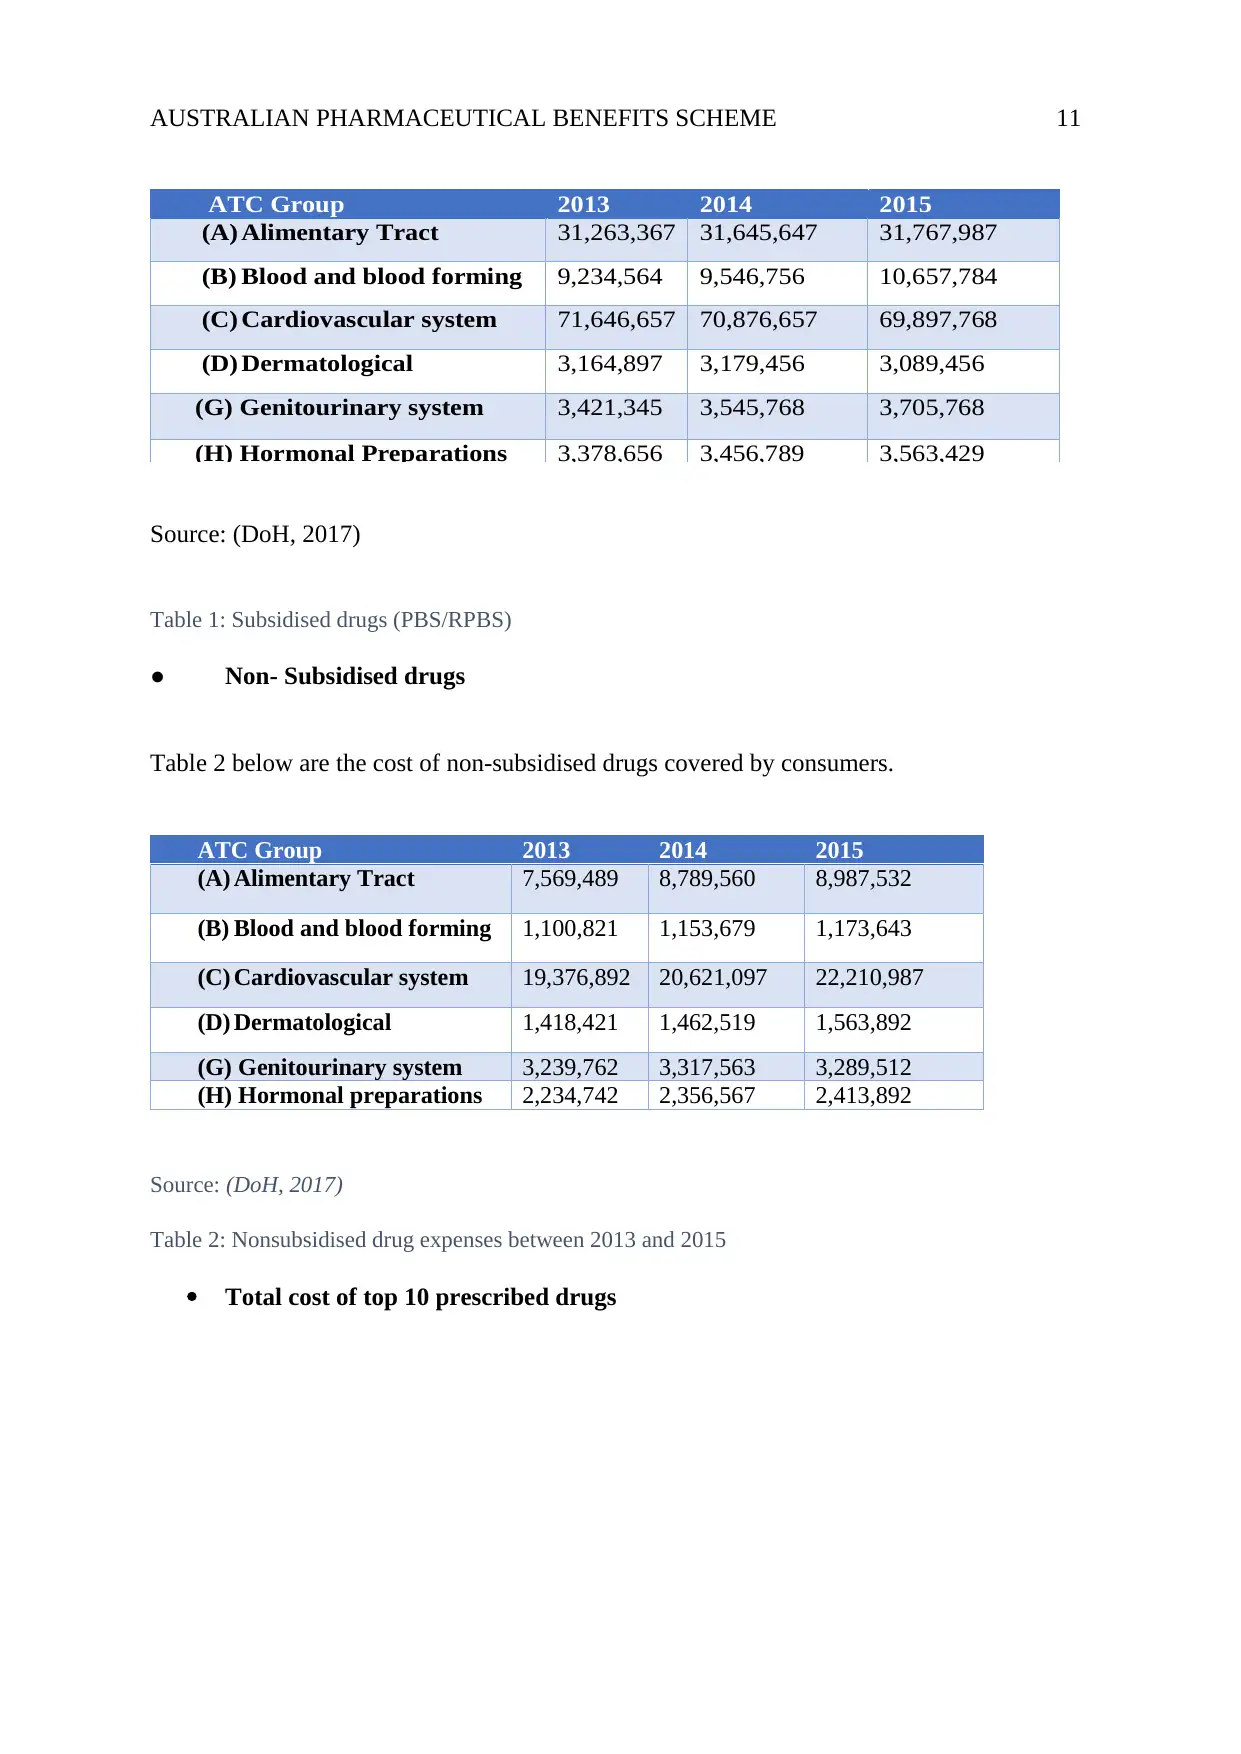
● Non- Subsidised drugs
Table 2 below are the cost of non-subsidised drugs covered by consumers.
ATC Group 2013 2014 2015
(A) Alimentary Tract 7,569,489 8,789,560 8,987,532
(B) Blood and blood forming 1,100,821 1,153,679 1,173,643
(C) Cardiovascular system 19,376,892 20,621,097 22,210,987
(D) Dermatological 1,418,421 1,462,519 1,563,892
(G) Genitourinary system 3,239,762 3,317,563 3,289,512
(H) Hormonal preparations 2,234,742 2,356,567 2,413,892
Source: (DoH, 2017)
Table 2: Nonsubsidised drug expenses between 2013 and 2015
Total cost of top 10 prescribed drugs
ATC Group 2013 2014 2015
(A) Alimentary Tract 31,263,367 31,645,647 31,767,987
(B) Blood and blood forming 9,234,564 9,546,756 10,657,784
(C) Cardiovascular system 71,646,657 70,876,657 69,897,768
(D) Dermatological 3,164,897 3,179,456 3,089,456
(G) Genitourinary system 3,421,345 3,545,768 3,705,768
(H) Hormonal Preparations 3,378,656 3,456,789 3,563,429
Source: (DoH, 2017)
Table 1: Subsidised drugs (PBS/RPBS)
● Non- Subsidised drugs
Table 2 below are the cost of non-subsidised drugs covered by consumers.
ATC Group 2013 2014 2015
(A) Alimentary Tract 7,569,489 8,789,560 8,987,532
(B) Blood and blood forming 1,100,821 1,153,679 1,173,643
(C) Cardiovascular system 19,376,892 20,621,097 22,210,987
(D) Dermatological 1,418,421 1,462,519 1,563,892
(G) Genitourinary system 3,239,762 3,317,563 3,289,512
(H) Hormonal preparations 2,234,742 2,356,567 2,413,892
Source: (DoH, 2017)
Table 2: Nonsubsidised drug expenses between 2013 and 2015
Total cost of top 10 prescribed drugs
AUSTRALIAN PHARMACEUTICAL BENEFITS SCHEME 12
Drug DDD/1000/Pop Scripts Total Cost
ATORVASTATIN 0.60 185,246 329,711,021
ROSUVASTATIN 24.85 7,184,175 229,567,718
ESOMEPRAZOLE 12.65 137,201 213,608,450
PARACETAMOL 25.20 132,792 208,351,224
PANTOPRAZOLE 21.25 3,081,584 204,998,295
PERINDOPRIL 7.60 6,667,654 202,920,536
AMOXYCILLIN 6.50 95,800 168,593,840
CEFALEXIN 30.15 2,958,702 161,937,157
METFORMIN
HYDROCHLORIDE
5.50 359,843 150,832,113
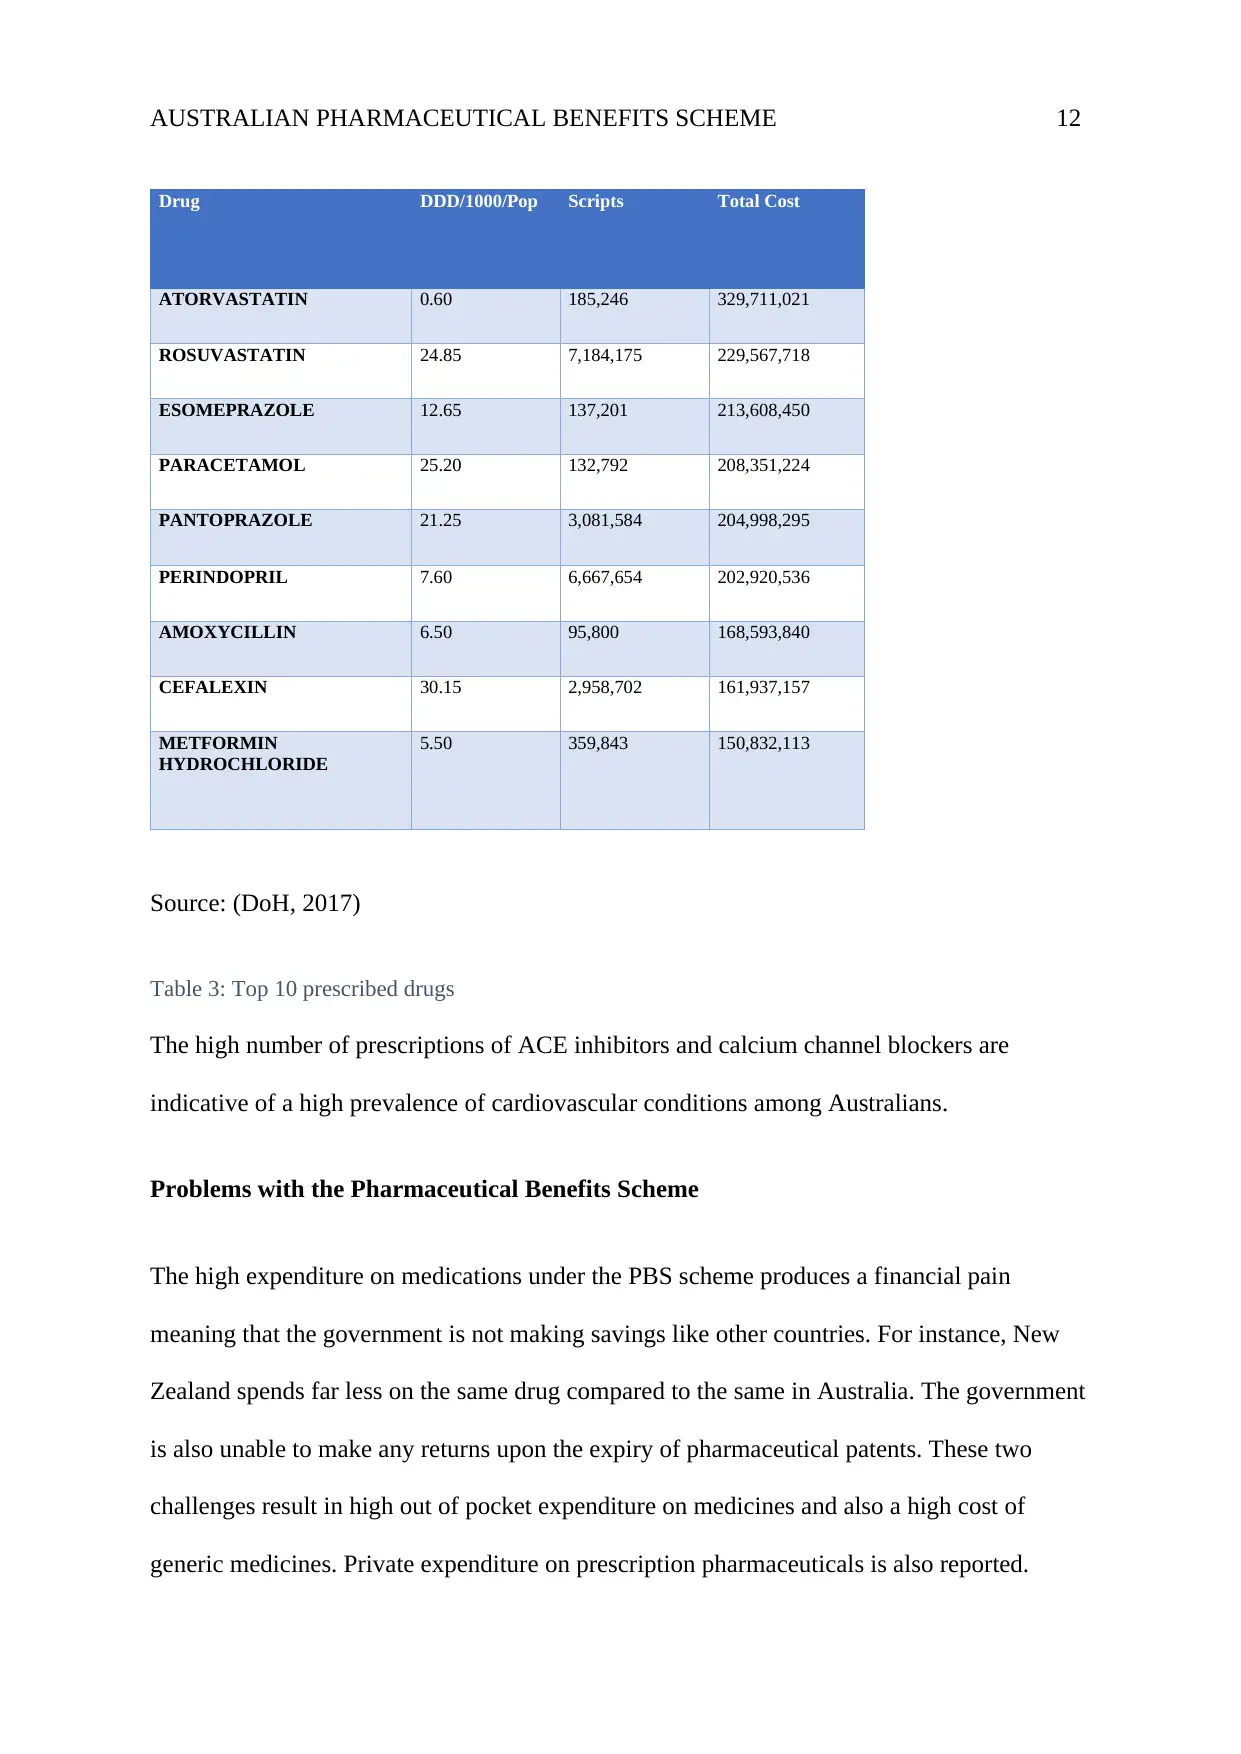
Source: (DoH, 2017)
Table 3: Top 10 prescribed drugs
The high number of prescriptions of ACE inhibitors and calcium channel blockers are
indicative of a high prevalence of cardiovascular conditions among Australians.
Problems with the Pharmaceutical Benefits Scheme
The high expenditure on medications under the PBS scheme produces a financial pain
meaning that the government is not making savings like other countries. For instance, New
Zealand spends far less on the same drug compared to the same in Australia. The government
is also unable to make any returns upon the expiry of pharmaceutical patents. These two
challenges result in high out of pocket expenditure on medicines and also a high cost of
generic medicines. Private expenditure on prescription pharmaceuticals is also reported.
Drug DDD/1000/Pop Scripts Total Cost
ATORVASTATIN 0.60 185,246 329,711,021
ROSUVASTATIN 24.85 7,184,175 229,567,718
ESOMEPRAZOLE 12.65 137,201 213,608,450
PARACETAMOL 25.20 132,792 208,351,224
PANTOPRAZOLE 21.25 3,081,584 204,998,295
PERINDOPRIL 7.60 6,667,654 202,920,536
AMOXYCILLIN 6.50 95,800 168,593,840
CEFALEXIN 30.15 2,958,702 161,937,157
METFORMIN
HYDROCHLORIDE
5.50 359,843 150,832,113
Source: (DoH, 2017)
Table 3: Top 10 prescribed drugs
The high number of prescriptions of ACE inhibitors and calcium channel blockers are
indicative of a high prevalence of cardiovascular conditions among Australians.
Problems with the Pharmaceutical Benefits Scheme
The high expenditure on medications under the PBS scheme produces a financial pain
meaning that the government is not making savings like other countries. For instance, New
Zealand spends far less on the same drug compared to the same in Australia. The government
is also unable to make any returns upon the expiry of pharmaceutical patents. These two
challenges result in high out of pocket expenditure on medicines and also a high cost of
generic medicines. Private expenditure on prescription pharmaceuticals is also reported.
⊘ This is a preview!⊘
Do you want full access?
Subscribe today to unlock all pages.
Trusted by 1+ million students worldwide
1 out of 18
Related Documents


Your All-in-One AI-Powered Toolkit for Academic Success.
+13062052269
info@desklib.com
Available 24*7 on WhatsApp / Email
![[object Object]](/_next/static/media/star-bottom.7253800d.svg)
Unlock your academic potential
Copyright © 2020–2026 A2Z Services. All Rights Reserved. Developed and managed by ZUCOL.