Data Mining Assignment II: Analysis of PCA and Naive Bayes Classifier
VerifiedAdded on 2019/10/31
|7
|957
|208
Homework Assignment
AI Summary
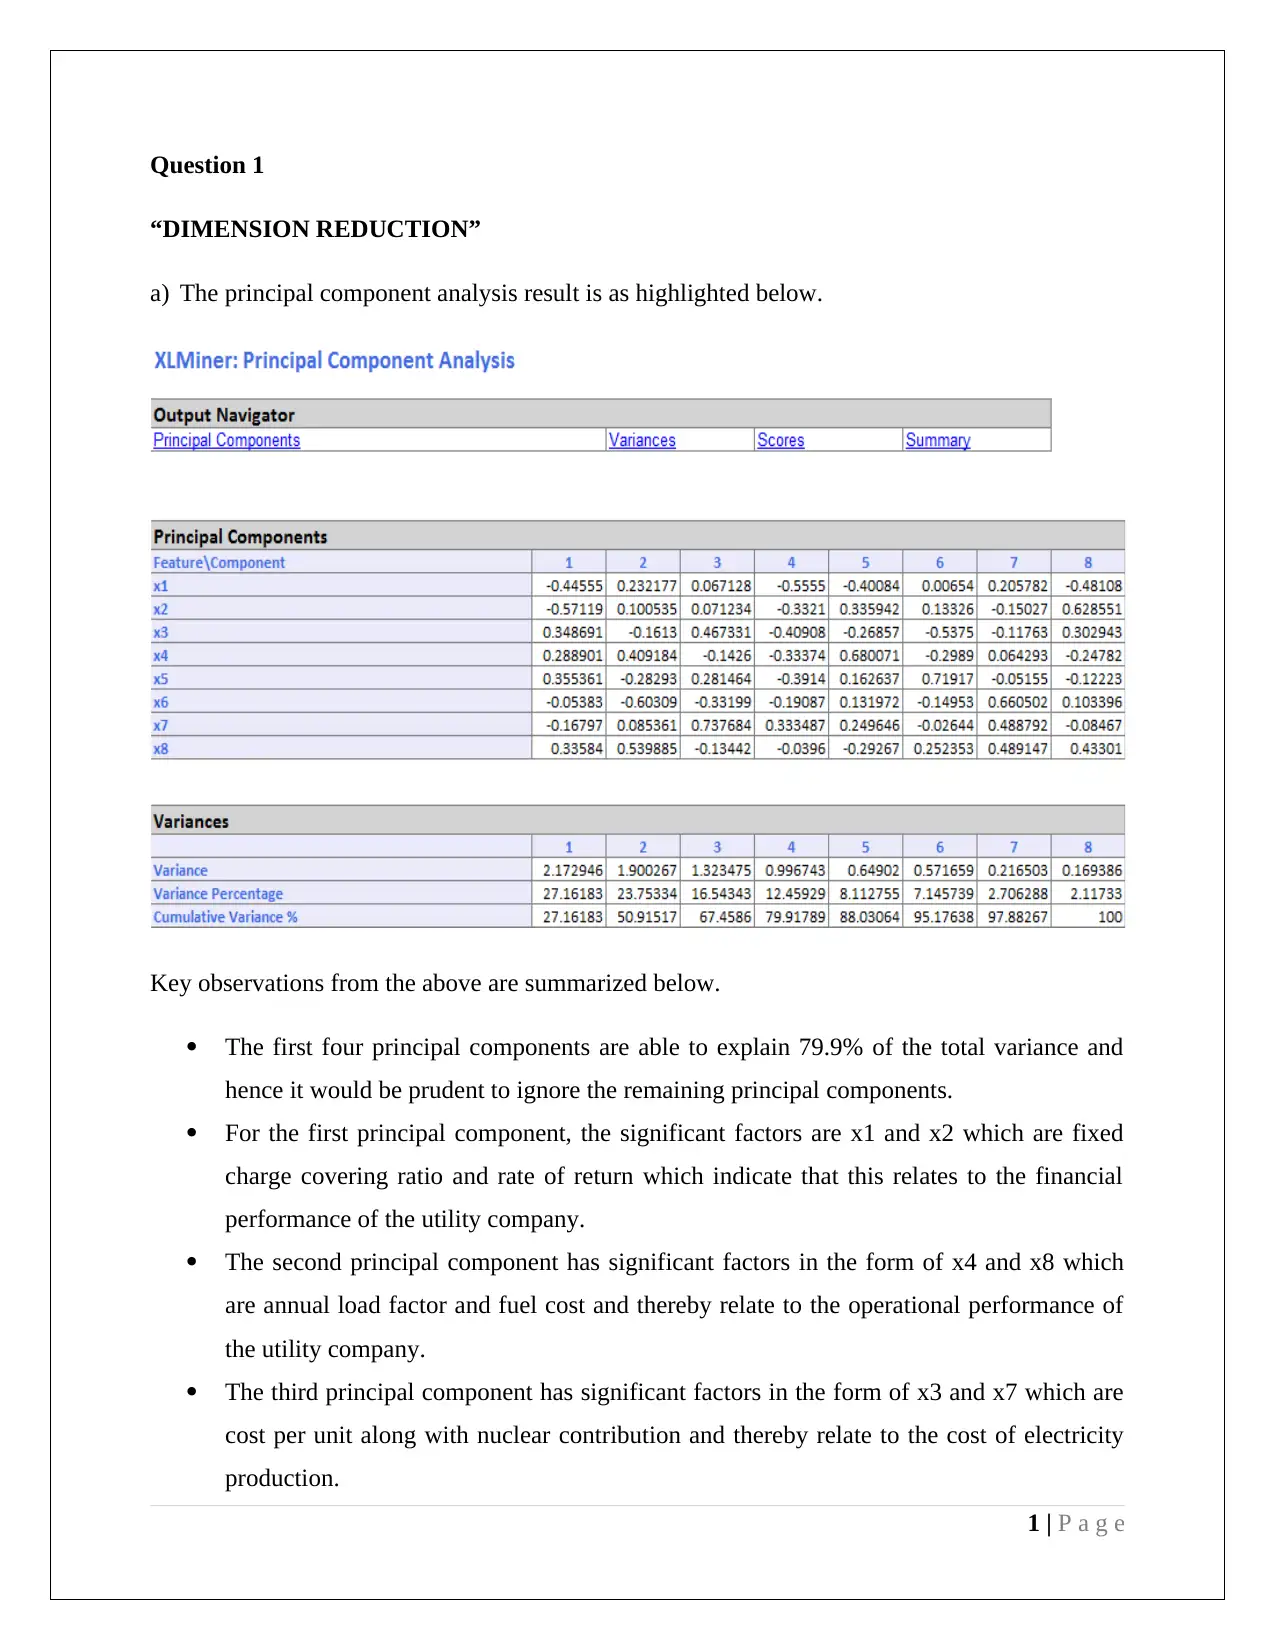
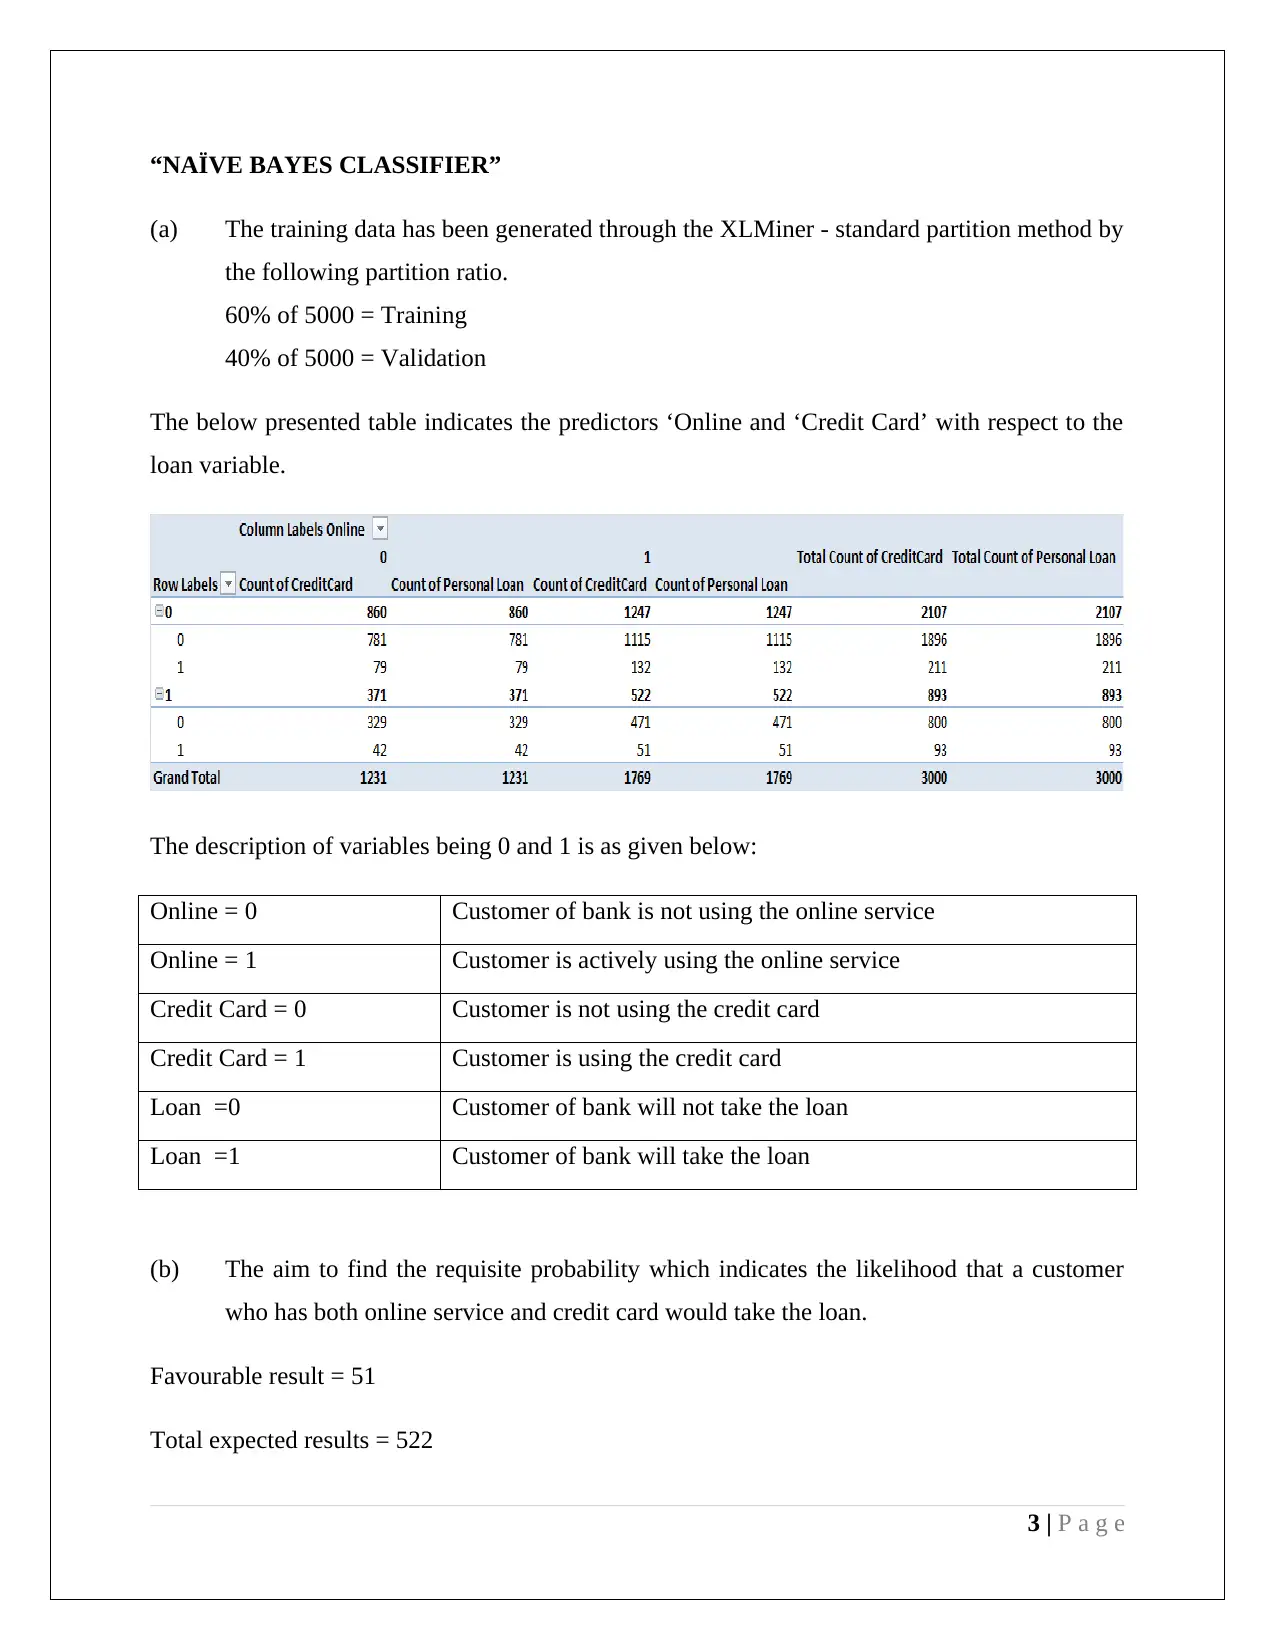
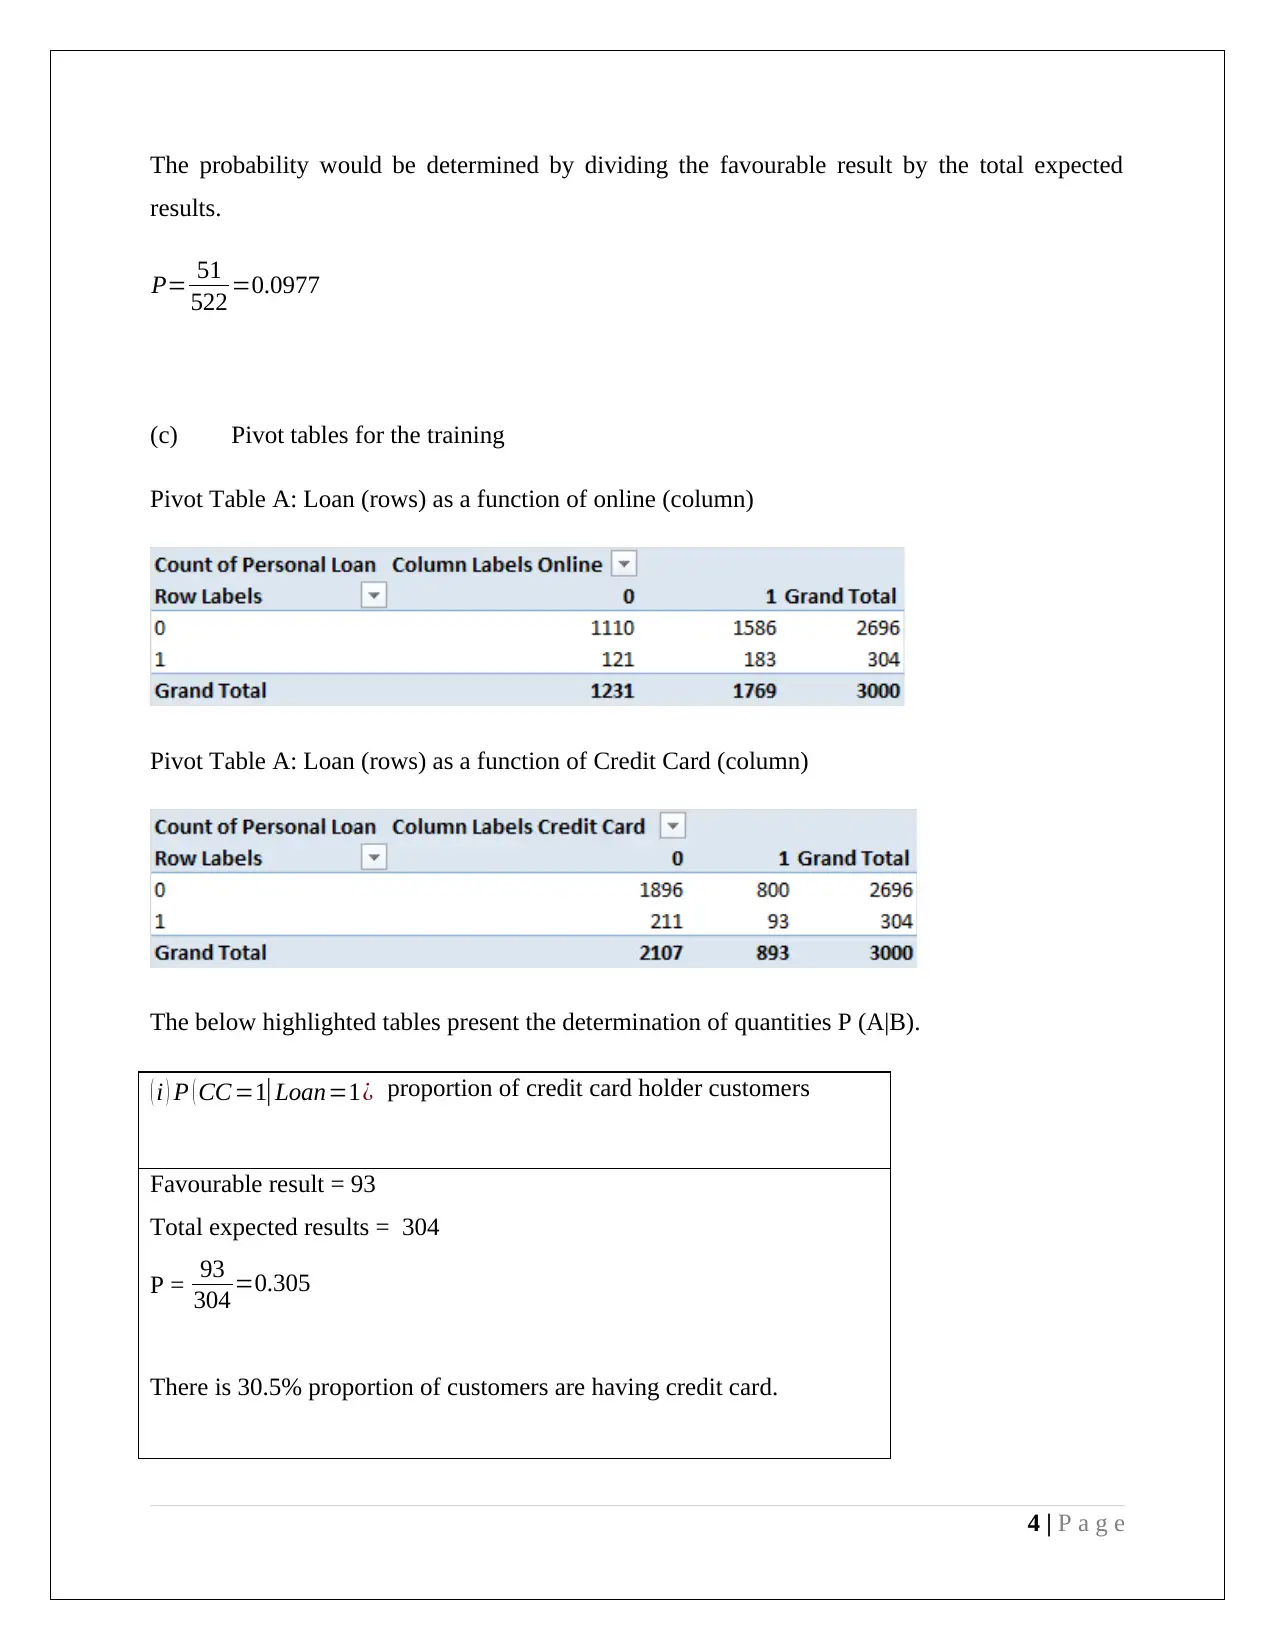
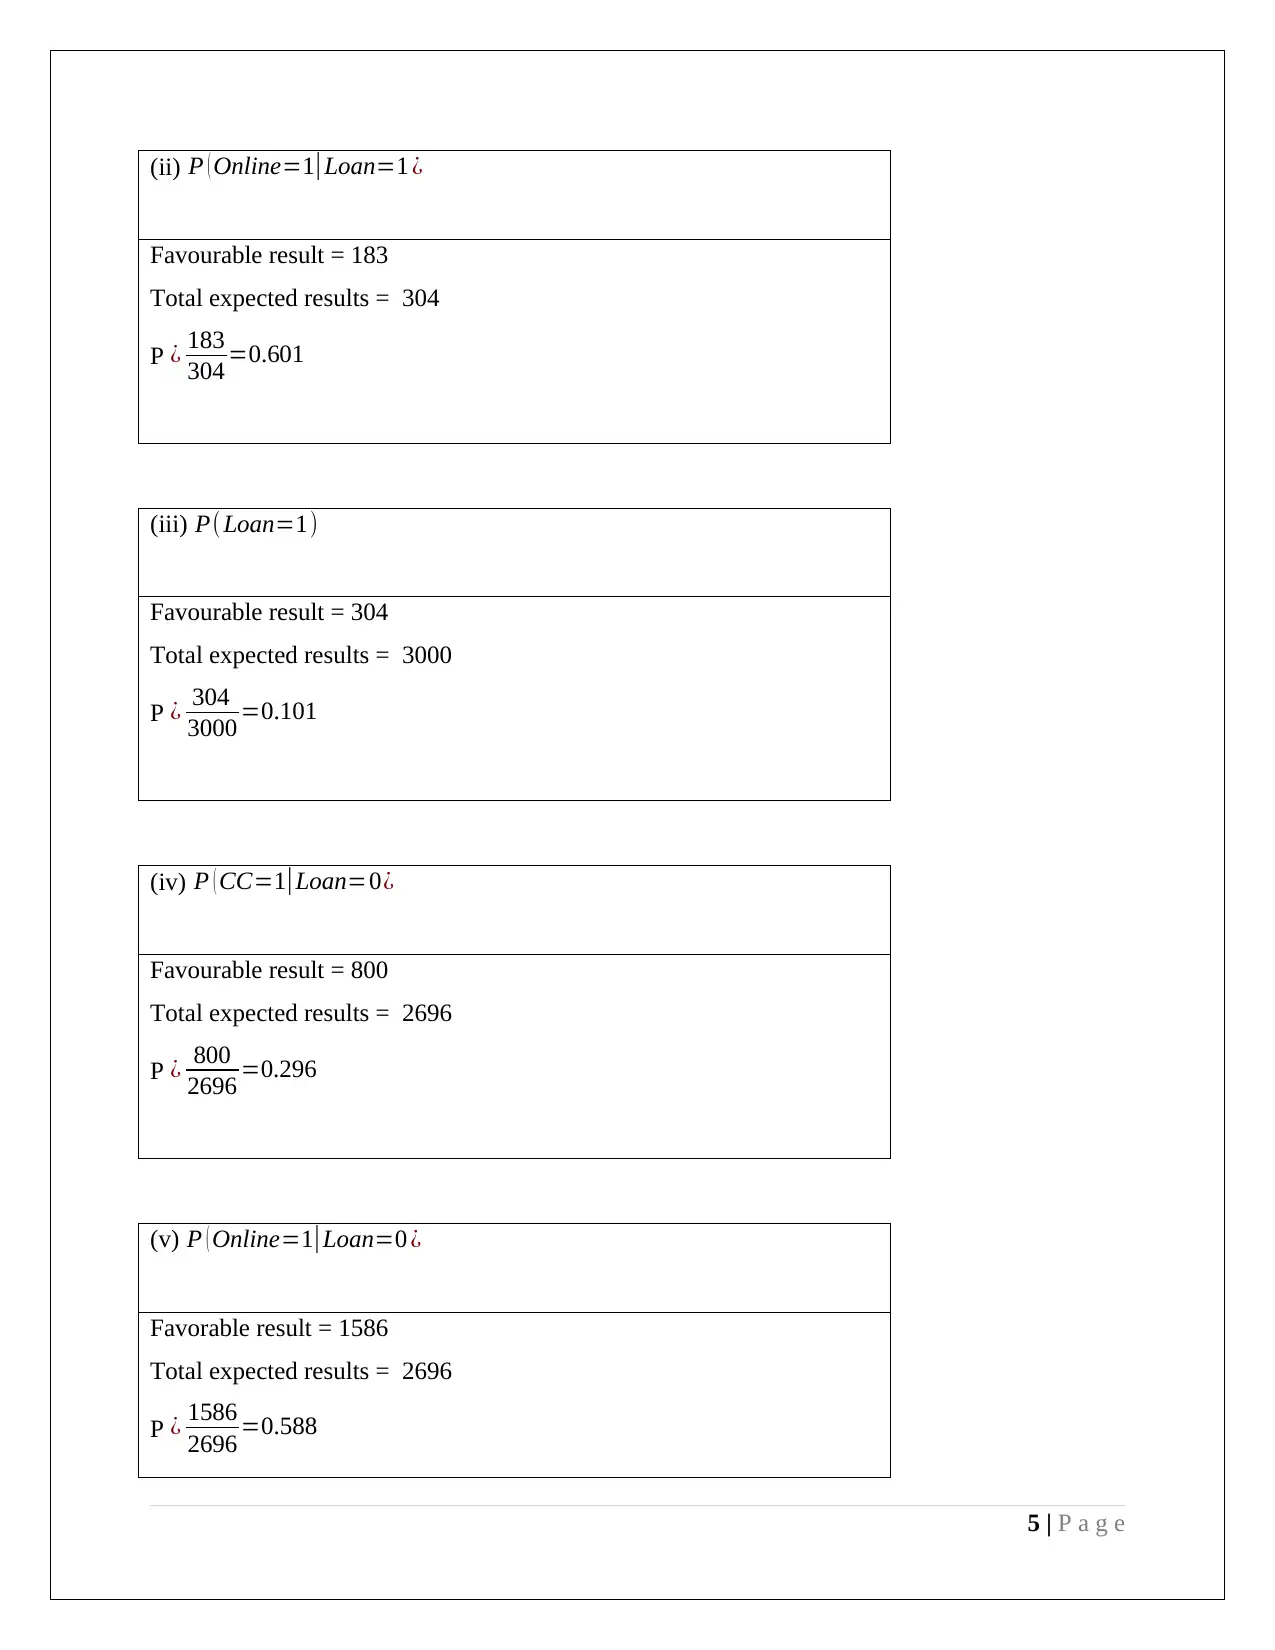
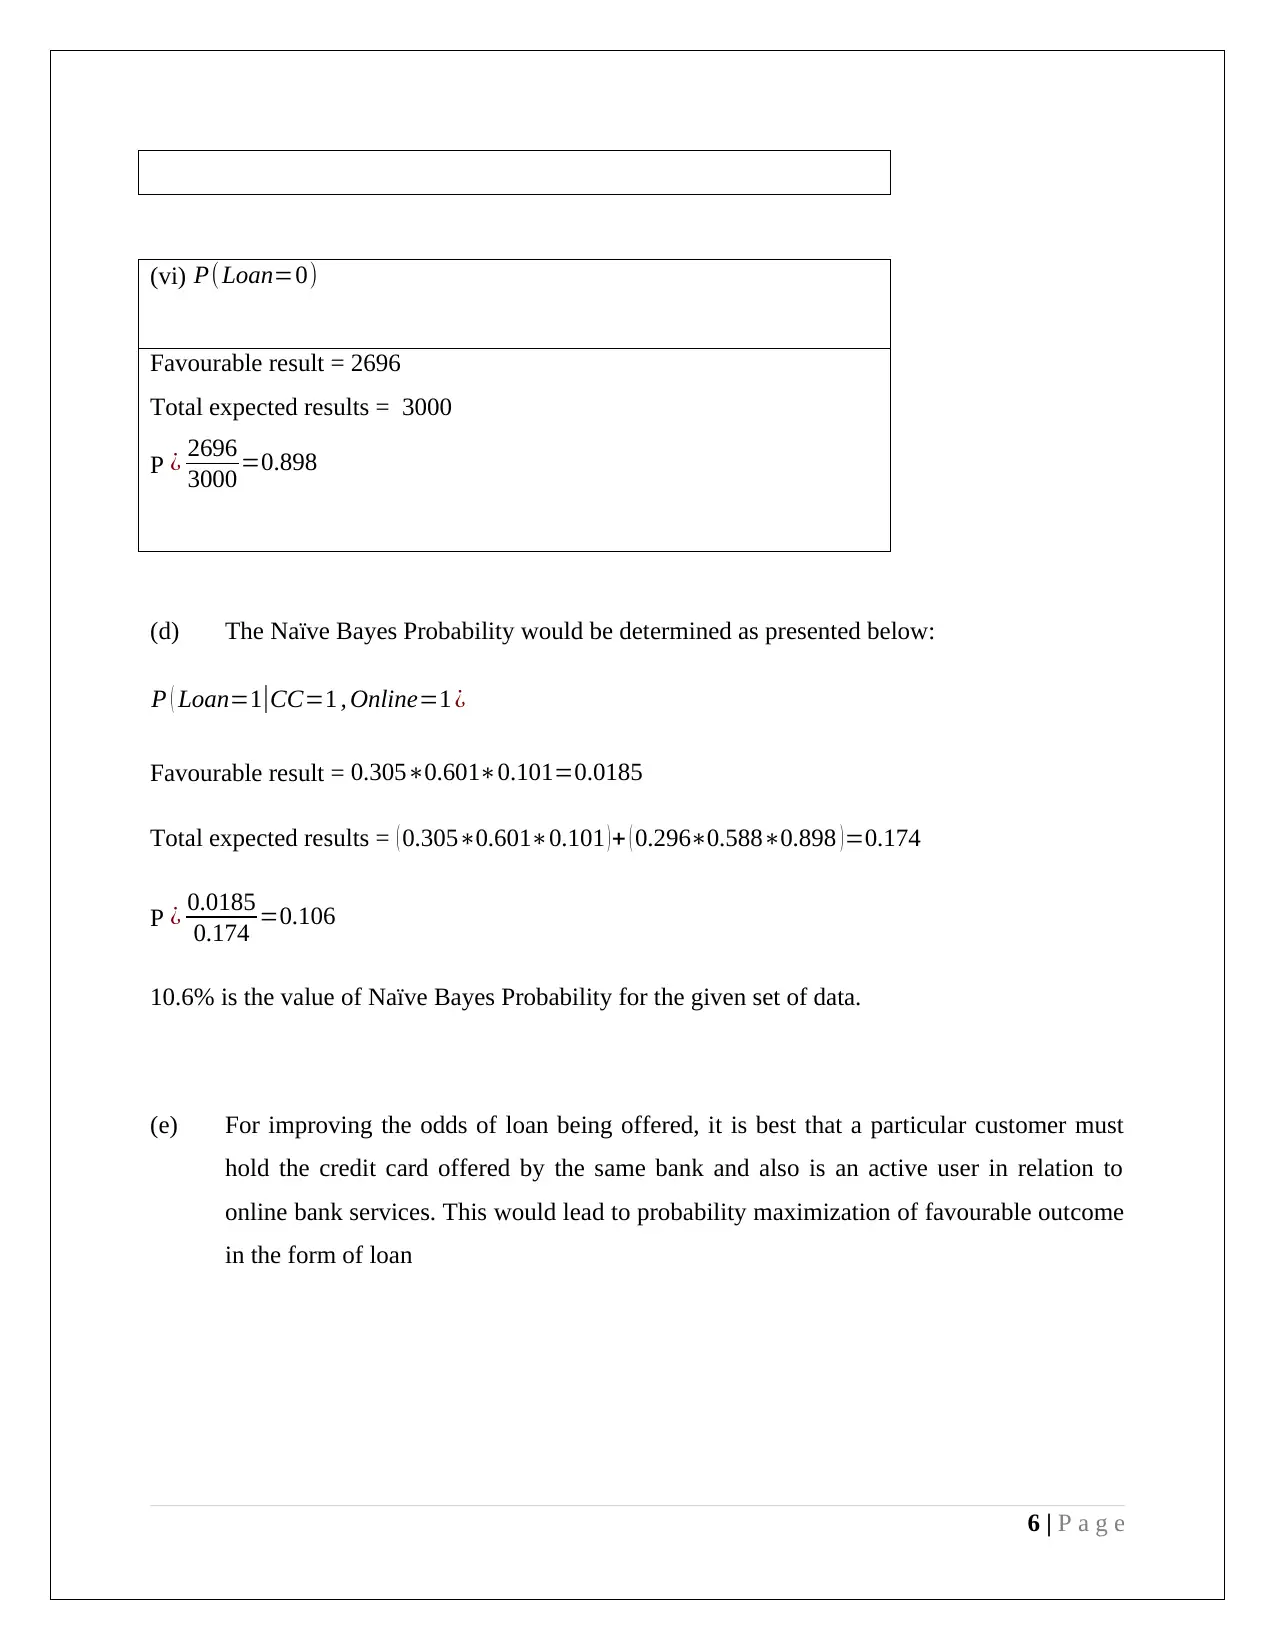
This assignment solution addresses two key concepts in data mining: dimension reduction using Principal Component Analysis (PCA) and classification using the Naive Bayes classifier. The PCA section analyzes the results of a PCA performed on utility company data, identifying significant factors for the first four principal components and discussing the need for data normalization. The Naive Bayes section focuses on predicting loan eligibility based on customer online service usage and credit card ownership, utilizing pivot tables to calculate probabilities and determine the likelihood of a customer taking a loan. The solution provides detailed calculations, interpretations, and recommendations for improving loan offering odds, emphasizing the importance of both online banking and credit card usage.

DATA MINING
Assignment – II
Student id
[Pick the date]
Assignment – II
Student id
[Pick the date]
Paraphrase This Document
Need a fresh take? Get an instant paraphrase of this document with our AI Paraphraser

Question 1
“DIMENSION REDUCTION”
a) The principal component analysis result is as highlighted below.
Key observations from the above are summarized below.
The first four principal components are able to explain 79.9% of the total variance and
hence it would be prudent to ignore the remaining principal components.
For the first principal component, the significant factors are x1 and x2 which are fixed
charge covering ratio and rate of return which indicate that this relates to the financial
performance of the utility company.
The second principal component has significant factors in the form of x4 and x8 which
are annual load factor and fuel cost and thereby relate to the operational performance of
the utility company.
The third principal component has significant factors in the form of x3 and x7 which are
cost per unit along with nuclear contribution and thereby relate to the cost of electricity
production.
1 | P a g e

The fourth principal component has significant factors in the form of x1 and x3 which are
fixed charge covering ratio and unit cost and hence related to the fixed cost structure of
the utility company production.
It also needs to be addressed as to whether the normalization of data must be done prior to PCA.
This becomes a necessity when a particular variable on account of difference in scales tends to
contribute to a significant proportion of the total variance thereby overshadowing the importance
of the other variables involves. Hence, normalization is done so as to remove the scale effect.
However, no such need arises in the given case, as the highest variance explained by a single
factor is only 27% and thus scale is not a pivotal factor for the PCA in this case.
(b) The list of advantages and disadvantages are highlighted below:
Advantages: PCA is considered to be a simple mode of true eigenvector multivariate system
based analysis. PCA techniques main features are to perform the central three tasks i.e.
dimension reduction, maximizing the variance and to show the principal component
orthogonally. PCA technique first maximizes the variances in p-dimensional space especially
under quadratic constraints. This result the reduction of large sized data set into smaller sized
data. The structure of the given parameter data can easily be evaluated based on PCA.
Visualization of the data is simple because each variable has its own axis which is distributed
into a high-dimensional cloud space.
Disadvantages: At times, it has been found that after the reduction of large sized variables into
fewer variables, the derived principal components would not align in the space especially in the
direction of where the variance has maximum value. Hence, it seems difficult to find the
direction of key principal components. Also, the distance function in case of PCA analysis is
invalid. Further, this method does not employ on the data set which comprises categorical
variables. Also, analysis of non-linear relation between variables is not successful.
Question 2
2 | P a g e
⊘ This is a preview!⊘
Do you want full access?
Subscribe today to unlock all pages.

Trusted by 1+ million students worldwide

“NAÏVE BAYES CLASSIFIER”
(a) The training data has been generated through the XLMiner - standard partition method by
the following partition ratio.
60% of 5000 = Training
40% of 5000 = Validation
The below presented table indicates the predictors ‘Online and ‘Credit Card’ with respect to the
loan variable.
The description of variables being 0 and 1 is as given below:
Online = 0 Customer of bank is not using the online service
Online = 1 Customer is actively using the online service
Credit Card = 0 Customer is not using the credit card
Credit Card = 1 Customer is using the credit card
Loan =0 Customer of bank will not take the loan
Loan =1 Customer of bank will take the loan
(b) The aim to find the requisite probability which indicates the likelihood that a customer
who has both online service and credit card would take the loan.
Favourable result = 51
Total expected results = 522
3 | P a g e
Paraphrase This Document
Need a fresh take? Get an instant paraphrase of this document with our AI Paraphraser

The probability would be determined by dividing the favourable result by the total expected
results.
P= 51
522 =0.0977
(c) Pivot tables for the training
Pivot Table A: Loan (rows) as a function of online (column)
Pivot Table A: Loan (rows) as a function of Credit Card (column)
The below highlighted tables present the determination of quantities P (A|B).
( i ) P ( CC =1|Loan=1¿ proportion of credit card holder customers
Favourable result = 93
Total expected results = 304
P = 93
304 =0.305
There is 30.5% proportion of customers are having credit card.
4 | P a g e

(ii) P ( Online=1|Loan=1 ¿
Favourable result = 183
Total expected results = 304
P ¿ 183
304 =0.601
(iii) P( Loan=1)
Favourable result = 304
Total expected results = 3000
P ¿ 304
3000 =0.101
(iv) P ( CC=1|Loan=0¿
Favourable result = 800
Total expected results = 2696
P ¿ 800
2696 =0.296
(v) P ( Online=1|Loan=0 ¿
Favorable result = 1586
Total expected results = 2696
P ¿ 1586
2696 =0.588
5 | P a g e
⊘ This is a preview!⊘
Do you want full access?
Subscribe today to unlock all pages.

Trusted by 1+ million students worldwide

(vi) P(Loan=0)
Favourable result = 2696
Total expected results = 3000
P ¿ 2696
3000 =0.898
(d) The Naïve Bayes Probability would be determined as presented below:
P ( Loan=1|CC=1 , Online=1 ¿
Favourable result = 0.305∗0.601∗0.101=0.0185
Total expected results = ( 0.305∗0.601∗0.101 )+ ( 0.296∗0.588∗0.898 )=0.174
P ¿ 0.0185
0.174 =0.106
10.6% is the value of Naïve Bayes Probability for the given set of data.
(e) For improving the odds of loan being offered, it is best that a particular customer must
hold the credit card offered by the same bank and also is an active user in relation to
online bank services. This would lead to probability maximization of favourable outcome
in the form of loan
6 | P a g e
1 out of 7
Related Documents
Your All-in-One AI-Powered Toolkit for Academic Success.
+13062052269
info@desklib.com
Available 24*7 on WhatsApp / Email
Unlock your academic potential
Copyright © 2020–2026 A2Z Services. All Rights Reserved. Developed and managed by ZUCOL.


