Pearson PLC Financial Analysis: Ratio Analysis and Capital Budgeting
VerifiedAdded on 2023/06/15
|9
|2692
|188
Report
AI Summary
This report provides a financial analysis of Pearson PLC, encompassing ratio analysis and capital budgeting evaluations. The ratio analysis examines Pearson's profitability, liquidity, efficiency, and financial structure over four years, revealing a significant downturn in 2016 due to challenges in the US higher education sector. The capital budgeting analysis assesses two investment proposals—a Bunnings warehouse and a Coles supermarket—using NPV, IRR, and payback period methods. The analysis concludes that the Bunnings project is the more favorable investment due to its positive NPV, higher IRR, and shorter payback period. Overall, the report suggests that Pearson's financial performance in 2016 was weak, and recommends investing in the Bunnings project for better returns. Desklib provides various study tools and solved assignments for students.
Running Head: ACCOUNTING LEARNING
Accounting
Accounting
Paraphrase This Document
Need a fresh take? Get an instant paraphrase of this document with our AI Paraphraser

ACCOUNTING LEARNING 2
Contents
Introduction...........................................................................................................................................3
About Pearson PLC...............................................................................................................................3
Ratio Analysis.......................................................................................................................................3
Capital budgeting analysis.....................................................................................................................7
Conclusion.............................................................................................................................................8
References.............................................................................................................................................9
ACCOUNTING LEARNING 3
Introduction
This report contains a financial analysis of the financial statements of Pearson PLC. Various
ratios are calculated in the first part of the report which reflects about the company’s
profitability liquidity and efficiency and also it financial condition in the market. A brief
overview about the company is also provided in the report. The second part of the report
contains an evaluation of the two investment proposals, on which the company is looking on
for making investment. Capital budgeting techniques like NPV, IRR and payback period is
used for the purpose of evaluation. The report ends with a conclusion containing the findings
of the analysis.
About Pearson PLC
It is a British owned company and world’s leading corporation engaged in providing
digitalize teaching and learning services. The company has expertise in educational
assessment. It offers its services to the schools, corporations and also directly to the students.
The media brands owned by the company are Peachpit, Longman, Addison-Wesley and many
others. The company was founded in year 1844 by Samuel Pearson. It has its headquarters in
London and is known as the largest book publisher and education company all over the
world. The company is listed on London Stock Exchange with a ticker LSE: PSON and is a
part of FTSE 100 index.
The mission and vision of the company is to increase the quality of life of people through
learning because it believes on the fact that, learning provides and open up many career
opportunities and make people’s life better. It provides products like published newspapers,
books, magazines and services like higher education, school management and assessment
related to education.
Ratio Analysis
The technique which is most commonly used in the analysis of financial statements of a
company is known as ratio analysis (Zainudin, Zainudin, Hashim & Hashim, 2016). Various
types of ratios are calculated with the help of financial data available in the annual reports, to
measure the liquidity, profitability, efficiency and capital structure of the company. Ratio
analysis reflects the trend going in the company regarding its profits, earning and various
other factors (Vogel, 2014).
⊘ This is a preview!⊘
Do you want full access?
Subscribe today to unlock all pages.
Trusted by 1+ million students worldwide
ACCOUNTING LEARNING 4
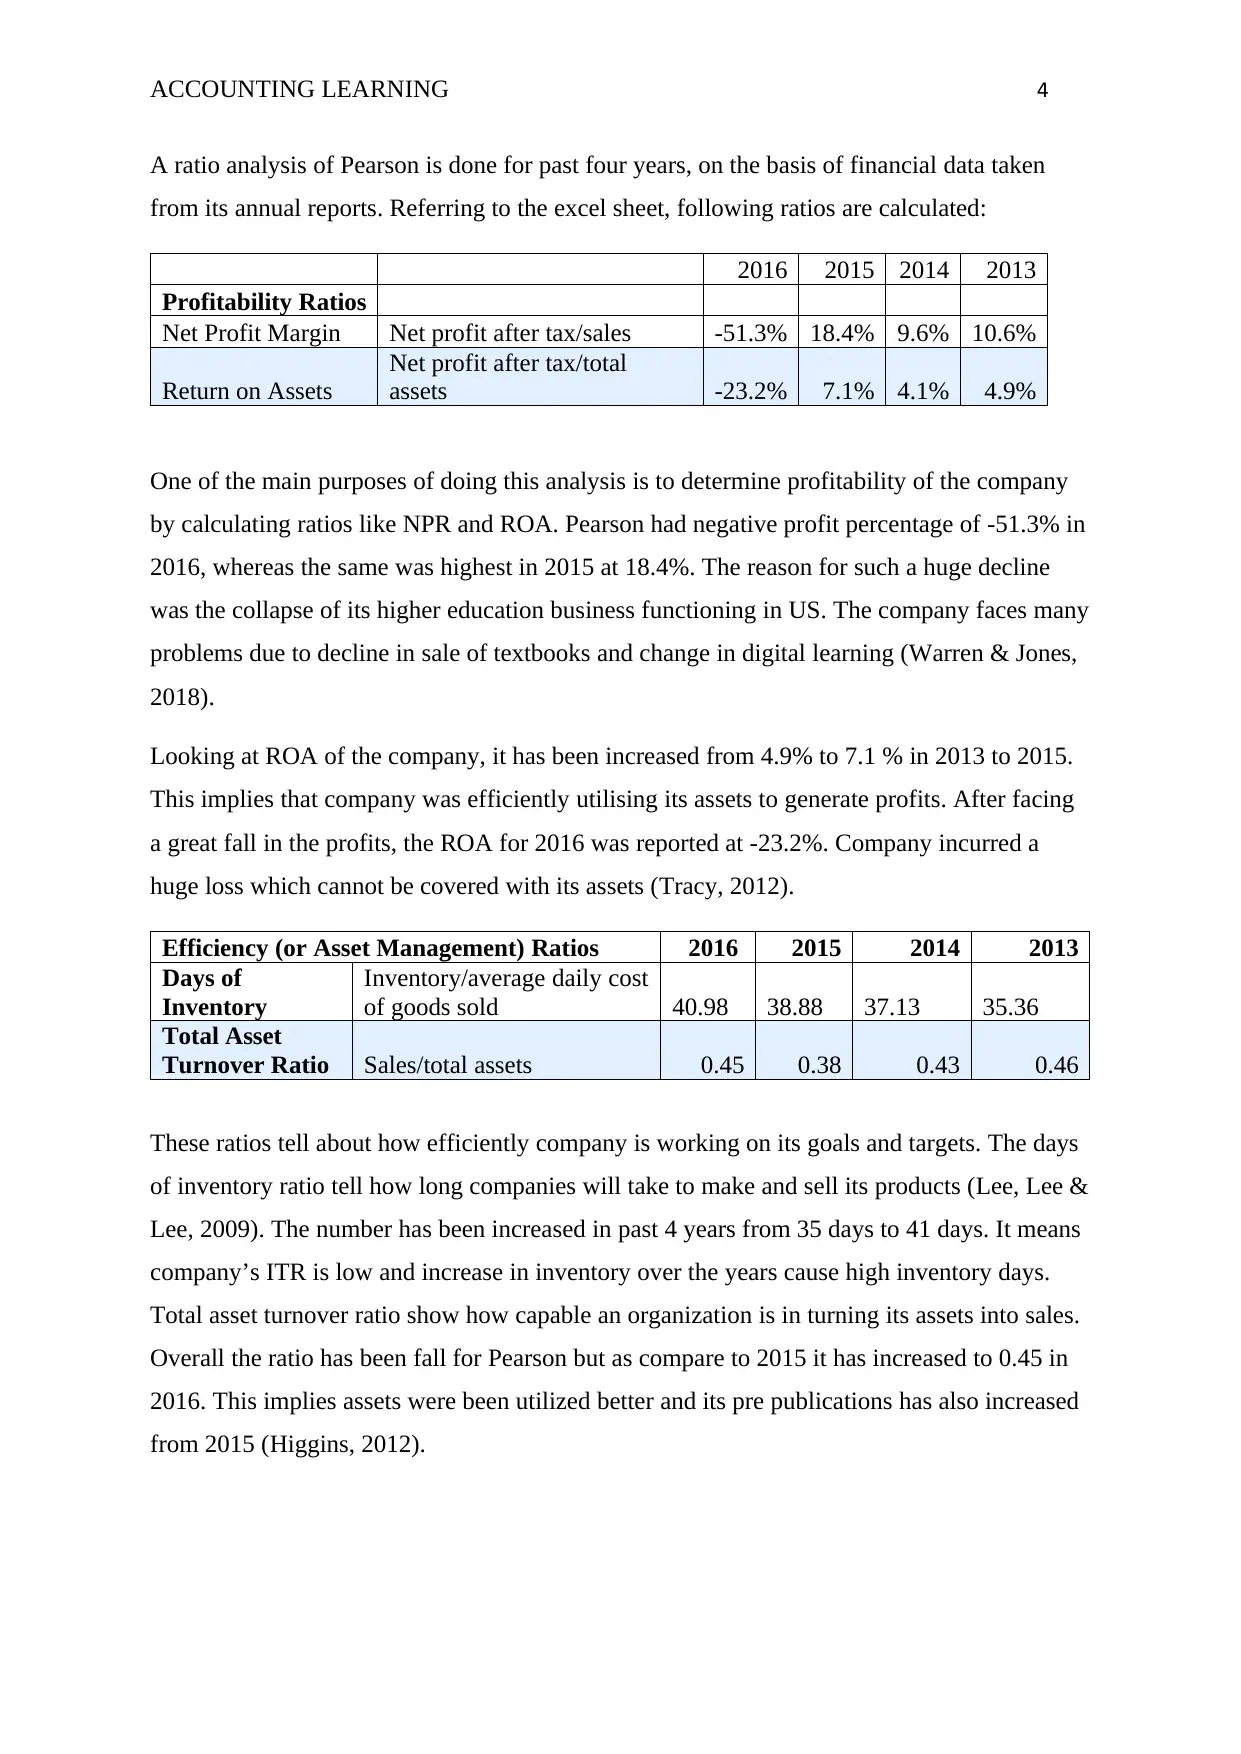
A ratio analysis of Pearson is done for past four years, on the basis of financial data taken
from its annual reports. Referring to the excel sheet, following ratios are calculated:
2016 2015 2014 2013
Profitability Ratios
Net Profit Margin Net profit after tax/sales -51.3% 18.4% 9.6% 10.6%
Return on Assets
Net profit after tax/total
assets -23.2% 7.1% 4.1% 4.9%
One of the main purposes of doing this analysis is to determine profitability of the company
by calculating ratios like NPR and ROA. Pearson had negative profit percentage of -51.3% in
2016, whereas the same was highest in 2015 at 18.4%. The reason for such a huge decline
was the collapse of its higher education business functioning in US. The company faces many
problems due to decline in sale of textbooks and change in digital learning (Warren & Jones,
2018).
Looking at ROA of the company, it has been increased from 4.9% to 7.1 % in 2013 to 2015.
This implies that company was efficiently utilising its assets to generate profits. After facing
a great fall in the profits, the ROA for 2016 was reported at -23.2%. Company incurred a
huge loss which cannot be covered with its assets (Tracy, 2012).
Efficiency (or Asset Management) Ratios 2016 2015 2014 2013
Days of
Inventory
Inventory/average daily cost
of goods sold 40.98 38.88 37.13 35.36
Total Asset
Turnover Ratio Sales/total assets 0.45 0.38 0.43 0.46
These ratios tell about how efficiently company is working on its goals and targets. The days
of inventory ratio tell how long companies will take to make and sell its products (Lee, Lee &
Lee, 2009). The number has been increased in past 4 years from 35 days to 41 days. It means
company’s ITR is low and increase in inventory over the years cause high inventory days.
Total asset turnover ratio show how capable an organization is in turning its assets into sales.
Overall the ratio has been fall for Pearson but as compare to 2015 it has increased to 0.45 in
2016. This implies assets were been utilized better and its pre publications has also increased
from 2015 (Higgins, 2012).
Paraphrase This Document
Need a fresh take? Get an instant paraphrase of this document with our AI Paraphraser
ACCOUNTING LEARNING 5
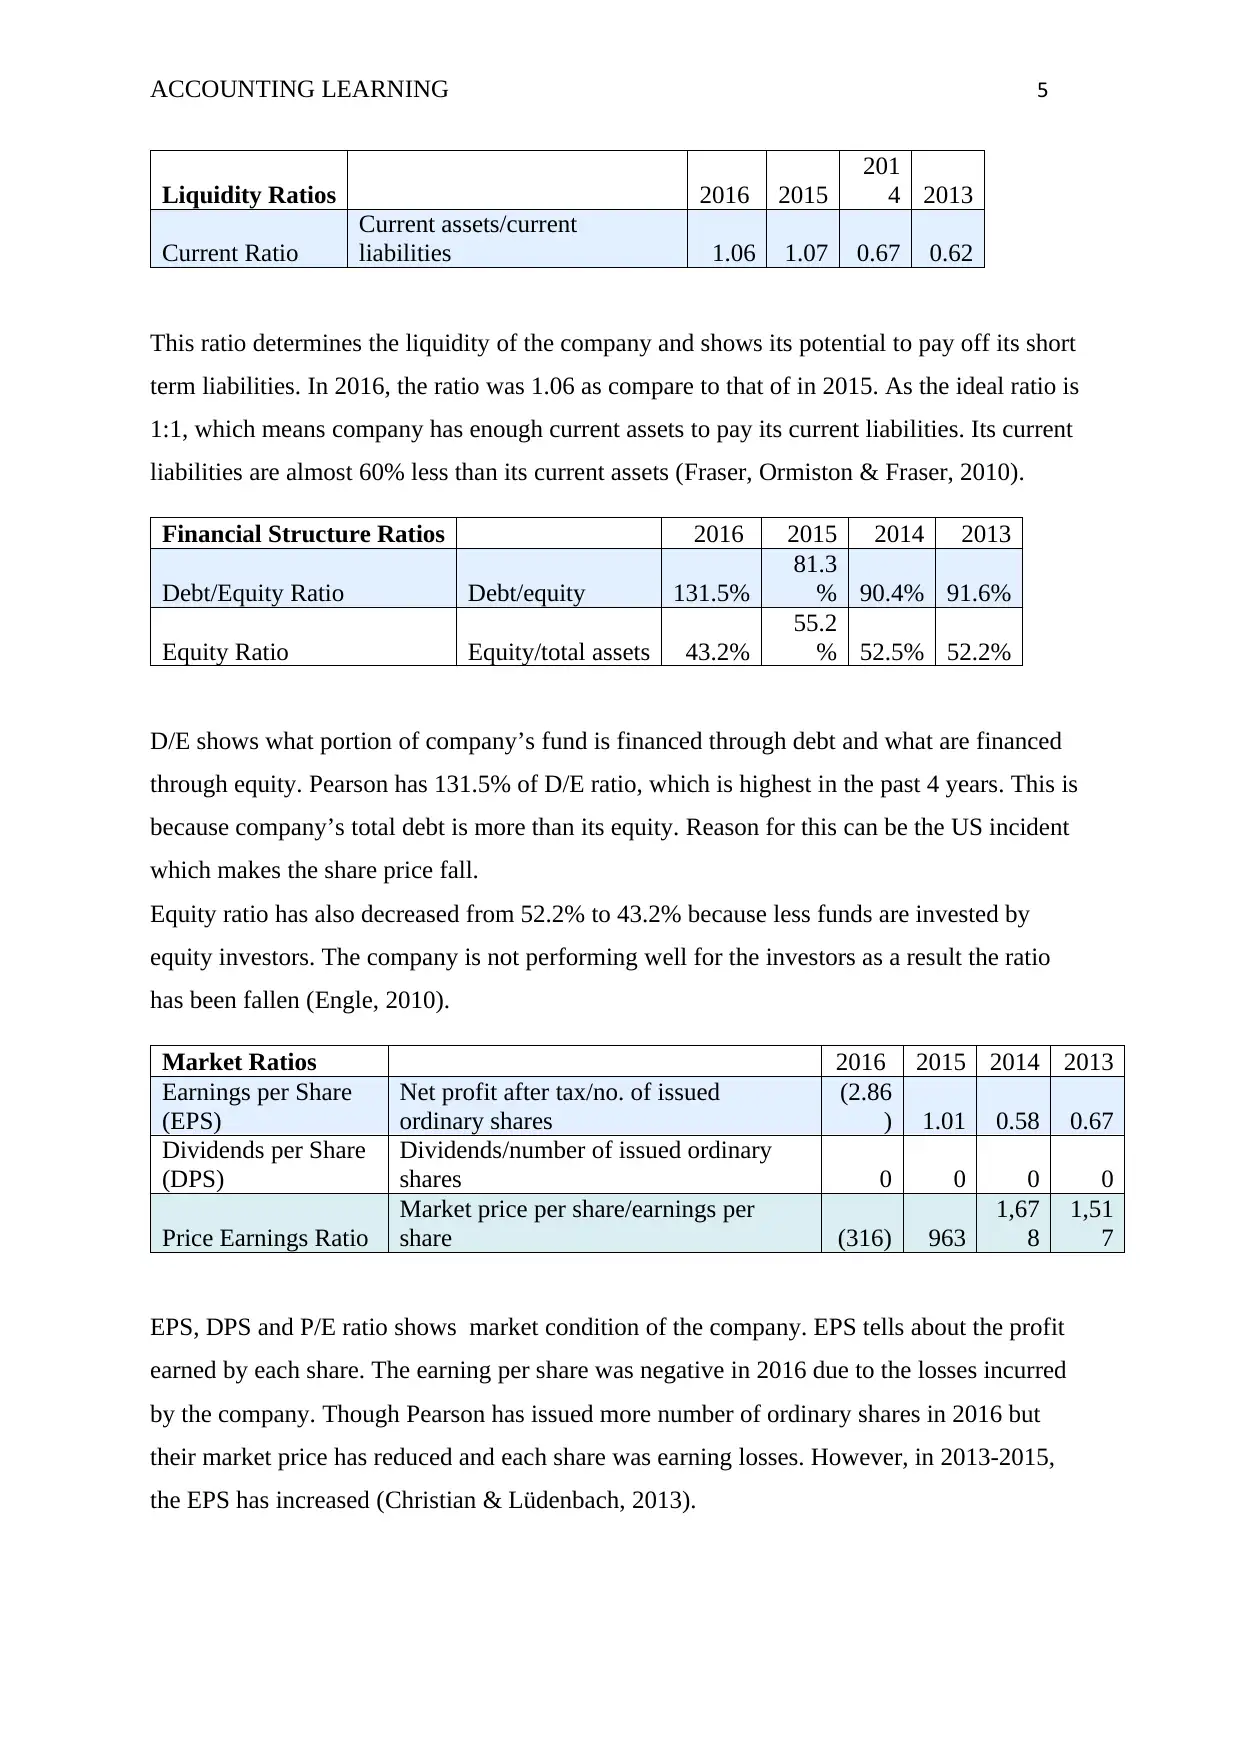
Liquidity Ratios 2016 2015
201
4 2013
Current Ratio
Current assets/current
liabilities 1.06 1.07 0.67 0.62
This ratio determines the liquidity of the company and shows its potential to pay off its short
term liabilities. In 2016, the ratio was 1.06 as compare to that of in 2015. As the ideal ratio is
1:1, which means company has enough current assets to pay its current liabilities. Its current
liabilities are almost 60% less than its current assets (Fraser, Ormiston & Fraser, 2010).
Financial Structure Ratios 2016 2015 2014 2013
Debt/Equity Ratio Debt/equity 131.5%
81.3
% 90.4% 91.6%
Equity Ratio Equity/total assets 43.2%
55.2
% 52.5% 52.2%
D/E shows what portion of company’s fund is financed through debt and what are financed
through equity. Pearson has 131.5% of D/E ratio, which is highest in the past 4 years. This is
because company’s total debt is more than its equity. Reason for this can be the US incident
which makes the share price fall.
Equity ratio has also decreased from 52.2% to 43.2% because less funds are invested by
equity investors. The company is not performing well for the investors as a result the ratio
has been fallen (Engle, 2010).
Market Ratios 2016 2015 2014 2013
Earnings per Share
(EPS)
Net profit after tax/no. of issued
ordinary shares
(2.86
) 1.01 0.58 0.67
Dividends per Share
(DPS)
Dividends/number of issued ordinary
shares 0 0 0 0
Price Earnings Ratio
Market price per share/earnings per
share (316) 963
1,67
8
1,51
7
EPS, DPS and P/E ratio shows market condition of the company. EPS tells about the profit
earned by each share. The earning per share was negative in 2016 due to the losses incurred
by the company. Though Pearson has issued more number of ordinary shares in 2016 but
their market price has reduced and each share was earning losses. However, in 2013-2015,
the EPS has increased (Christian & Lüdenbach, 2013).
ACCOUNTING LEARNING 6
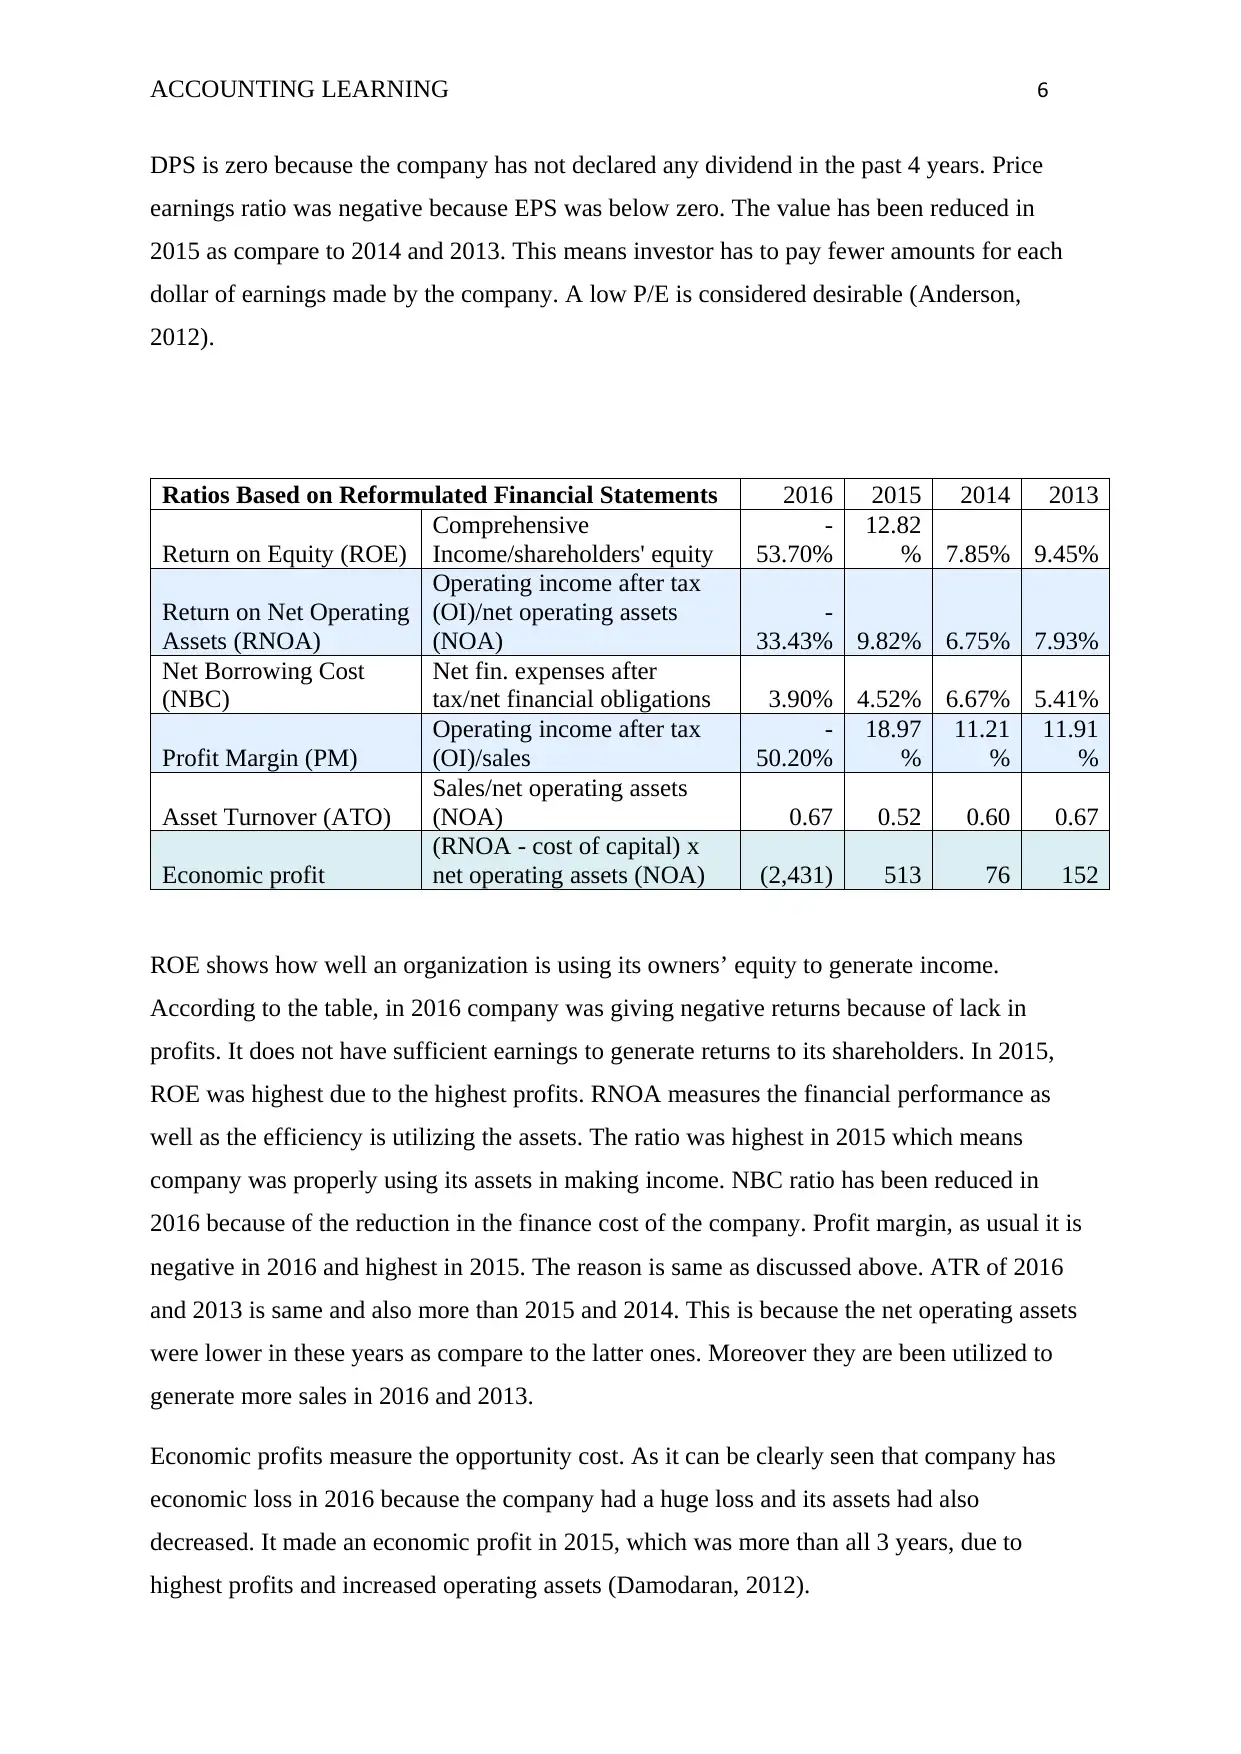
DPS is zero because the company has not declared any dividend in the past 4 years. Price
earnings ratio was negative because EPS was below zero. The value has been reduced in
2015 as compare to 2014 and 2013. This means investor has to pay fewer amounts for each
dollar of earnings made by the company. A low P/E is considered desirable (Anderson,
2012).
Ratios Based on Reformulated Financial Statements 2016 2015 2014 2013
Return on Equity (ROE)
Comprehensive
Income/shareholders' equity
-
53.70%
12.82
% 7.85% 9.45%
Return on Net Operating
Assets (RNOA)
Operating income after tax
(OI)/net operating assets
(NOA)
-
33.43% 9.82% 6.75% 7.93%
Net Borrowing Cost
(NBC)
Net fin. expenses after
tax/net financial obligations 3.90% 4.52% 6.67% 5.41%
Profit Margin (PM)
Operating income after tax
(OI)/sales
-
50.20%
18.97
%
11.21
%
11.91
%
Asset Turnover (ATO)
Sales/net operating assets
(NOA) 0.67 0.52 0.60 0.67
Economic profit
(RNOA - cost of capital) x
net operating assets (NOA) (2,431) 513 76 152
ROE shows how well an organization is using its owners’ equity to generate income.
According to the table, in 2016 company was giving negative returns because of lack in
profits. It does not have sufficient earnings to generate returns to its shareholders. In 2015,
ROE was highest due to the highest profits. RNOA measures the financial performance as
well as the efficiency is utilizing the assets. The ratio was highest in 2015 which means
company was properly using its assets in making income. NBC ratio has been reduced in
2016 because of the reduction in the finance cost of the company. Profit margin, as usual it is
negative in 2016 and highest in 2015. The reason is same as discussed above. ATR of 2016
and 2013 is same and also more than 2015 and 2014. This is because the net operating assets
were lower in these years as compare to the latter ones. Moreover they are been utilized to
generate more sales in 2016 and 2013.
Economic profits measure the opportunity cost. As it can be clearly seen that company has
economic loss in 2016 because the company had a huge loss and its assets had also
decreased. It made an economic profit in 2015, which was more than all 3 years, due to
highest profits and increased operating assets (Damodaran, 2012).
⊘ This is a preview!⊘
Do you want full access?
Subscribe today to unlock all pages.
Trusted by 1+ million students worldwide
ACCOUNTING LEARNING 7
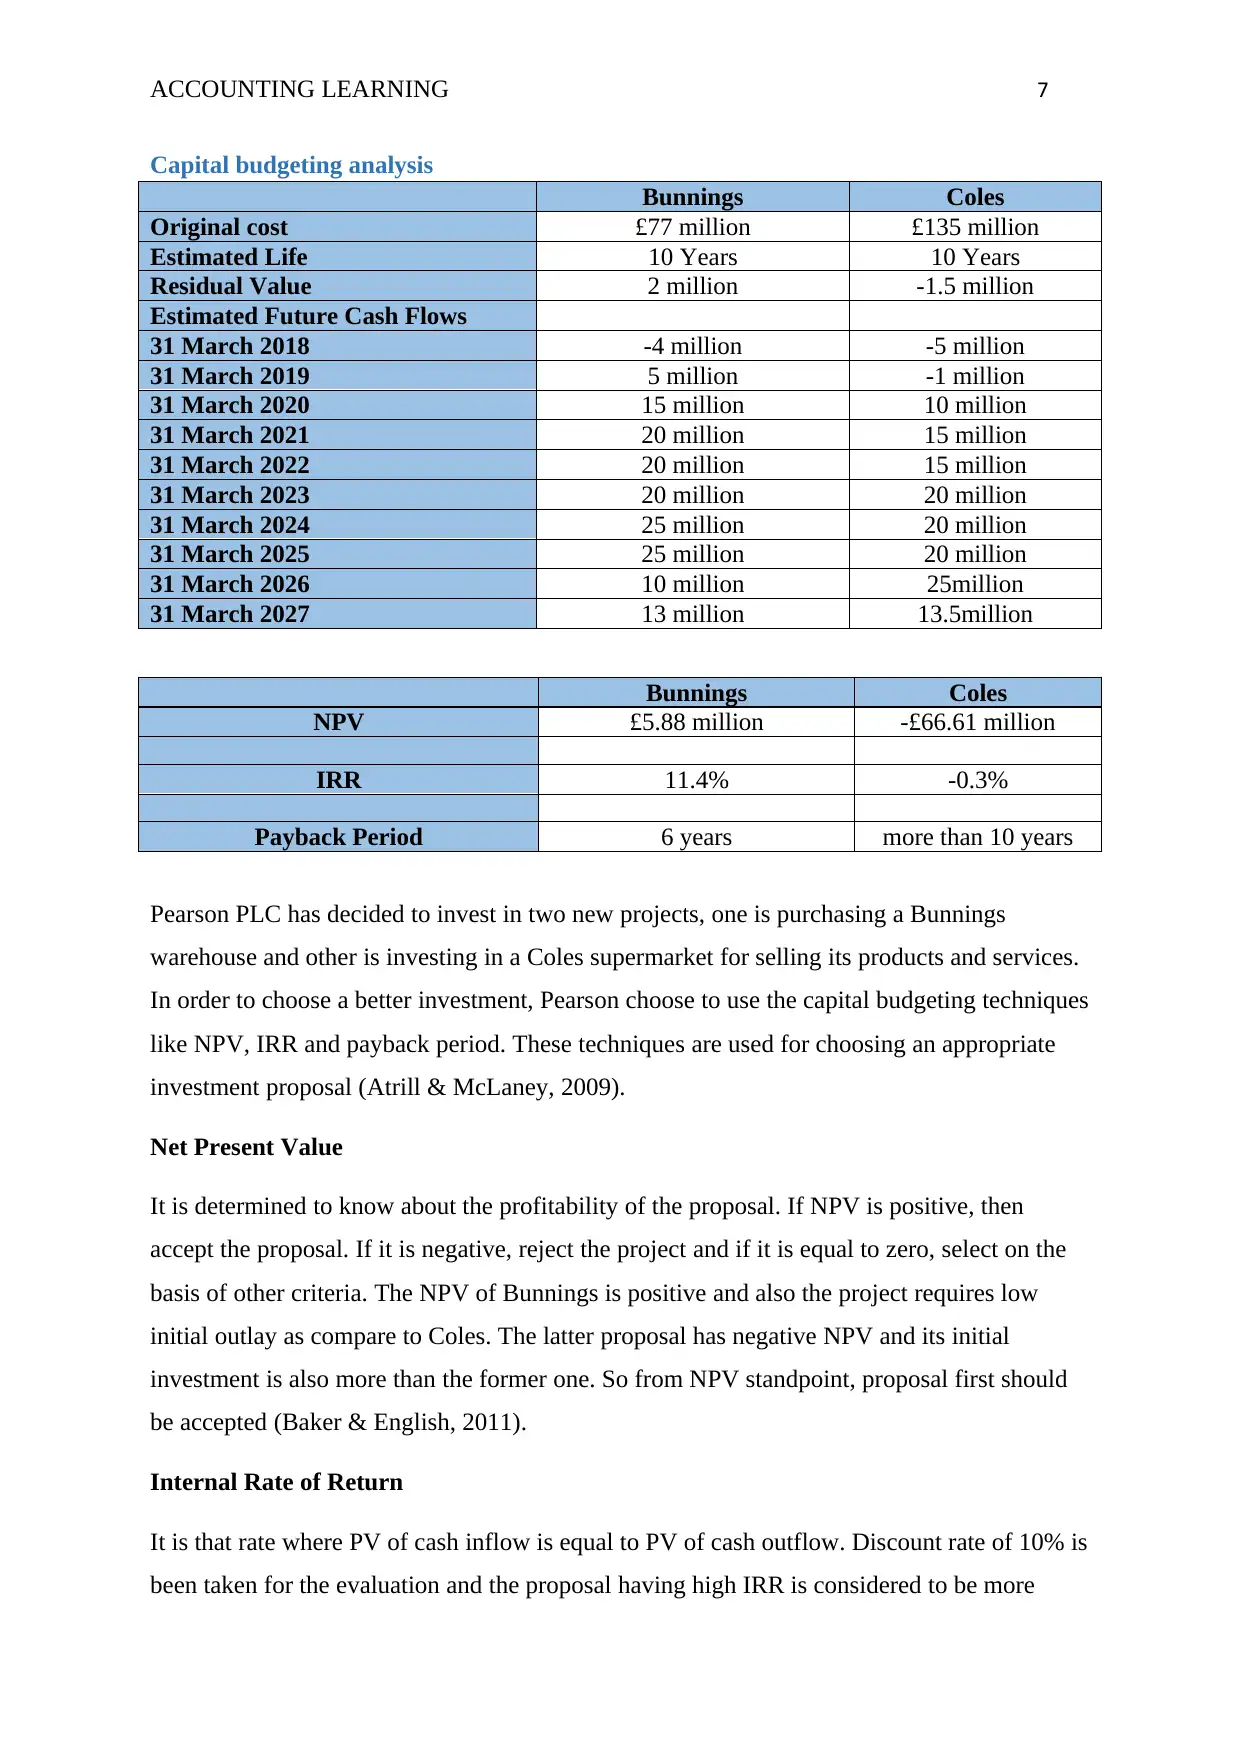
Capital budgeting analysis
Bunnings Coles
Original cost £77 million £135 million
Estimated Life 10 Years 10 Years
Residual Value 2 million -1.5 million
Estimated Future Cash Flows
31 March 2018 -4 million -5 million
31 March 2019 5 million -1 million
31 March 2020 15 million 10 million
31 March 2021 20 million 15 million
31 March 2022 20 million 15 million
31 March 2023 20 million 20 million
31 March 2024 25 million 20 million
31 March 2025 25 million 20 million
31 March 2026 10 million 25million
31 March 2027 13 million 13.5million
Bunnings Coles
NPV £5.88 million -£66.61 million
IRR 11.4% -0.3%
Payback Period 6 years more than 10 years
Pearson PLC has decided to invest in two new projects, one is purchasing a Bunnings
warehouse and other is investing in a Coles supermarket for selling its products and services.
In order to choose a better investment, Pearson choose to use the capital budgeting techniques
like NPV, IRR and payback period. These techniques are used for choosing an appropriate
investment proposal (Atrill & McLaney, 2009).
Net Present Value
It is determined to know about the profitability of the proposal. If NPV is positive, then
accept the proposal. If it is negative, reject the project and if it is equal to zero, select on the
basis of other criteria. The NPV of Bunnings is positive and also the project requires low
initial outlay as compare to Coles. The latter proposal has negative NPV and its initial
investment is also more than the former one. So from NPV standpoint, proposal first should
be accepted (Baker & English, 2011).
Internal Rate of Return
It is that rate where PV of cash inflow is equal to PV of cash outflow. Discount rate of 10% is
been taken for the evaluation and the proposal having high IRR is considered to be more
Paraphrase This Document
Need a fresh take? Get an instant paraphrase of this document with our AI Paraphraser
ACCOUNTING LEARNING 8
desirable. Bunning project has high and positive IRR of 11.4% whereas Coles has a negative
rate of -0.3%. It is better to go for Bunnings warehouses (BiermanJr & Smidt, 2012).
Payback Period
It shows the time period taken by a project to recoup the initial investment. Generally,
proposals having longer payback period are not advisable for making investment. As it is
clearly seen from the above table that Bunnings will take 6 years to recover its initial outlay
which is within its life period. On the other hand, Coles will require more than 10 years
recovering the same as the project is not capable of doing it within its life period. So proposal
one should be accepted (Ahmed, 2013).
As per all three techniques used, investment should be made in Bunnings project as it is
profitable, require less investment and also has a shorter payback period.
Conclusion
From the first part of the report, it can be concluded that ratio analysis is a best method to
evaluate company’s financial position. From this analysis, it can be said that Pearson has not
performed effectively and efficiently in year 2016. On the contrary of this, its financial
performance in 2015 was best with highest profits and highest market price per share. The
second part concluded that company should go for Bunning project as it is the most profitable
as compare to the other option available. Pearson should choose first option for making
investment.
ACCOUNTING LEARNING 9
References
Ahmed, I.E., (2013). Factors determining the selection of capital budgeting
techniques. Journal of Finance and Investment Analysis, 2(2), pp.77-88.
Anderson, K. (2012). The Essential P/E: Understanding the Stockmarket Through the
Price Earnings Ratio. Harriman House Limited.
Atrill, P. & McLaney, E., (2009). Management accounting for decision makers. Pearson
Education.
Baker, H.K. & English, P., (2011). Capital budgeting valuation: Financial analysis for
today's investment projects (Vol. 13). John Wiley & Sons.
BiermanJr, H. & Smidt, S., (2012). The capital budgeting decision: economic analysis of
investment projects. Routledge.
Christian, D., & Lüdenbach, N. (2013). IFRS essentials. John Wiley & Sons.
Damodaran, A. (2012). Investment valuation: Tools and techniques for determining the
value of any asset (Vol. 666). John Wiley & Sons.
Engle, C. R. (2010). Aquaculture economics and financing: management and analysis.
John Wiley & Sons.
Fraser, L.M., Ormiston, A. & Fraser, L.M. (2010). Understanding financial statements.
Pearson
Higgins, R. C. (2012). Analysis for financial management. McGraw-Hill/Irwin.
Lee, A. C., Lee, J. C., & Lee, C. F. (2009). Financial analysis, planning and forecasting:
Theory and application. World Scientific Publishing Co Inc.
Tracy, A. (2012). Ratio analysis fundamentals: how 17 financial ratios can allow you to
analyse any business on the planet. RatioAnalysis. Net.
Vogel, H.L. (2014). Entertainment industry economics: A guide for financial analysis.
Cambridge University Press.
Warren, C. S., & Jones, J. (2018). Corporate financial accounting. Cengage Learning.
Zainudin, E.F., Zainudin, E.F., Hashim, H.A. & Hashim, H.A. (2016). Detecting
fraudulent financial reporting using financial ratio. Journal of Financial Reporting
and Accounting, 14(2), pp.266-278.
⊘ This is a preview!⊘
Do you want full access?
Subscribe today to unlock all pages.
Trusted by 1+ million students worldwide
1 out of 9
Related Documents


Your All-in-One AI-Powered Toolkit for Academic Success.
+13062052269
info@desklib.com
Available 24*7 on WhatsApp / Email
![[object Object]](/_next/static/media/star-bottom.7253800d.svg)
Unlock your academic potential
Copyright © 2020–2026 A2Z Services. All Rights Reserved. Developed and managed by ZUCOL.