University of Roehampton: Pecan Peanuts Data Analysis Report 2020
VerifiedAdded on 2023/01/09
|15
|3408
|23
Report
AI Summary
This report, prepared for Pecan Peanuts, presents a comprehensive data analysis of the company's operations and market position. It begins with an overview of the Australian pecan industry and provides a linear forecast of export production. The report then analyzes the health aspects of different nuts (pecans, peanuts, cashews, and pistachios) using a stacked column chart. It further assesses quality assurance conditions for machinery, predicts machine costs, and conducts hypothesis testing to compare machinery performance. A pros and cons analysis is presented to evaluate the purchase of new machinery, followed by an analysis of customer satisfaction and a SWOT analysis to explore potential expansion opportunities. The report concludes with key findings and recommendations based on the analysis.
DATA ANALYSIS PECAN PEANUTS
REPORT
15 ref chahiye
REPORT
15 ref chahiye
Paraphrase This Document
Need a fresh take? Get an instant paraphrase of this document with our AI Paraphraser
INTRODUCTION...........................................................................................................................1
MAIN BODY..................................................................................................................................1
TASK 1............................................................................................................................................1
Overview......................................................................................................................................1
TASK 2............................................................................................................................................2
Produce scatter diagram...............................................................................................................2
TASK 3............................................................................................................................................2
Healthiness from Pecan, Peanuts, Cashews and Pistachio..........................................................2
TASK 4............................................................................................................................................3
Quality Assurance........................................................................................................................3
TASK 5............................................................................................................................................4
Cost of Machinery.......................................................................................................................4
TASK 6............................................................................................................................................5
Hypothesis testing........................................................................................................................5
TASK 7............................................................................................................................................6
Pros and cons analysis.................................................................................................................6
TASK 8............................................................................................................................................6
Customer satisfaction...................................................................................................................6
TASK 9............................................................................................................................................7
SWOT analysis............................................................................................................................7
TASK 10..........................................................................................................................................8
Findings.......................................................................................................................................8
CONCLUSION................................................................................................................................8

REFERENCES................................................................................................................................9
Appendix........................................................................................................................................10
Appendix........................................................................................................................................10
⊘ This is a preview!⊘
Do you want full access?
Subscribe today to unlock all pages.
Trusted by 1+ million students worldwide
INTRODUCTION
Pecan Peanuts is a manufacturer of nut that supplies its goods to various countries. It sources
from Australia which fulfils the need of consumers from all over the world (Brar, Strawn and
Danyluk, 2016). This report is based on the company and its various strategies. Peanuts are not
nuts; they are legumes which are seeds and beans. Additional foods and other variations involve
peanut flour, peanut oil, peanut butter etc. This assessment is based on Australian Pecan industry
and they also decided to extend their business into new markets. This evaluation examines the
different approaches that organisations pursue for their growth, so they need to analyze every
factor until execution.
MAIN BODY
TASK 1
Overview
Pecan: The processed nuts manufactured throughout the main factory that is situated in the
UK. Pecan and peanuts also take into account as snack and these are best selling items in the buts
categories (Atanasov and et.al., 2018). This product imported from all over the Australia. It
started its production in 2017, but the operational earnings for all the periods are slowly growing
for it since business settlement. More and more consumers are now focusing on nutritious snacks
and their appetite is also growing. Some of the existing companies tend to have been breaking
apart recently, and the business wants to buy a new one so that the business can grow.
Australian pecan industry: Most of Australia's pecan business is concentrated in north New
South Wales (NSW) and south-eastern Queensland (QLD). Australia is home to over 100 pecan
growers and over 180,000 flowering plants. Organic farmers from the Australian Pecan Growers
Association (APGA) grow about 95 % of nuts in Australia. The Australian Pecan Industry is
growing considerably, and exports are recorded at around $ 104.5 million in 2018/19. There are
also different kinds of nuts that are sold in many countries such as almonds, chestnuts, hazelnuts,
roasted cashews etc. Since 2006, Australian manufacturer of pecan has been on a downward
trend of about 3,000 tons (Brar and Danyluk, 2019). The growth of the company has been of
considerable interest, and demand is expected to grow to around 9,500 tons in casing by 2025.
The discovery of regions ideal for pecan production is an important factor in growing the field.
1
Paraphrase This Document
Need a fresh take? Get an instant paraphrase of this document with our AI Paraphraser
TASK 2
Produce scatter diagram
Scatter diagram:
Data mentioned in appendix*
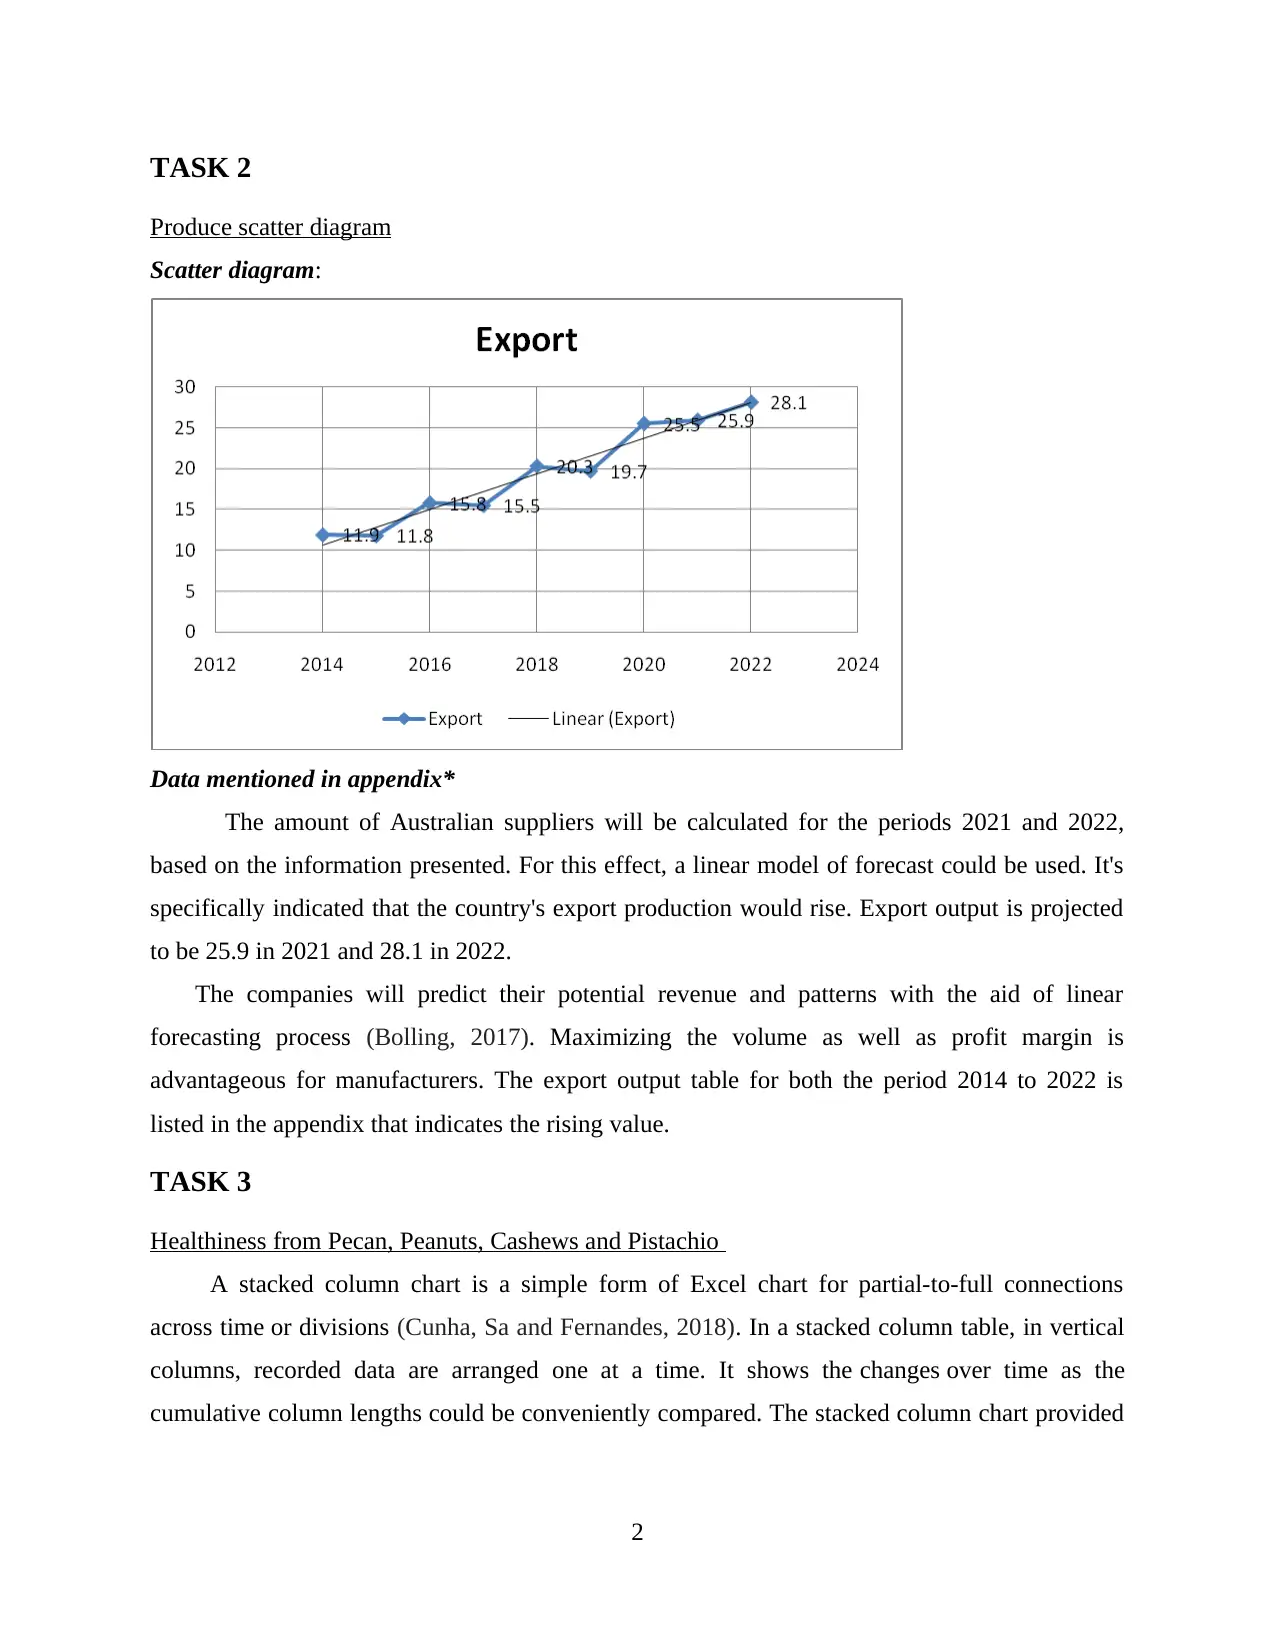
The amount of Australian suppliers will be calculated for the periods 2021 and 2022,
based on the information presented. For this effect, a linear model of forecast could be used. It's
specifically indicated that the country's export production would rise. Export output is projected
to be 25.9 in 2021 and 28.1 in 2022.
The companies will predict their potential revenue and patterns with the aid of linear
forecasting process (Bolling, 2017). Maximizing the volume as well as profit margin is
advantageous for manufacturers. The export output table for both the period 2014 to 2022 is
listed in the appendix that indicates the rising value.
TASK 3
Healthiness from Pecan, Peanuts, Cashews and Pistachio
A stacked column chart is a simple form of Excel chart for partial-to-full connections
across time or divisions (Cunha, Sa and Fernandes, 2018). In a stacked column table, in vertical
columns, recorded data are arranged one at a time. It shows the changes over time as the
cumulative column lengths could be conveniently compared. The stacked column chart provided
2
Produce scatter diagram
Scatter diagram:
Data mentioned in appendix*
The amount of Australian suppliers will be calculated for the periods 2021 and 2022,
based on the information presented. For this effect, a linear model of forecast could be used. It's
specifically indicated that the country's export production would rise. Export output is projected
to be 25.9 in 2021 and 28.1 in 2022.
The companies will predict their potential revenue and patterns with the aid of linear
forecasting process (Bolling, 2017). Maximizing the volume as well as profit margin is
advantageous for manufacturers. The export output table for both the period 2014 to 2022 is
listed in the appendix that indicates the rising value.
TASK 3
Healthiness from Pecan, Peanuts, Cashews and Pistachio
A stacked column chart is a simple form of Excel chart for partial-to-full connections
across time or divisions (Cunha, Sa and Fernandes, 2018). In a stacked column table, in vertical
columns, recorded data are arranged one at a time. It shows the changes over time as the
cumulative column lengths could be conveniently compared. The stacked column chart provided
2
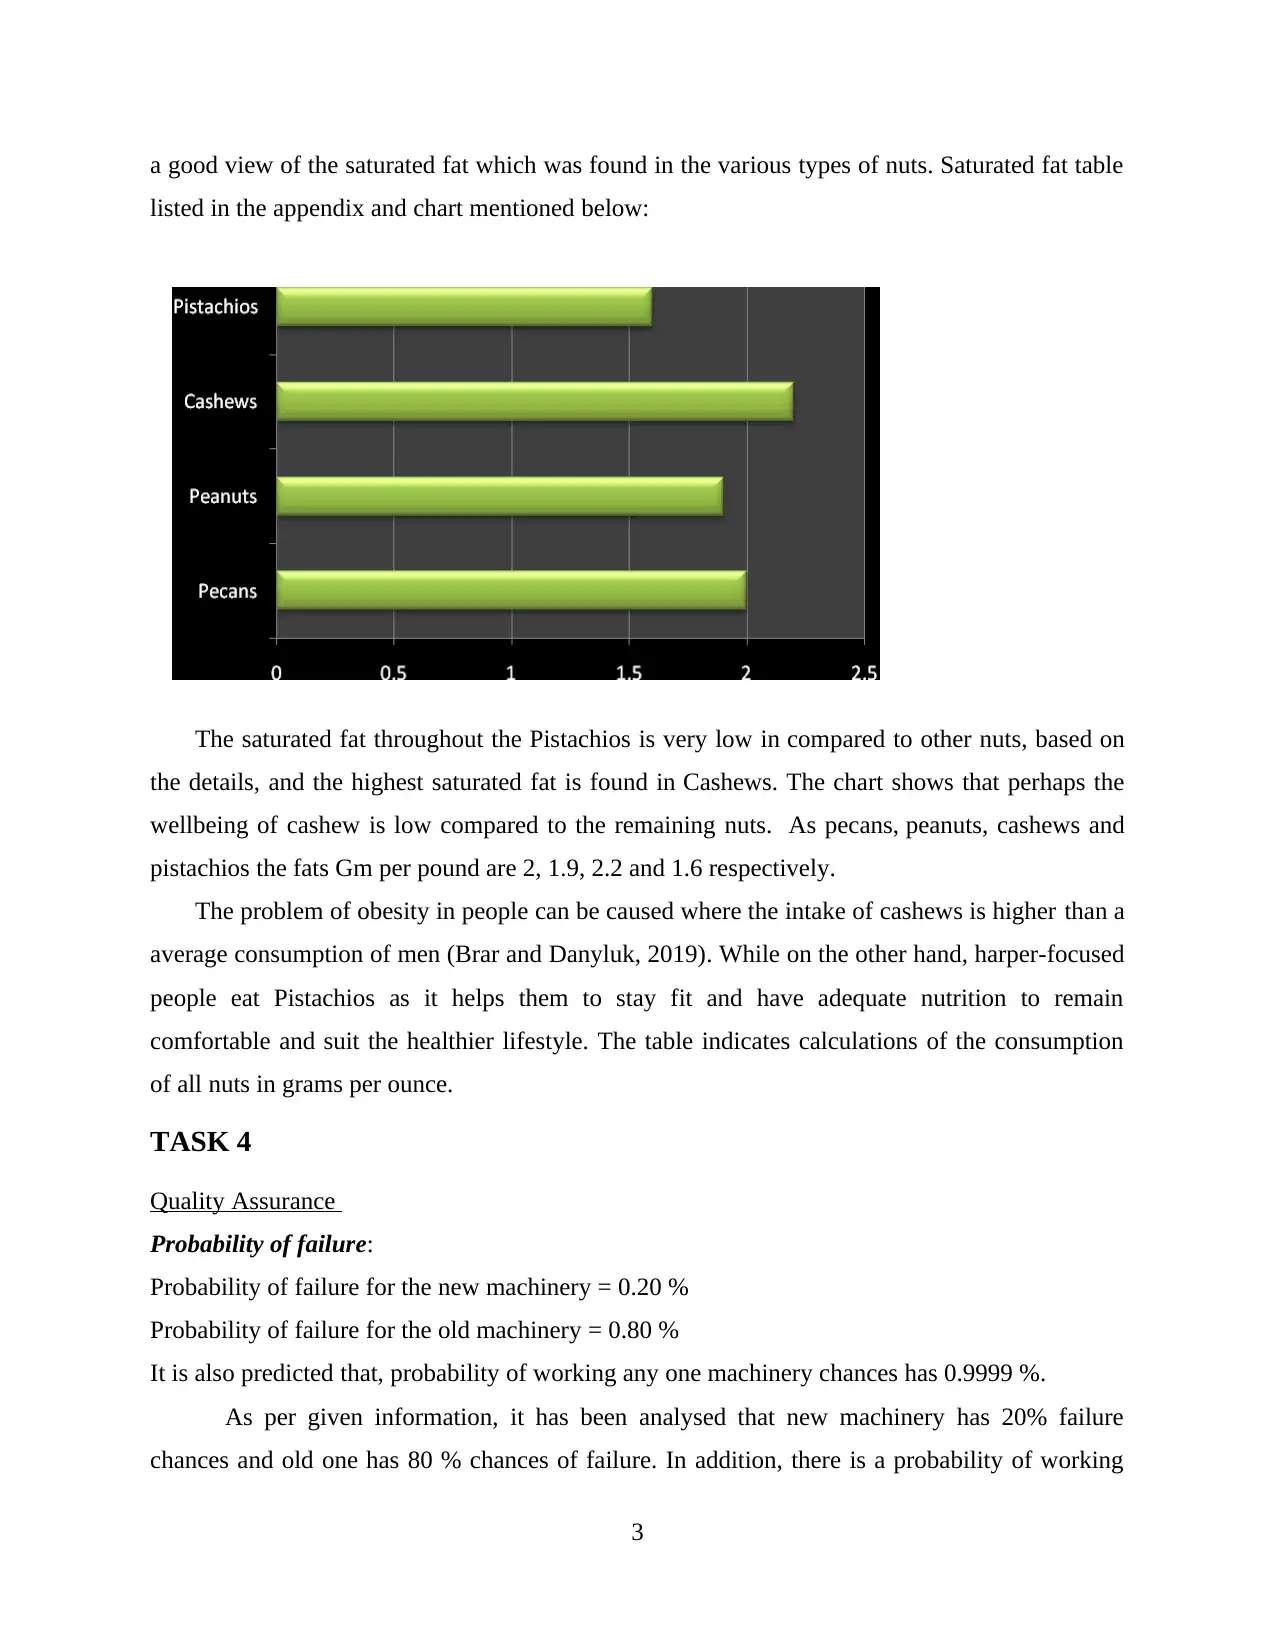
a good view of the saturated fat which was found in the various types of nuts. Saturated fat table
listed in the appendix and chart mentioned below:
The saturated fat throughout the Pistachios is very low in compared to other nuts, based on
the details, and the highest saturated fat is found in Cashews. The chart shows that perhaps the
wellbeing of cashew is low compared to the remaining nuts. As pecans, peanuts, cashews and
pistachios the fats Gm per pound are 2, 1.9, 2.2 and 1.6 respectively.
The problem of obesity in people can be caused where the intake of cashews is higher than a
average consumption of men (Brar and Danyluk, 2019). While on the other hand, harper-focused
people eat Pistachios as it helps them to stay fit and have adequate nutrition to remain
comfortable and suit the healthier lifestyle. The table indicates calculations of the consumption
of all nuts in grams per ounce.
TASK 4
Quality Assurance
Probability of failure:
Probability of failure for the new machinery = 0.20 %
Probability of failure for the old machinery = 0.80 %
It is also predicted that, probability of working any one machinery chances has 0.9999 %.
As per given information, it has been analysed that new machinery has 20% failure
chances and old one has 80 % chances of failure. In addition, there is a probability of working
3
⊘ This is a preview!⊘
Do you want full access?
Subscribe today to unlock all pages.
Trusted by 1+ million students worldwide
one machinery is 99%, so it could be possible that it will be new machinery because it has low
chances of failure. Further calculation mentioned below:
Calculations are as follow:
New machinery = 0.9999 % - 0.20 %
= 0.7999 %
Old machinery = 0.9999 % - 0.80 %
= 0.1999 %
This has been concluded from the cumulative analysis of the above mentioned equation that
new machinery has greater precision in contrast to another (Dean, 2018). New machinery offers
0.79% efficiency or the output of old machinery is 0.19%. As per the agency's possibility of
quality control, only sole machinery has 99 percent chances of functioning and it would be new
machinery. New machinery has smaller risk of loss and high probability of operating according
to the Quality Assurance department.
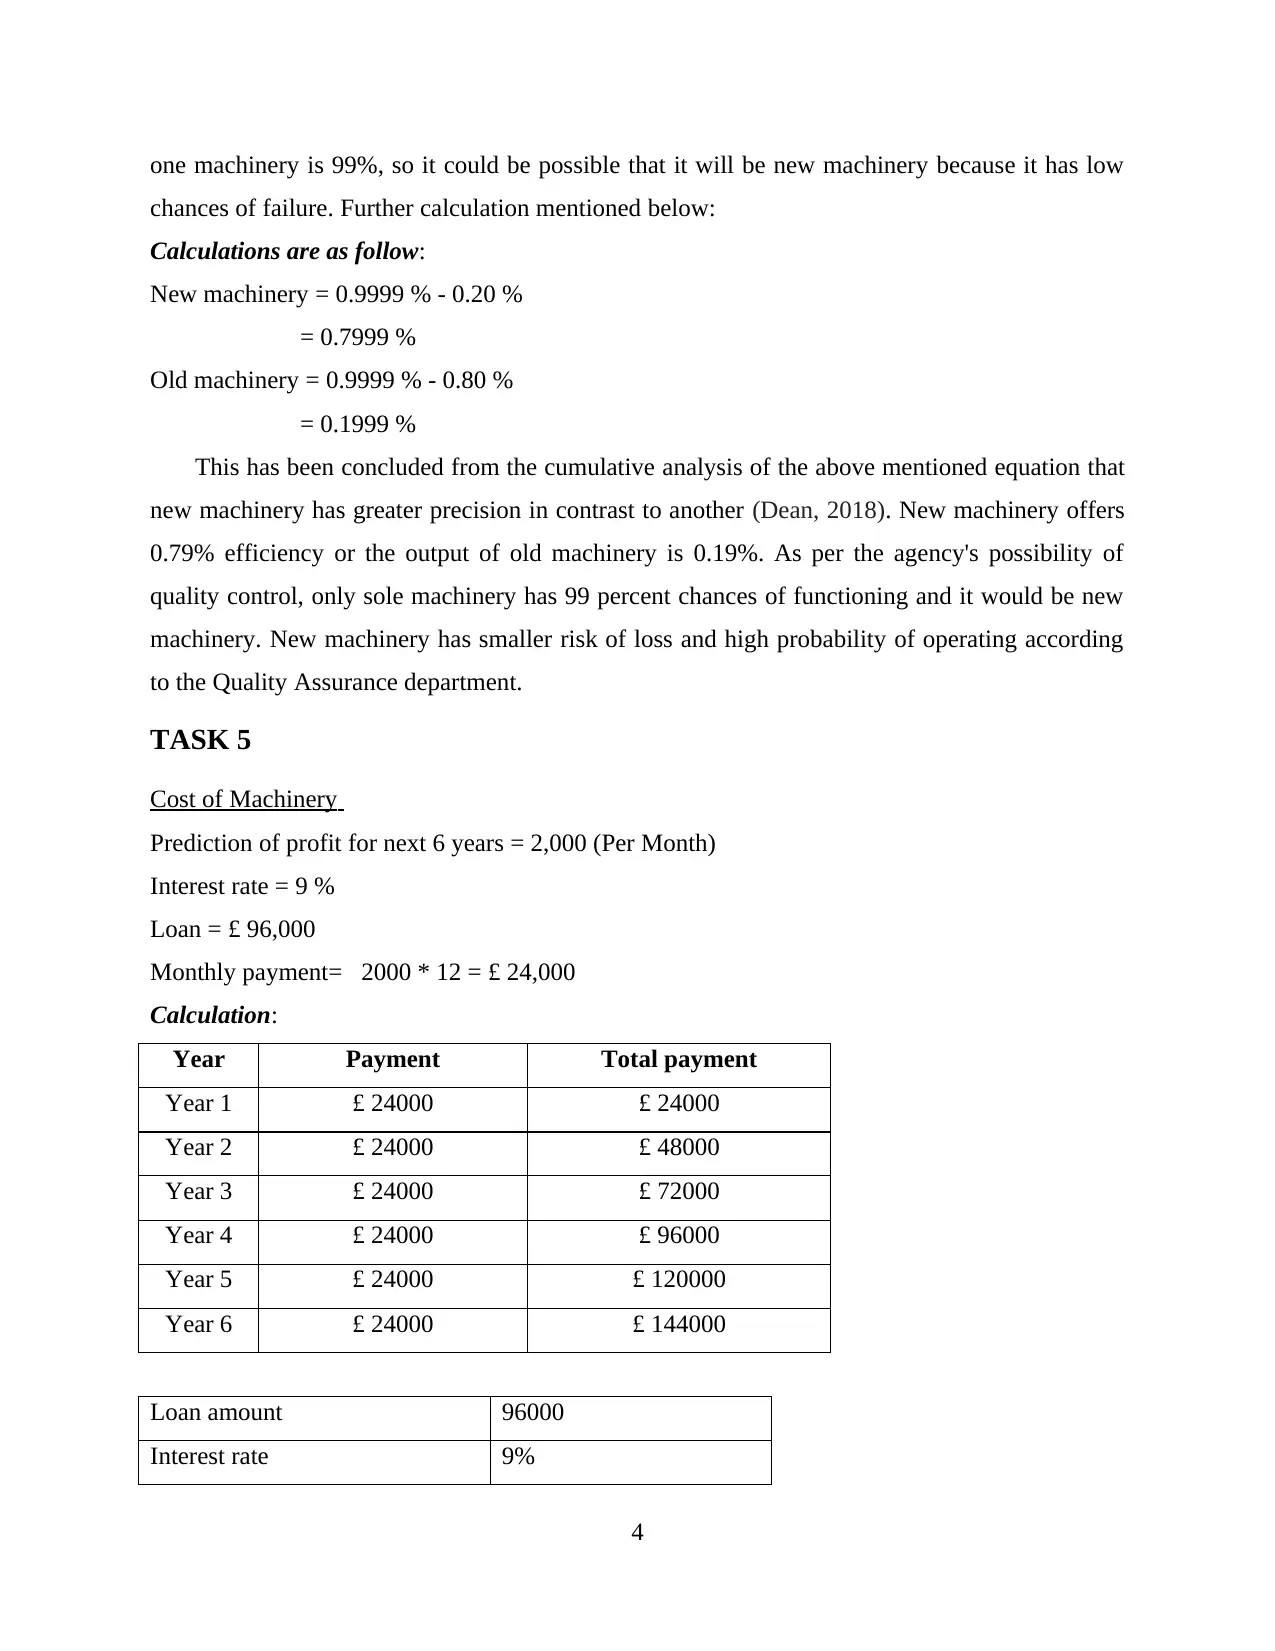
TASK 5
Cost of Machinery
Prediction of profit for next 6 years = 2,000 (Per Month)
Interest rate = 9 %
Loan = £ 96,000
Monthly payment= 2000 * 12 = £ 24,000
Calculation:
Year Payment Total payment
Year 1 £ 24000 £ 24000
Year 2 £ 24000 £ 48000
Year 3 £ 24000 £ 72000
Year 4 £ 24000 £ 96000
Year 5 £ 24000 £ 120000
Year 6 £ 24000 £ 144000
Loan amount 96000
Interest rate 9%
4
chances of failure. Further calculation mentioned below:
Calculations are as follow:
New machinery = 0.9999 % - 0.20 %
= 0.7999 %
Old machinery = 0.9999 % - 0.80 %
= 0.1999 %
This has been concluded from the cumulative analysis of the above mentioned equation that
new machinery has greater precision in contrast to another (Dean, 2018). New machinery offers
0.79% efficiency or the output of old machinery is 0.19%. As per the agency's possibility of
quality control, only sole machinery has 99 percent chances of functioning and it would be new
machinery. New machinery has smaller risk of loss and high probability of operating according
to the Quality Assurance department.
TASK 5
Cost of Machinery
Prediction of profit for next 6 years = 2,000 (Per Month)
Interest rate = 9 %
Loan = £ 96,000
Monthly payment= 2000 * 12 = £ 24,000
Calculation:
Year Payment Total payment
Year 1 £ 24000 £ 24000
Year 2 £ 24000 £ 48000
Year 3 £ 24000 £ 72000
Year 4 £ 24000 £ 96000
Year 5 £ 24000 £ 120000
Year 6 £ 24000 £ 144000
Loan amount 96000
Interest rate 9%
4
Paraphrase This Document
Need a fresh take? Get an instant paraphrase of this document with our AI Paraphraser
Period terms in months 72
Compounding period per month 12
₹ 1,730.45
It is estimated that the company would be able to re-pay the debt balance in 6 years. This
would be strongly advised that company will take 72 months loan and development that lets
them fulfil their funding requirements and allows them to pay back in 6 years (Cetinkaya and
et.al., 2020). Business raises money in leftover periods and has to invest on new machine to grow
their sector. Investing in new equipment by taking loans for a period of four years is both
advantageous and productive activity for the company.
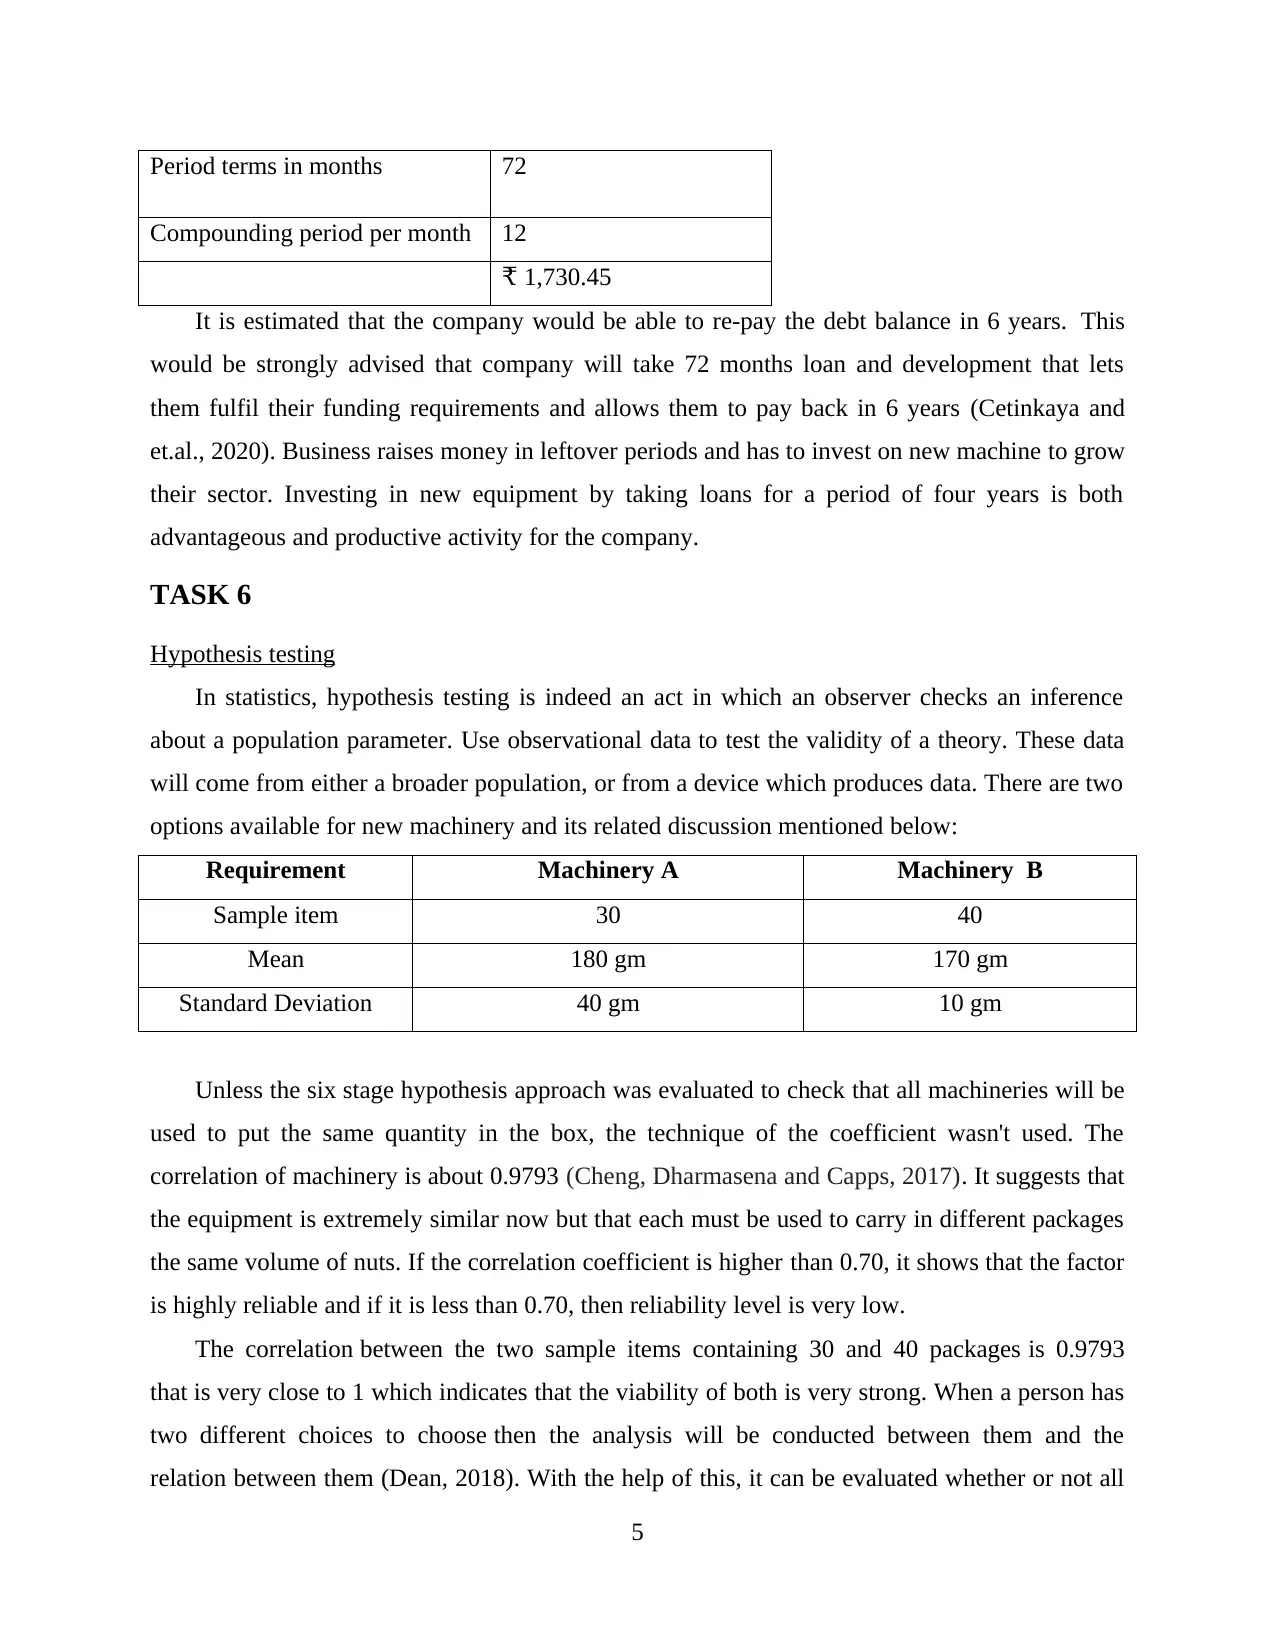
TASK 6
Hypothesis testing
In statistics, hypothesis testing is indeed an act in which an observer checks an inference
about a population parameter. Use observational data to test the validity of a theory. These data
will come from either a broader population, or from a device which produces data. There are two
options available for new machinery and its related discussion mentioned below:
Requirement Machinery A Machinery B
Sample item 30 40
Mean 180 gm 170 gm
Standard Deviation 40 gm 10 gm
Unless the six stage hypothesis approach was evaluated to check that all machineries will be
used to put the same quantity in the box, the technique of the coefficient wasn't used. The
correlation of machinery is about 0.9793 (Cheng, Dharmasena and Capps, 2017). It suggests that
the equipment is extremely similar now but that each must be used to carry in different packages
the same volume of nuts. If the correlation coefficient is higher than 0.70, it shows that the factor
is highly reliable and if it is less than 0.70, then reliability level is very low.
The correlation between the two sample items containing 30 and 40 packages is 0.9793
that is very close to 1 which indicates that the viability of both is very strong. When a person has
two different choices to choose then the analysis will be conducted between them and the
relation between them (Dean, 2018). With the help of this, it can be evaluated whether or not all
5
Compounding period per month 12
₹ 1,730.45
It is estimated that the company would be able to re-pay the debt balance in 6 years. This
would be strongly advised that company will take 72 months loan and development that lets
them fulfil their funding requirements and allows them to pay back in 6 years (Cetinkaya and
et.al., 2020). Business raises money in leftover periods and has to invest on new machine to grow
their sector. Investing in new equipment by taking loans for a period of four years is both
advantageous and productive activity for the company.
TASK 6
Hypothesis testing
In statistics, hypothesis testing is indeed an act in which an observer checks an inference
about a population parameter. Use observational data to test the validity of a theory. These data
will come from either a broader population, or from a device which produces data. There are two
options available for new machinery and its related discussion mentioned below:
Requirement Machinery A Machinery B
Sample item 30 40
Mean 180 gm 170 gm
Standard Deviation 40 gm 10 gm
Unless the six stage hypothesis approach was evaluated to check that all machineries will be
used to put the same quantity in the box, the technique of the coefficient wasn't used. The
correlation of machinery is about 0.9793 (Cheng, Dharmasena and Capps, 2017). It suggests that
the equipment is extremely similar now but that each must be used to carry in different packages
the same volume of nuts. If the correlation coefficient is higher than 0.70, it shows that the factor
is highly reliable and if it is less than 0.70, then reliability level is very low.
The correlation between the two sample items containing 30 and 40 packages is 0.9793
that is very close to 1 which indicates that the viability of both is very strong. When a person has
two different choices to choose then the analysis will be conducted between them and the
relation between them (Dean, 2018). With the help of this, it can be evaluated whether or not all
5
solutions are consistent against each other for the entity. Higher mean and standard deviation
form should be utilized by the person where they are not compatible, as it will yield good results.
In the case of Pecan Peanuts, the relation is very good which means durability of the products.
Company is suggested to go with first option that is Machinery A which has higher mean and
S.D for lower sample items.
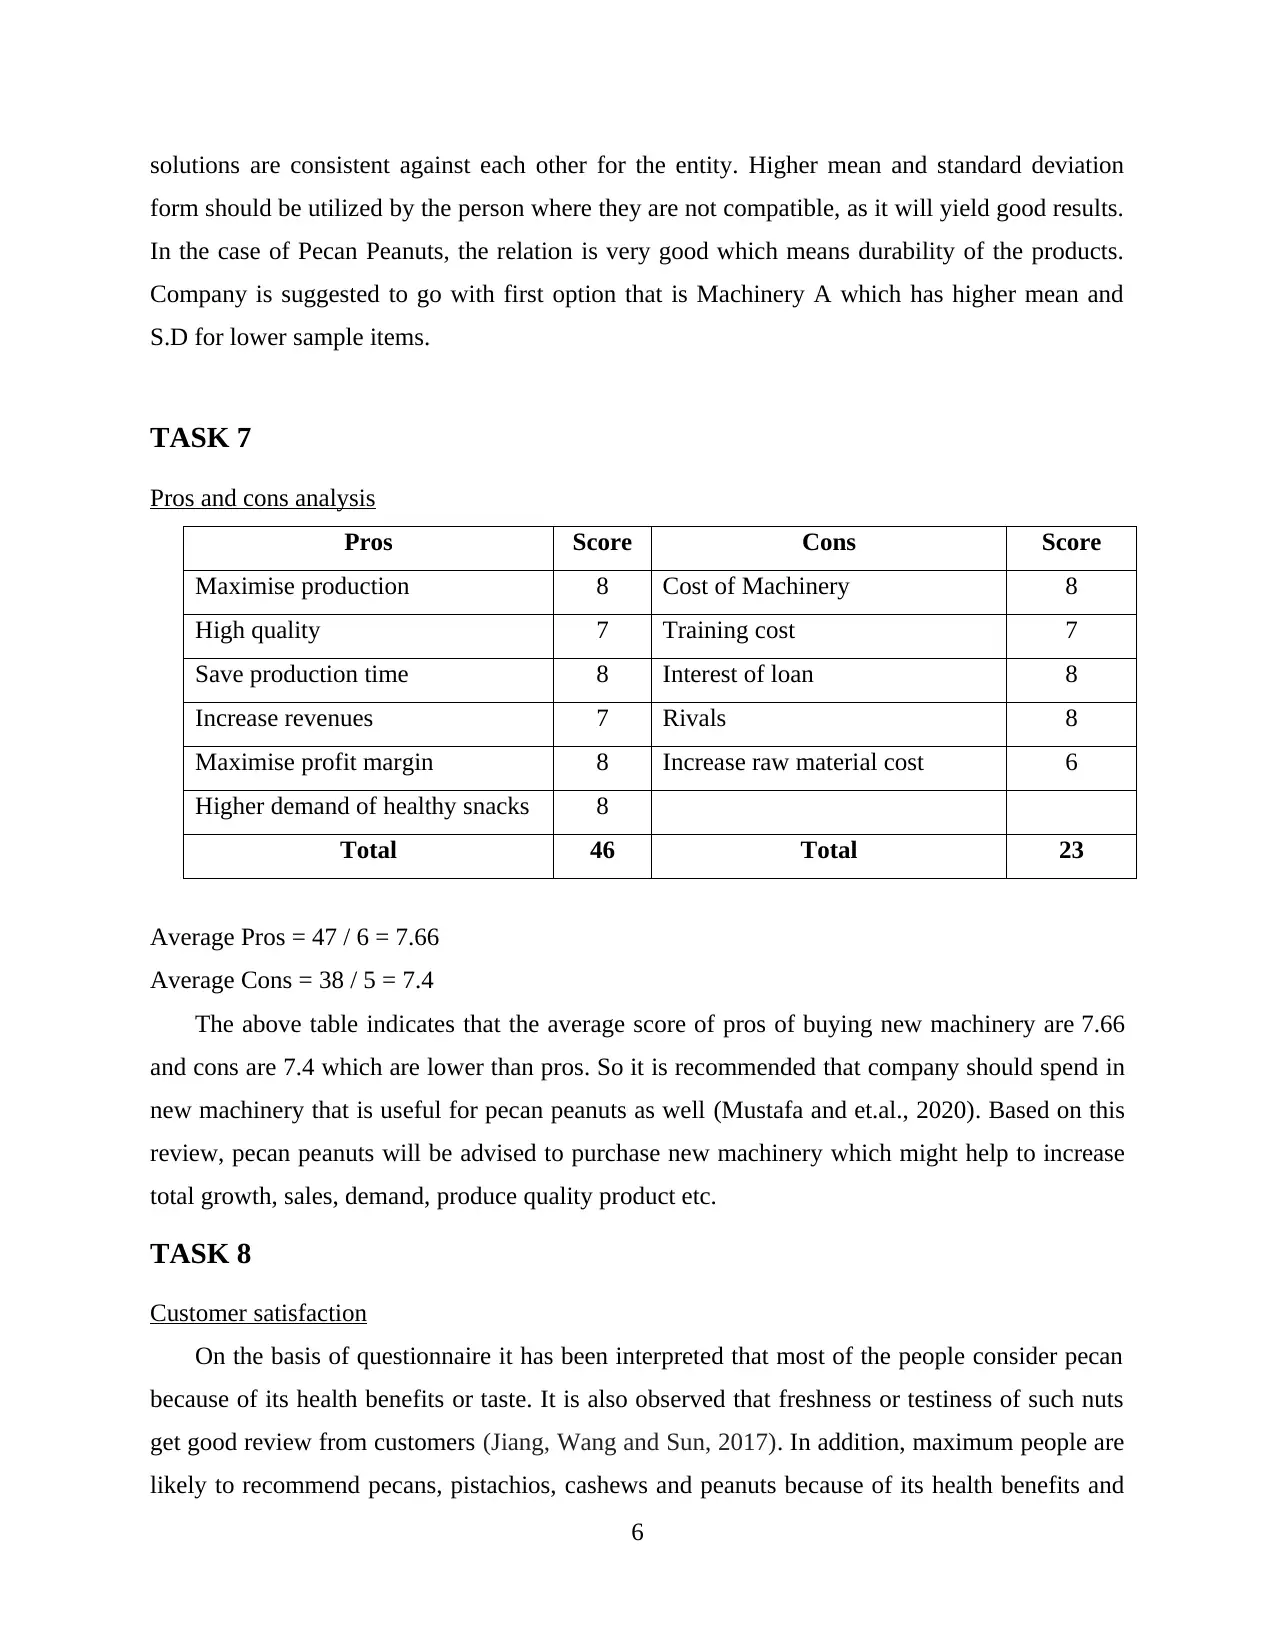
TASK 7
Pros and cons analysis
Pros Score Cons Score
Maximise production 8 Cost of Machinery 8
High quality 7 Training cost 7
Save production time 8 Interest of loan 8
Increase revenues 7 Rivals 8
Maximise profit margin 8 Increase raw material cost 6
Higher demand of healthy snacks 8
Total 46 Total 23
Average Pros = 47 / 6 = 7.66
Average Cons = 38 / 5 = 7.4
The above table indicates that the average score of pros of buying new machinery are 7.66
and cons are 7.4 which are lower than pros. So it is recommended that company should spend in
new machinery that is useful for pecan peanuts as well (Mustafa and et.al., 2020). Based on this
review, pecan peanuts will be advised to purchase new machinery which might help to increase
total growth, sales, demand, produce quality product etc.
TASK 8
Customer satisfaction
On the basis of questionnaire it has been interpreted that most of the people consider pecan
because of its health benefits or taste. It is also observed that freshness or testiness of such nuts
get good review from customers (Jiang, Wang and Sun, 2017). In addition, maximum people are
likely to recommend pecans, pistachios, cashews and peanuts because of its health benefits and
6
form should be utilized by the person where they are not compatible, as it will yield good results.
In the case of Pecan Peanuts, the relation is very good which means durability of the products.
Company is suggested to go with first option that is Machinery A which has higher mean and
S.D for lower sample items.
TASK 7
Pros and cons analysis
Pros Score Cons Score
Maximise production 8 Cost of Machinery 8
High quality 7 Training cost 7
Save production time 8 Interest of loan 8
Increase revenues 7 Rivals 8
Maximise profit margin 8 Increase raw material cost 6
Higher demand of healthy snacks 8
Total 46 Total 23
Average Pros = 47 / 6 = 7.66
Average Cons = 38 / 5 = 7.4
The above table indicates that the average score of pros of buying new machinery are 7.66
and cons are 7.4 which are lower than pros. So it is recommended that company should spend in
new machinery that is useful for pecan peanuts as well (Mustafa and et.al., 2020). Based on this
review, pecan peanuts will be advised to purchase new machinery which might help to increase
total growth, sales, demand, produce quality product etc.
TASK 8
Customer satisfaction
On the basis of questionnaire it has been interpreted that most of the people consider pecan
because of its health benefits or taste. It is also observed that freshness or testiness of such nuts
get good review from customers (Jiang, Wang and Sun, 2017). In addition, maximum people are
likely to recommend pecans, pistachios, cashews and peanuts because of its health benefits and
6
⊘ This is a preview!⊘
Do you want full access?
Subscribe today to unlock all pages.
Trusted by 1+ million students worldwide
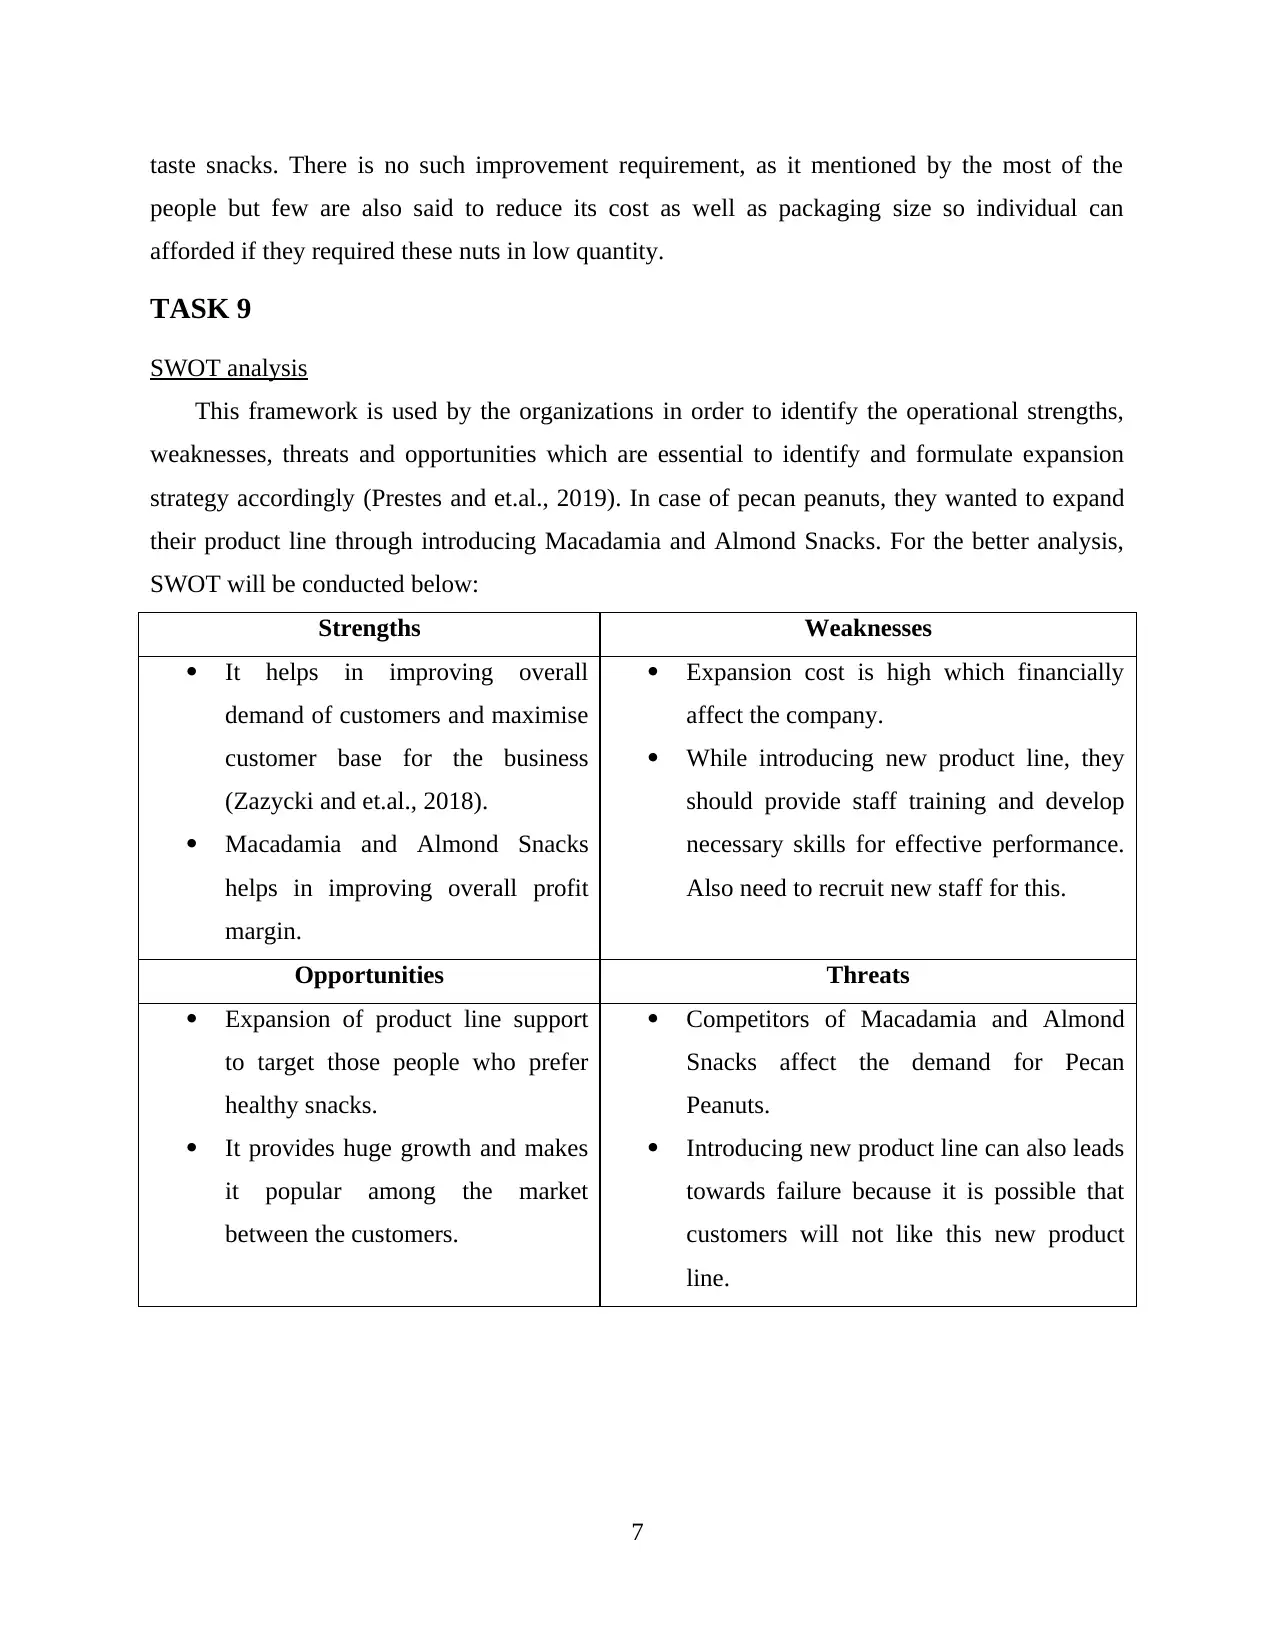
taste snacks. There is no such improvement requirement, as it mentioned by the most of the
people but few are also said to reduce its cost as well as packaging size so individual can
afforded if they required these nuts in low quantity.
TASK 9
SWOT analysis
This framework is used by the organizations in order to identify the operational strengths,
weaknesses, threats and opportunities which are essential to identify and formulate expansion
strategy accordingly (Prestes and et.al., 2019). In case of pecan peanuts, they wanted to expand
their product line through introducing Macadamia and Almond Snacks. For the better analysis,
SWOT will be conducted below:
Strengths Weaknesses
It helps in improving overall
demand of customers and maximise
customer base for the business
(Zazycki and et.al., 2018).
Macadamia and Almond Snacks
helps in improving overall profit
margin.
Expansion cost is high which financially
affect the company.
While introducing new product line, they
should provide staff training and develop
necessary skills for effective performance.
Also need to recruit new staff for this.
Opportunities Threats
Expansion of product line support
to target those people who prefer
healthy snacks.
It provides huge growth and makes
it popular among the market
between the customers.
Competitors of Macadamia and Almond
Snacks affect the demand for Pecan
Peanuts.
Introducing new product line can also leads
towards failure because it is possible that
customers will not like this new product
line.
7
Paraphrase This Document
Need a fresh take? Get an instant paraphrase of this document with our AI Paraphraser
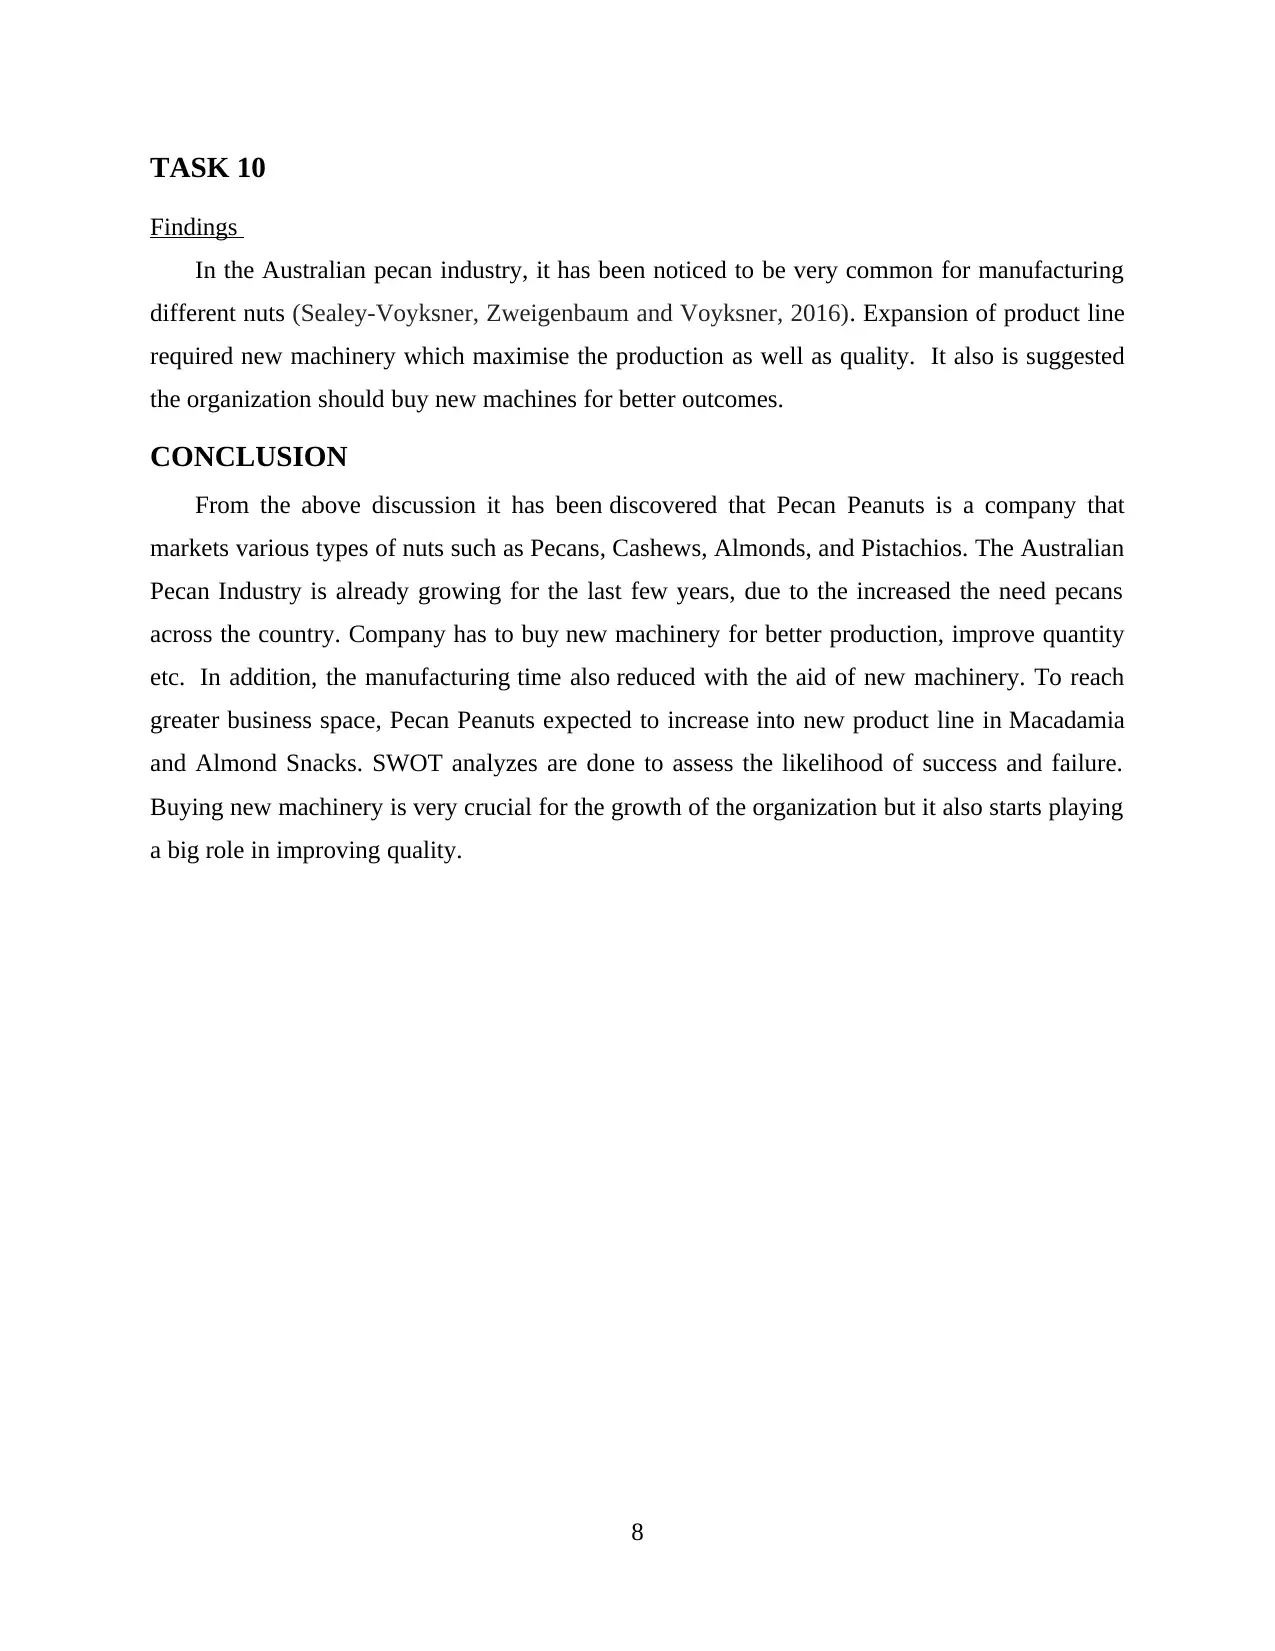
TASK 10
Findings
In the Australian pecan industry, it has been noticed to be very common for manufacturing
different nuts (Sealey-Voyksner, Zweigenbaum and Voyksner, 2016). Expansion of product line
required new machinery which maximise the production as well as quality. It also is suggested
the organization should buy new machines for better outcomes.
CONCLUSION
From the above discussion it has been discovered that Pecan Peanuts is a company that
markets various types of nuts such as Pecans, Cashews, Almonds, and Pistachios. The Australian
Pecan Industry is already growing for the last few years, due to the increased the need pecans
across the country. Company has to buy new machinery for better production, improve quantity
etc. In addition, the manufacturing time also reduced with the aid of new machinery. To reach
greater business space, Pecan Peanuts expected to increase into new product line in Macadamia
and Almond Snacks. SWOT analyzes are done to assess the likelihood of success and failure.
Buying new machinery is very crucial for the growth of the organization but it also starts playing
a big role in improving quality.
8
REFERENCES
Books & Journals
Brar, P. K., Strawn, L. K. and Danyluk, M. D., 2016. Prevalence, level, and types of Salmonella
isolated from North American in-shell pecans over four harvest years. Journal of food
protection. 79(3). pp.352-360.
Bolling, B. W., 2017. Almond polyphenols: methods of analysis, contribution to food quality,
and health promotion. Comprehensive Reviews in Food Science and Food Safety. 16(3).
pp.346-368.
Brar, P. K. and Danyluk, M. D., 2019. Validation of Enterococcus faecium as a surrogate for
Salmonella under different processing conditions for peanuts and pecans. Food
microbiology. 80. pp.9-17.
Cunha, S. C., Sa, S. V. and Fernandes, J. O., 2018. Multiple mycotoxin analysis in nut products:
Occurrence and risk characterization. Food and Chemical Toxicology. 114. pp.260-269.
Dean, L. L., 2018. Targeted and Non‐Targeted Analyses of Secondary Metabolites in Nut and
Seed Processing. European Journal of Lipid Science and Technology. 120(11).
p.1700479.
Cheng, G., Dharmasena, S. and Capps Jr, O., 2017. The Taste for Variety: Demand Analysis for
Nut Products in the United States (No. 1377-2016-109921).
Jiang, S., Wang, J. and Sun, Y., 2017. Qualitative and quantitative analysis of fatty acid profiles
of Chinese pecans (Carya cathayensis) during storage using an electronic nose combined
with chemometric methods. RSC advances. 7(73). pp.46461-46471.
Sealey-Voyksner, J., Zweigenbaum, J. and Voyksner, R., 2016. Discovery of highly conserved
unique peanut and tree nut peptides by LC–MS/MS for multi-allergen detection. Food
chemistry. 194. pp.201-211.
Atanasov, A. G. and et.al., 2018. Pecan nuts: A review of reported bioactivities and health
effects. Trends in food science & technology, 71, pp.246-257.
Brar, P. K. and Danyluk, M. D., 2019. Validation of Enterococcus faecium as a surrogate for
Salmonella under different processing conditions for peanuts and pecans. Food
microbiology, 80, pp.9-17.
Cetinkaya, P. G. and et.al., 2020. Phenotypical characterization of tree nuts and peanut allergies
in east Mediterranean children. Allergologia et immunopathologia, 48(4), pp.316-322.
Dean, L. L., 2018. Targeted and Non‐Targeted Analyses of Secondary Metabolites in Nut and
Seed Processing. European Journal of Lipid Science and Technology, 120(11),
p.1700479.
Mustafa, S. S. and et.al., 2020. Real-world tree nut consumption in peanut-allergic
individuals. Annals of Allergy, Asthma & Immunology, 124(3), pp.277-282.
Prestes, F. S. and et.al., 2019. Impact of peanut roasting on Salmonella spp. survival. LWT, 108,
pp.168-173.
Zazycki, M. A. and et.al., 2018. New biochar from pecan nutshells as an alternative adsorbent for
removing reactive red 141 from aqueous solutions. Journal of Cleaner Production, 171,
pp.57-65.
9
⊘ This is a preview!⊘
Do you want full access?
Subscribe today to unlock all pages.
Trusted by 1+ million students worldwide
1 out of 15
Related Documents


Your All-in-One AI-Powered Toolkit for Academic Success.
+13062052269
info@desklib.com
Available 24*7 on WhatsApp / Email
![[object Object]](/_next/static/media/star-bottom.7253800d.svg)
Unlock your academic potential
Copyright © 2020–2026 A2Z Services. All Rights Reserved. Developed and managed by ZUCOL.