Analysis of the Australian Pecan Peanuts Business: A Report
VerifiedAdded on 2022/12/09
|14
|2844
|271
Report
AI Summary
This report provides a comprehensive analysis of the Australian pecan peanuts business, covering various aspects of the industry. It begins with an overview of the Australian pecan industry, discussing production areas, expansion potential, and market value. The report then presents a linear forecast of export productions for 2021 and 2022, followed by a discussion of health issues related to pecan peanuts and other nuts. Quality assurance conditions for machine working are examined, including the five elements of quality control. The report also analyzes the costs of a new machine, including a payback period calculation. Hypothesis testing is performed to compare two machines, followed by a pros and cons analysis to determine whether to purchase a new machine. Customer satisfaction is assessed through data analysis, and an initial SWOT analysis of the pecan industry's expansion is provided. The report concludes with a summary of the key findings.
2000 words
Pecan Peanuts
Business Report
Pecan Peanuts
Business Report
Paraphrase This Document
Need a fresh take? Get an instant paraphrase of this document with our AI Paraphraser
Introduction
The file is about pecan peanuts and the industry in Australia. Pecan is a tree which is found in
Australia and is famous for its peanuts worldwide. The file discusses about the overview of
Australian Pecan industry, gives a linear forecast of export productions for 2021 and 2022.
The health issues in the peanuts market have been discussed. The quality assurance
conditions for machine working has been provided. The costs of buying new machine and the
hypothesis along with the pros and cons have been discussed. The customer satisfaction has
been depicted and a SWOT analysis of the industry has been done.
1.1 An Overview of the Australian Pecan Industry
Overview of Australian pecan industry
Overview of Australian pecan industry
Speaking of the production areas, the majority of the pecan crop is produced through
irrigation in Gwydir valley in Australia. Small scale production is present in some parts of the
country with pecans grown in Central Queensland and in the south eastern parts. The industry
has potential to expand with farms and orchards expanding. Trawalla farm has been biggest
orchard in Australia which produces pecans on a large scale, also there are a number of new
orchards coming up with recent plantations and which are bound to increase production in the
upcoming few years. The Australian nut industry had reached a record high in 2018-19 and
according to Herron Todd White, industry has been experiencing a large expansion speaking
of the decade, where industry value is divided on equal basis between domestic and product
imported (Takadi, 2017). The Australian nut exports stand currently to 55 countries around,
with a new free trade agreements which are in negotiation currently and which can bring
further optimism to all industry facets. The majority of the industry is located in New South
Wales and queensland. There are more than 100 pecan growers in Australia with around
1,80,000 trees being planted (Nadler, Chen and Lu, 2017). The Australian pecan growers
association which produce 95% nuts approximately contribute to a major part of production
in the country. The pecan production has been valued around 3000 tonnes since 2006 (Ross
and Council, 2017). A strong expansion in the industry and the production is set to increase
by 9500 tonnes by 2025.
1.2 Linear Forecast of Export Productions for 2021 and
2022
Linear forecast of export productions for 2021 and 2022
In shell production-Metric tons
Particulars 2021
Beginning stock 200
Crop 3524
Total Supply 3724
Ending stock 0
Kernel basis-Metric tons
Particulars 2021
Beginning stock 104
Crop 1832
Total supply 1936
Ending stock 0
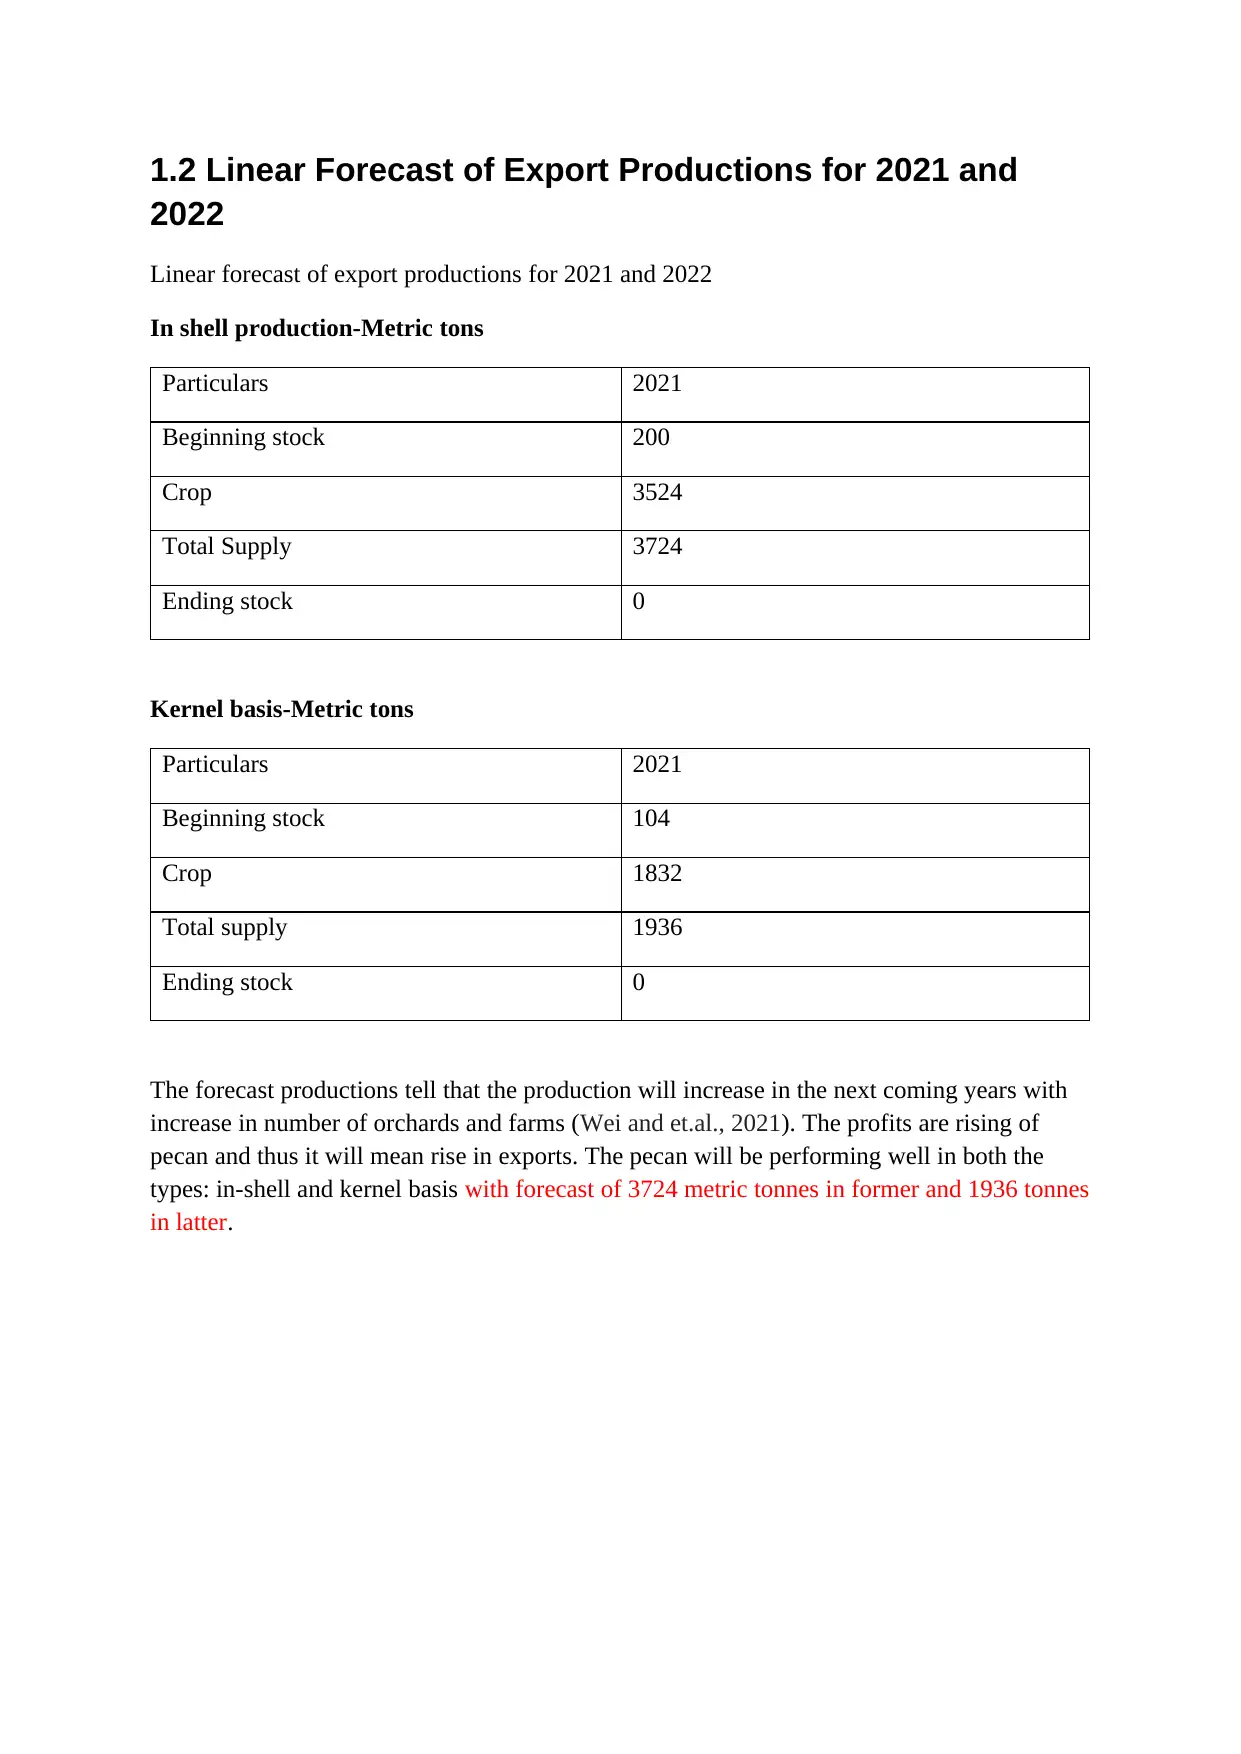
The forecast productions tell that the production will increase in the next coming years with
increase in number of orchards and farms (Wei and et.al., 2021). The profits are rising of
pecan and thus it will mean rise in exports. The pecan will be performing well in both the
types: in-shell and kernel basis with forecast of 3724 metric tonnes in former and 1936 tonnes
in latter.
2022
Linear forecast of export productions for 2021 and 2022
In shell production-Metric tons
Particulars 2021
Beginning stock 200
Crop 3524
Total Supply 3724
Ending stock 0
Kernel basis-Metric tons
Particulars 2021
Beginning stock 104
Crop 1832
Total supply 1936
Ending stock 0
The forecast productions tell that the production will increase in the next coming years with
increase in number of orchards and farms (Wei and et.al., 2021). The profits are rising of
pecan and thus it will mean rise in exports. The pecan will be performing well in both the
types: in-shell and kernel basis with forecast of 3724 metric tonnes in former and 1936 tonnes
in latter.
⊘ This is a preview!⊘
Do you want full access?
Subscribe today to unlock all pages.
Trusted by 1+ million students worldwide
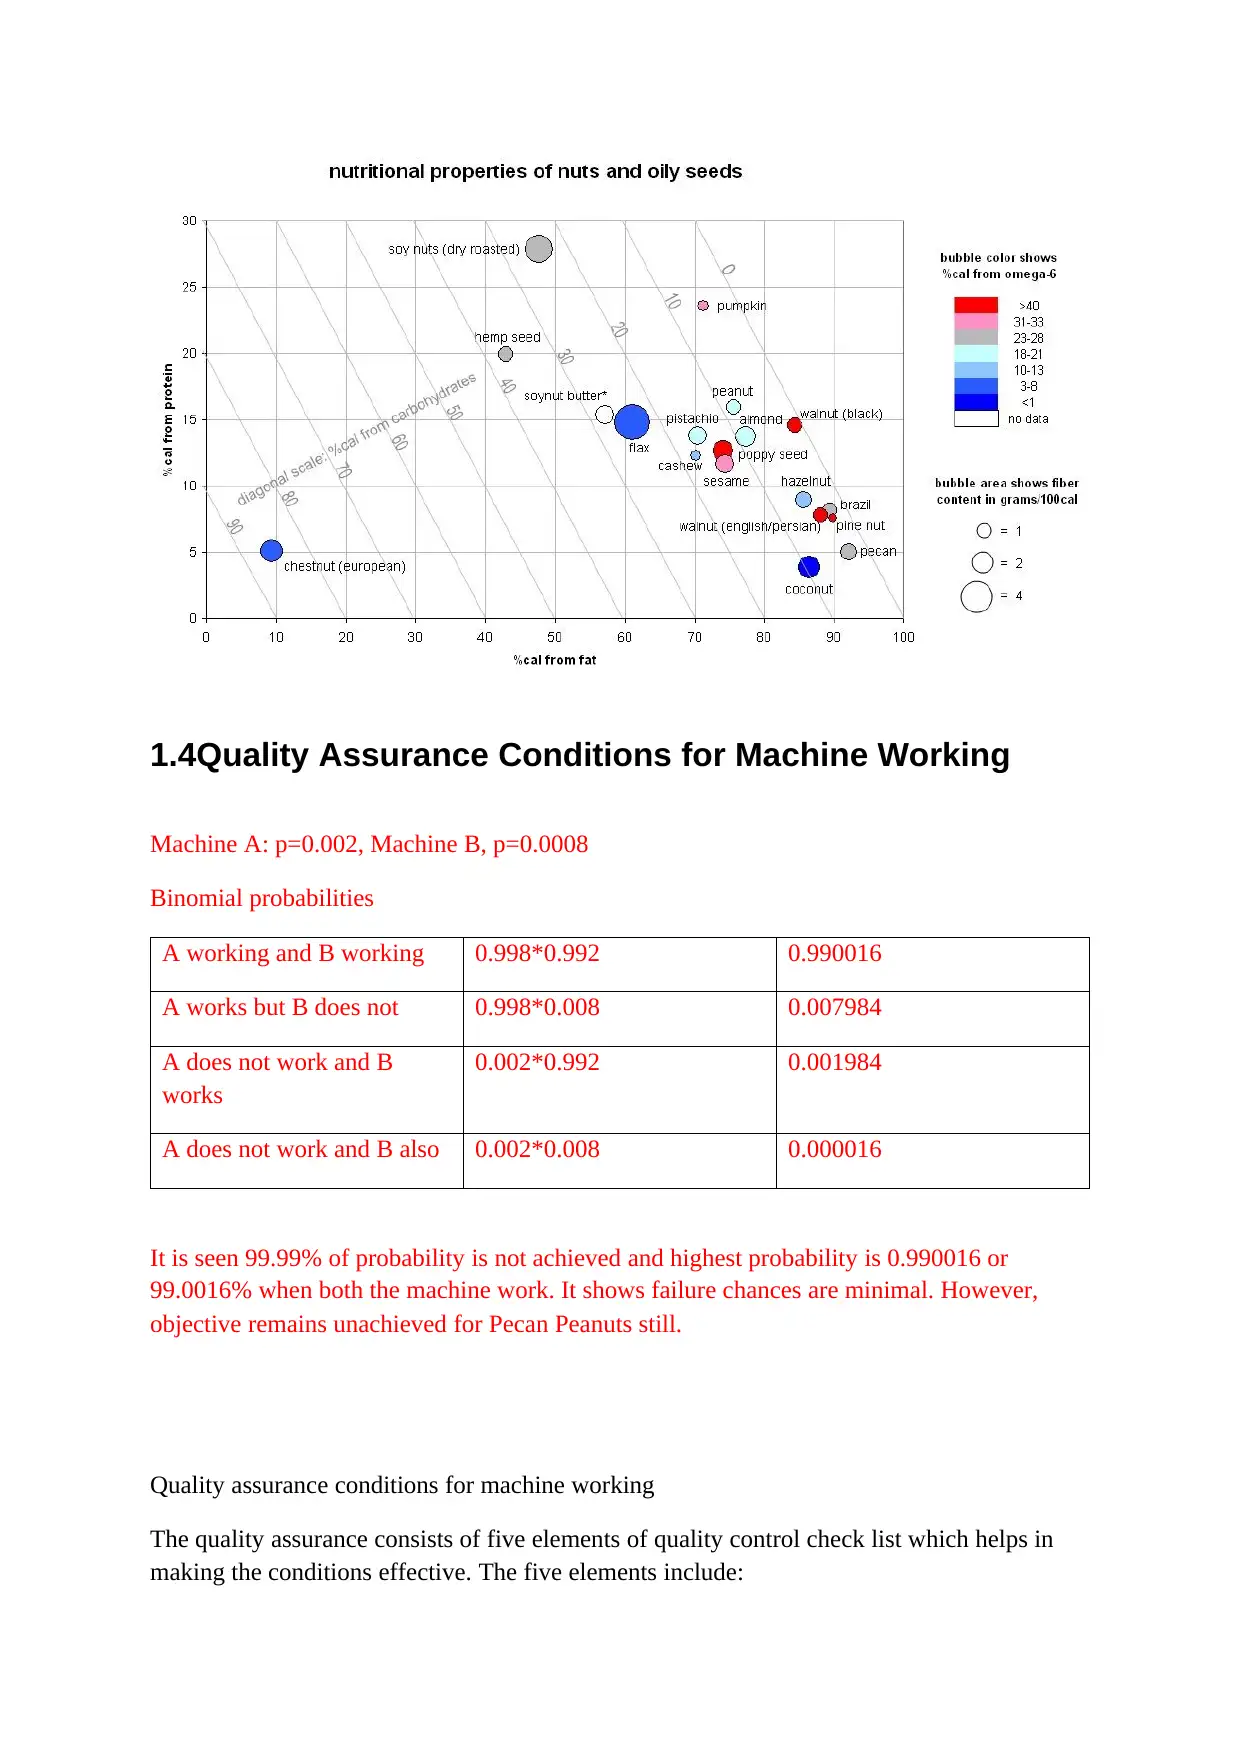
1.3Health Issues in the Pecan, Peanut, Cashew and
Pistachio Market
Health issues of nuts
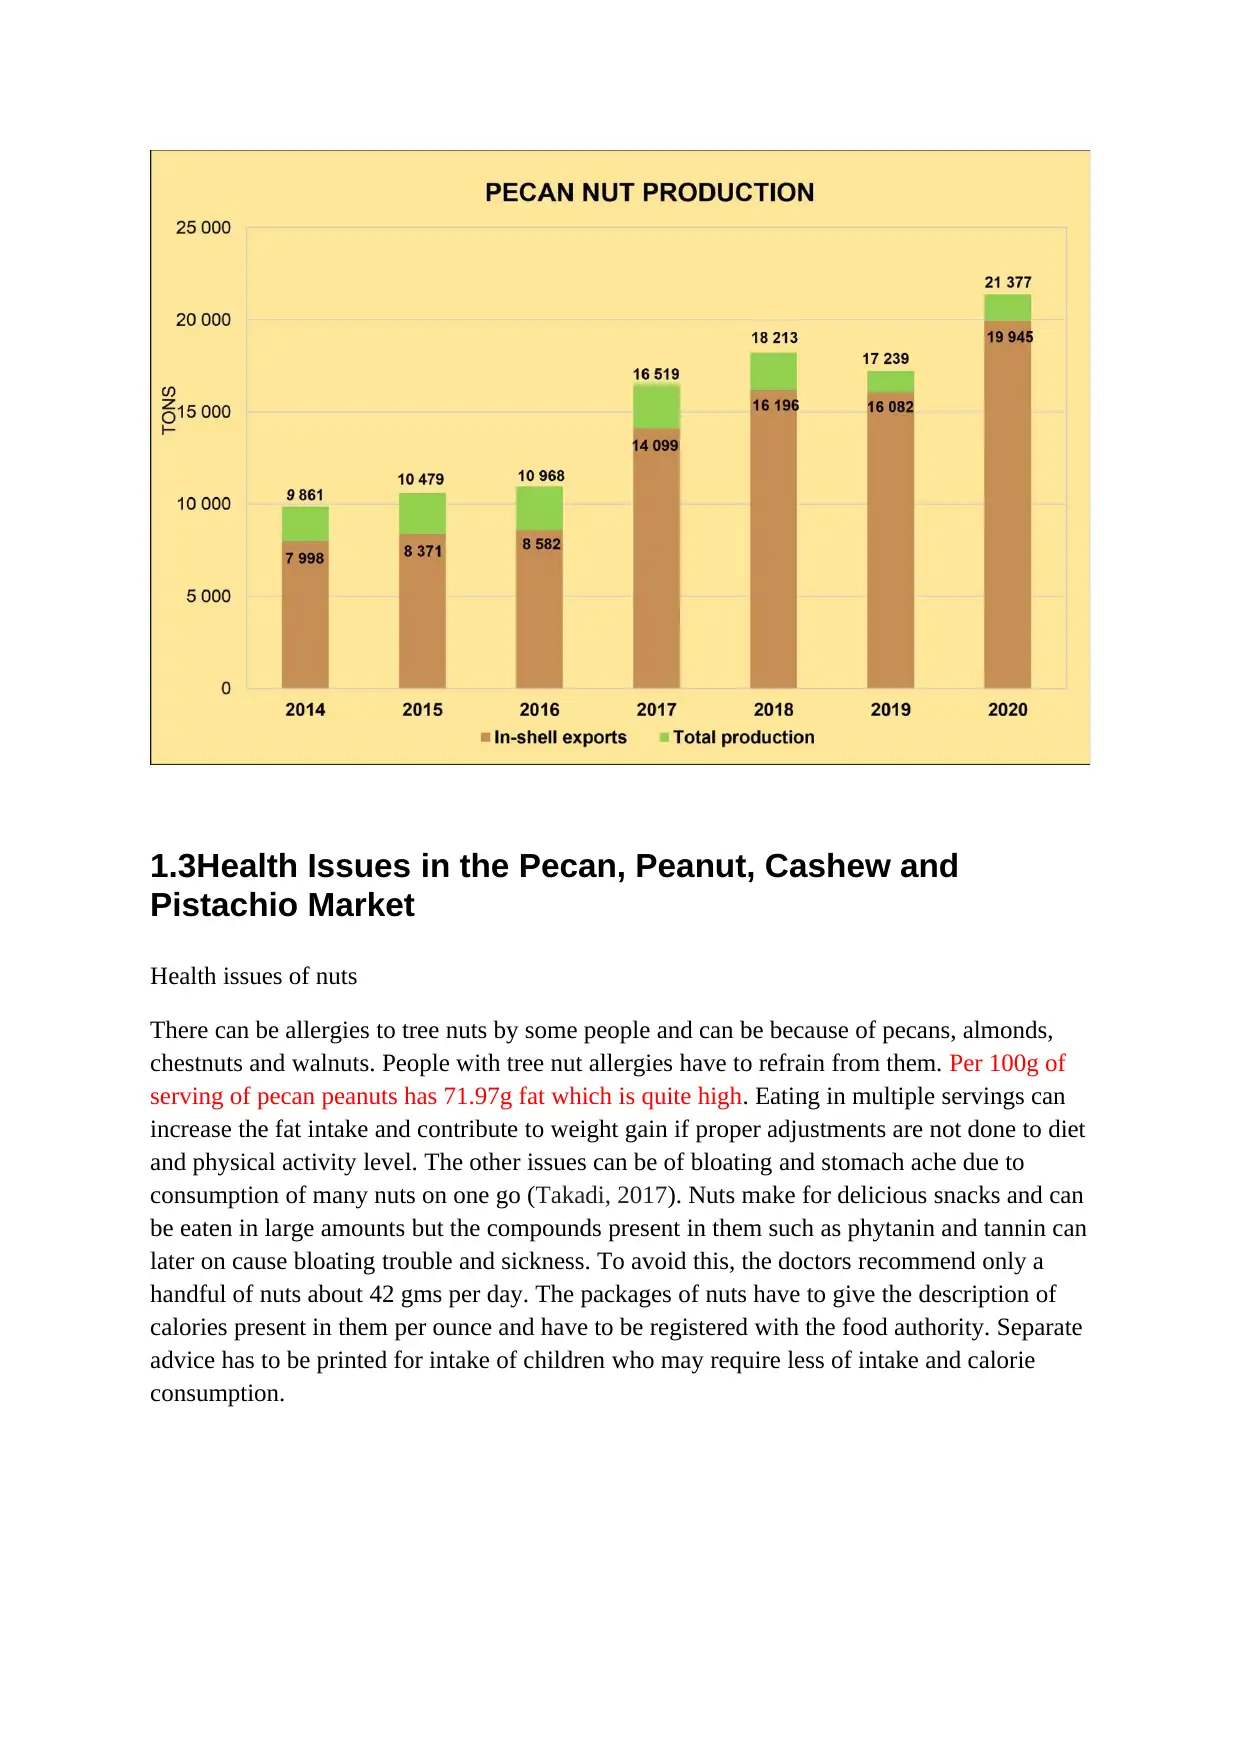
There can be allergies to tree nuts by some people and can be because of pecans, almonds,
chestnuts and walnuts. People with tree nut allergies have to refrain from them. Per 100g of
serving of pecan peanuts has 71.97g fat which is quite high. Eating in multiple servings can
increase the fat intake and contribute to weight gain if proper adjustments are not done to diet
and physical activity level. The other issues can be of bloating and stomach ache due to
consumption of many nuts on one go (Takadi, 2017). Nuts make for delicious snacks and can
be eaten in large amounts but the compounds present in them such as phytanin and tannin can
later on cause bloating trouble and sickness. To avoid this, the doctors recommend only a
handful of nuts about 42 gms per day. The packages of nuts have to give the description of
calories present in them per ounce and have to be registered with the food authority. Separate
advice has to be printed for intake of children who may require less of intake and calorie
consumption.
Pistachio Market
Health issues of nuts
There can be allergies to tree nuts by some people and can be because of pecans, almonds,
chestnuts and walnuts. People with tree nut allergies have to refrain from them. Per 100g of
serving of pecan peanuts has 71.97g fat which is quite high. Eating in multiple servings can
increase the fat intake and contribute to weight gain if proper adjustments are not done to diet
and physical activity level. The other issues can be of bloating and stomach ache due to
consumption of many nuts on one go (Takadi, 2017). Nuts make for delicious snacks and can
be eaten in large amounts but the compounds present in them such as phytanin and tannin can
later on cause bloating trouble and sickness. To avoid this, the doctors recommend only a
handful of nuts about 42 gms per day. The packages of nuts have to give the description of
calories present in them per ounce and have to be registered with the food authority. Separate
advice has to be printed for intake of children who may require less of intake and calorie
consumption.
Paraphrase This Document
Need a fresh take? Get an instant paraphrase of this document with our AI Paraphraser
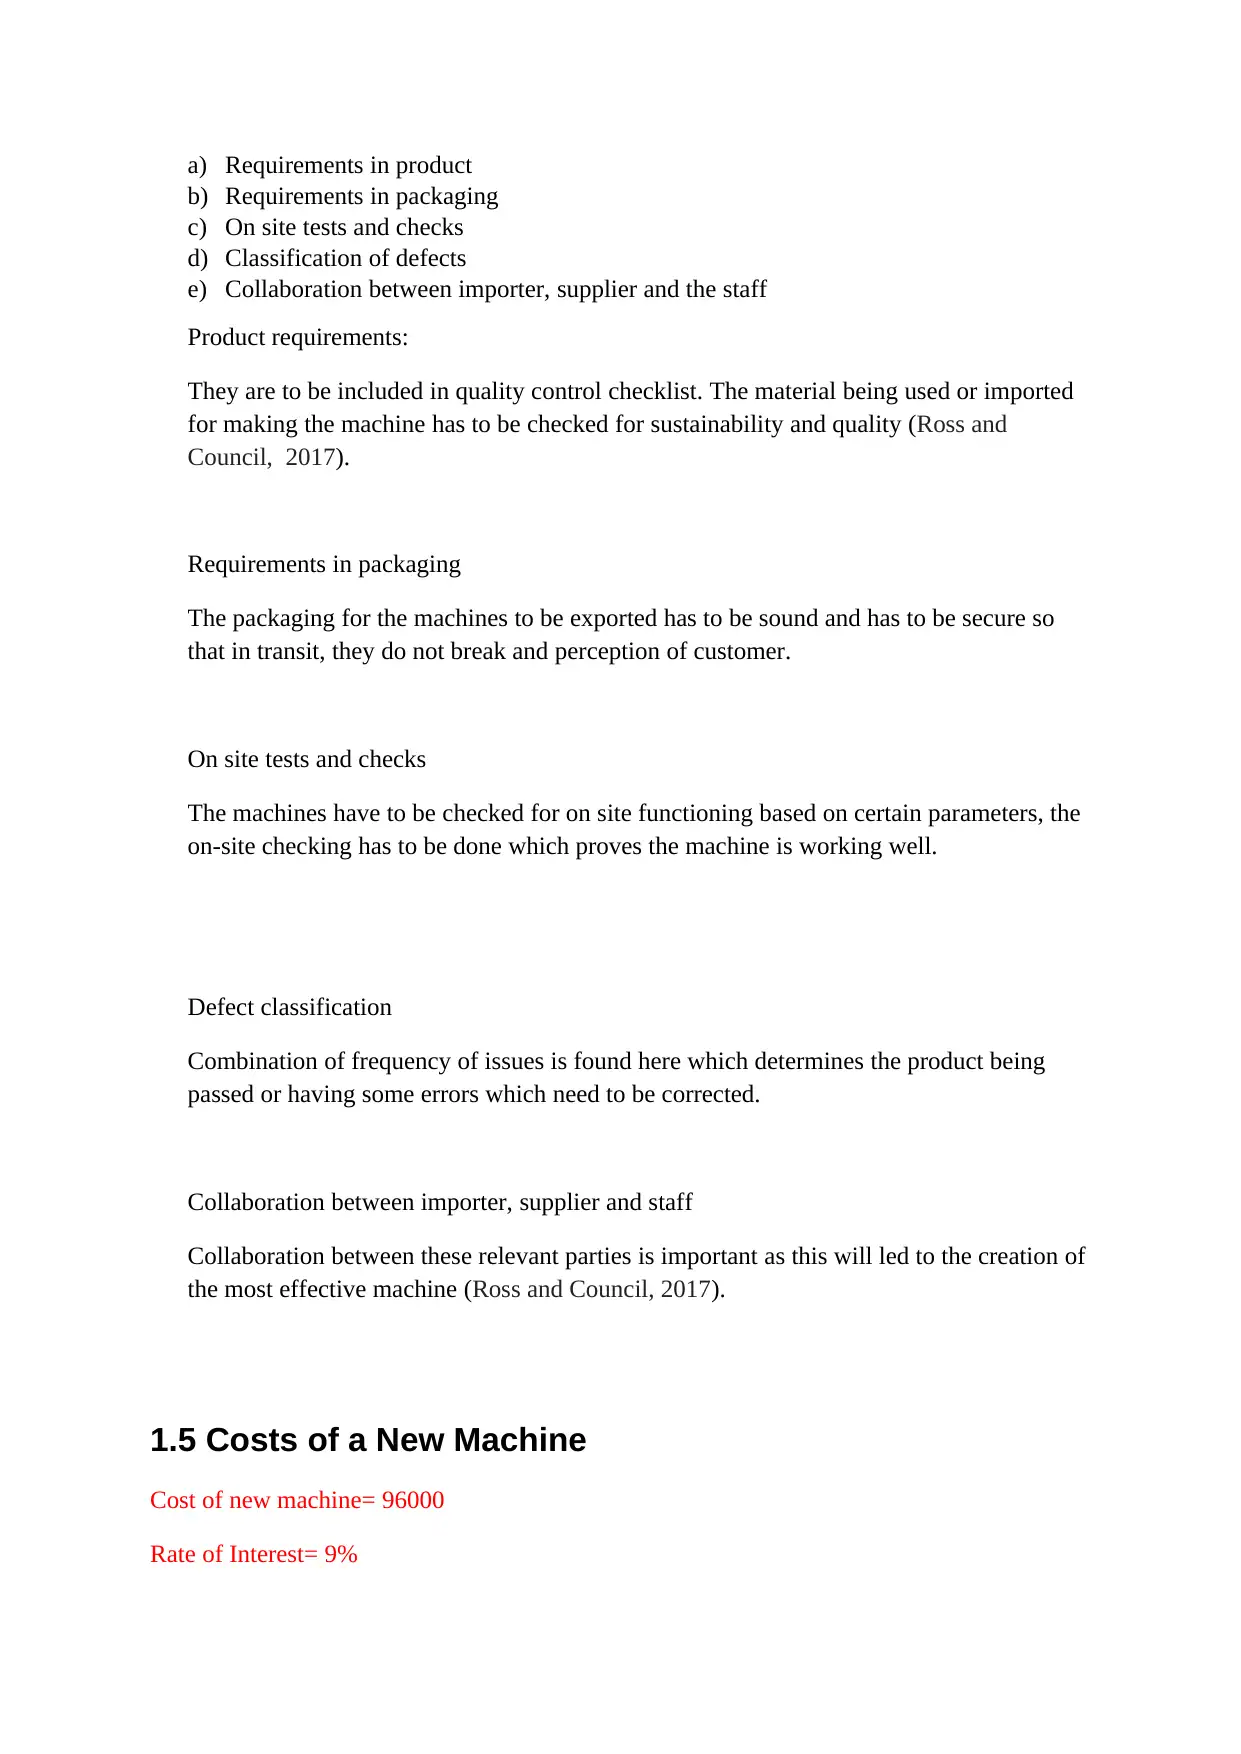
1.4Quality Assurance Conditions for Machine Working
Machine A: p=0.002, Machine B, p=0.0008
Binomial probabilities
A working and B working 0.998*0.992 0.990016
A works but B does not 0.998*0.008 0.007984
A does not work and B
works
0.002*0.992 0.001984
A does not work and B also 0.002*0.008 0.000016
It is seen 99.99% of probability is not achieved and highest probability is 0.990016 or
99.0016% when both the machine work. It shows failure chances are minimal. However,
objective remains unachieved for Pecan Peanuts still.
Quality assurance conditions for machine working
The quality assurance consists of five elements of quality control check list which helps in
making the conditions effective. The five elements include:
a) Requirements in product
b) Requirements in packaging
c) On site tests and checks
d) Classification of defects
e) Collaboration between importer, supplier and the staff
Product requirements:
They are to be included in quality control checklist. The material being used or imported
for making the machine has to be checked for sustainability and quality (Ross and
Council, 2017).
Requirements in packaging
The packaging for the machines to be exported has to be sound and has to be secure so
that in transit, they do not break and perception of customer.
On site tests and checks
The machines have to be checked for on site functioning based on certain parameters, the
on-site checking has to be done which proves the machine is working well.
Defect classification
Combination of frequency of issues is found here which determines the product being
passed or having some errors which need to be corrected.
Collaboration between importer, supplier and staff
Collaboration between these relevant parties is important as this will led to the creation of
the most effective machine (Ross and Council, 2017).
1.5 Costs of a New Machine
Cost of new machine= 96000
Rate of Interest= 9%
⊘ This is a preview!⊘
Do you want full access?
Subscribe today to unlock all pages.
Trusted by 1+ million students worldwide
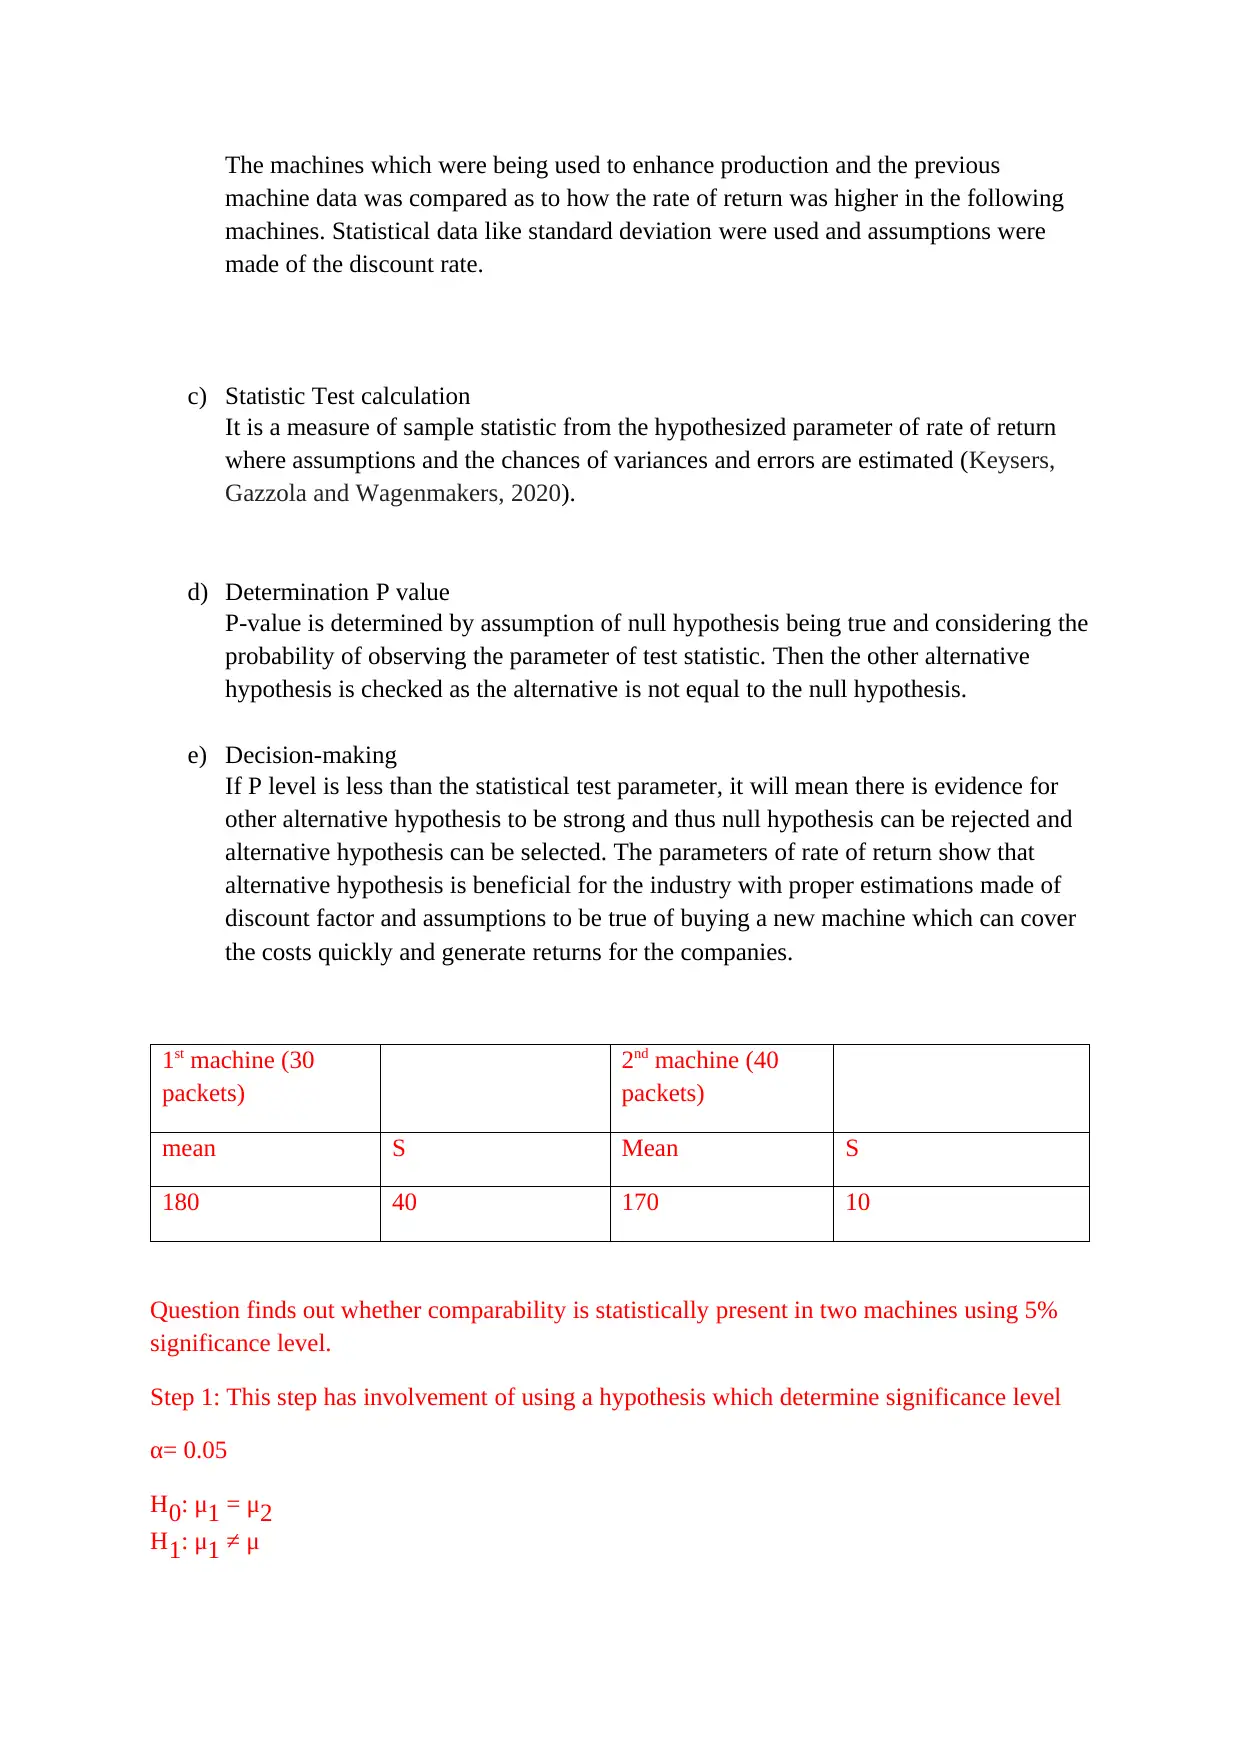
Company can make payment of 2000 GBP per month.
Year Payment Remaining Balance Remaining Balance
plus interest
1 24000 72000 78480
2 24000 54480 59383.2
3 24000 35383.20 38567.70
4 24000 14567.70 15441.70
5 15441.70 0 0
Total time= 56
months
Balance is divided by 2000 to get the time period for payment, that is 15441.7/2000=8
months.
Thus, total time for payback is 4 years and 8 months.
1.6 Hypothesis Testing for the Possible Difference in Two
Machines
Hypothesis testing
The steps to perform hypothesis testing go in a structural manner with firstly identifying
the problem and then the steps to solve the problem. The problem can be identified as
selecting the best machine. There is a difference of opinion whether industry should
continue with the same previous machine or incur additional costs to purchase a new one.
The steps are as follows:
a) Determining a null and alternative hypothesis:
Null hypothesis can be there would be no difference in employing a new machine.
Alternative hypothesis is that there is difference between profits generated in a long
term by use of new machine.
b) Data examining and assumption checking
Paraphrase This Document
Need a fresh take? Get an instant paraphrase of this document with our AI Paraphraser
The machines which were being used to enhance production and the previous
machine data was compared as to how the rate of return was higher in the following
machines. Statistical data like standard deviation were used and assumptions were
made of the discount rate.
c) Statistic Test calculation
It is a measure of sample statistic from the hypothesized parameter of rate of return
where assumptions and the chances of variances and errors are estimated (Keysers,
Gazzola and Wagenmakers, 2020).
d) Determination P value
P-value is determined by assumption of null hypothesis being true and considering the
probability of observing the parameter of test statistic. Then the other alternative
hypothesis is checked as the alternative is not equal to the null hypothesis.
e) Decision-making
If P level is less than the statistical test parameter, it will mean there is evidence for
other alternative hypothesis to be strong and thus null hypothesis can be rejected and
alternative hypothesis can be selected. The parameters of rate of return show that
alternative hypothesis is beneficial for the industry with proper estimations made of
discount factor and assumptions to be true of buying a new machine which can cover
the costs quickly and generate returns for the companies.
1st machine (30
packets)
2nd machine (40
packets)
mean S Mean S
180 40 170 10
Question finds out whether comparability is statistically present in two machines using 5%
significance level.
Step 1: This step has involvement of using a hypothesis which determine significance level
α= 0.05
H0: μ1 = μ2
H1: μ1 ≠ μ
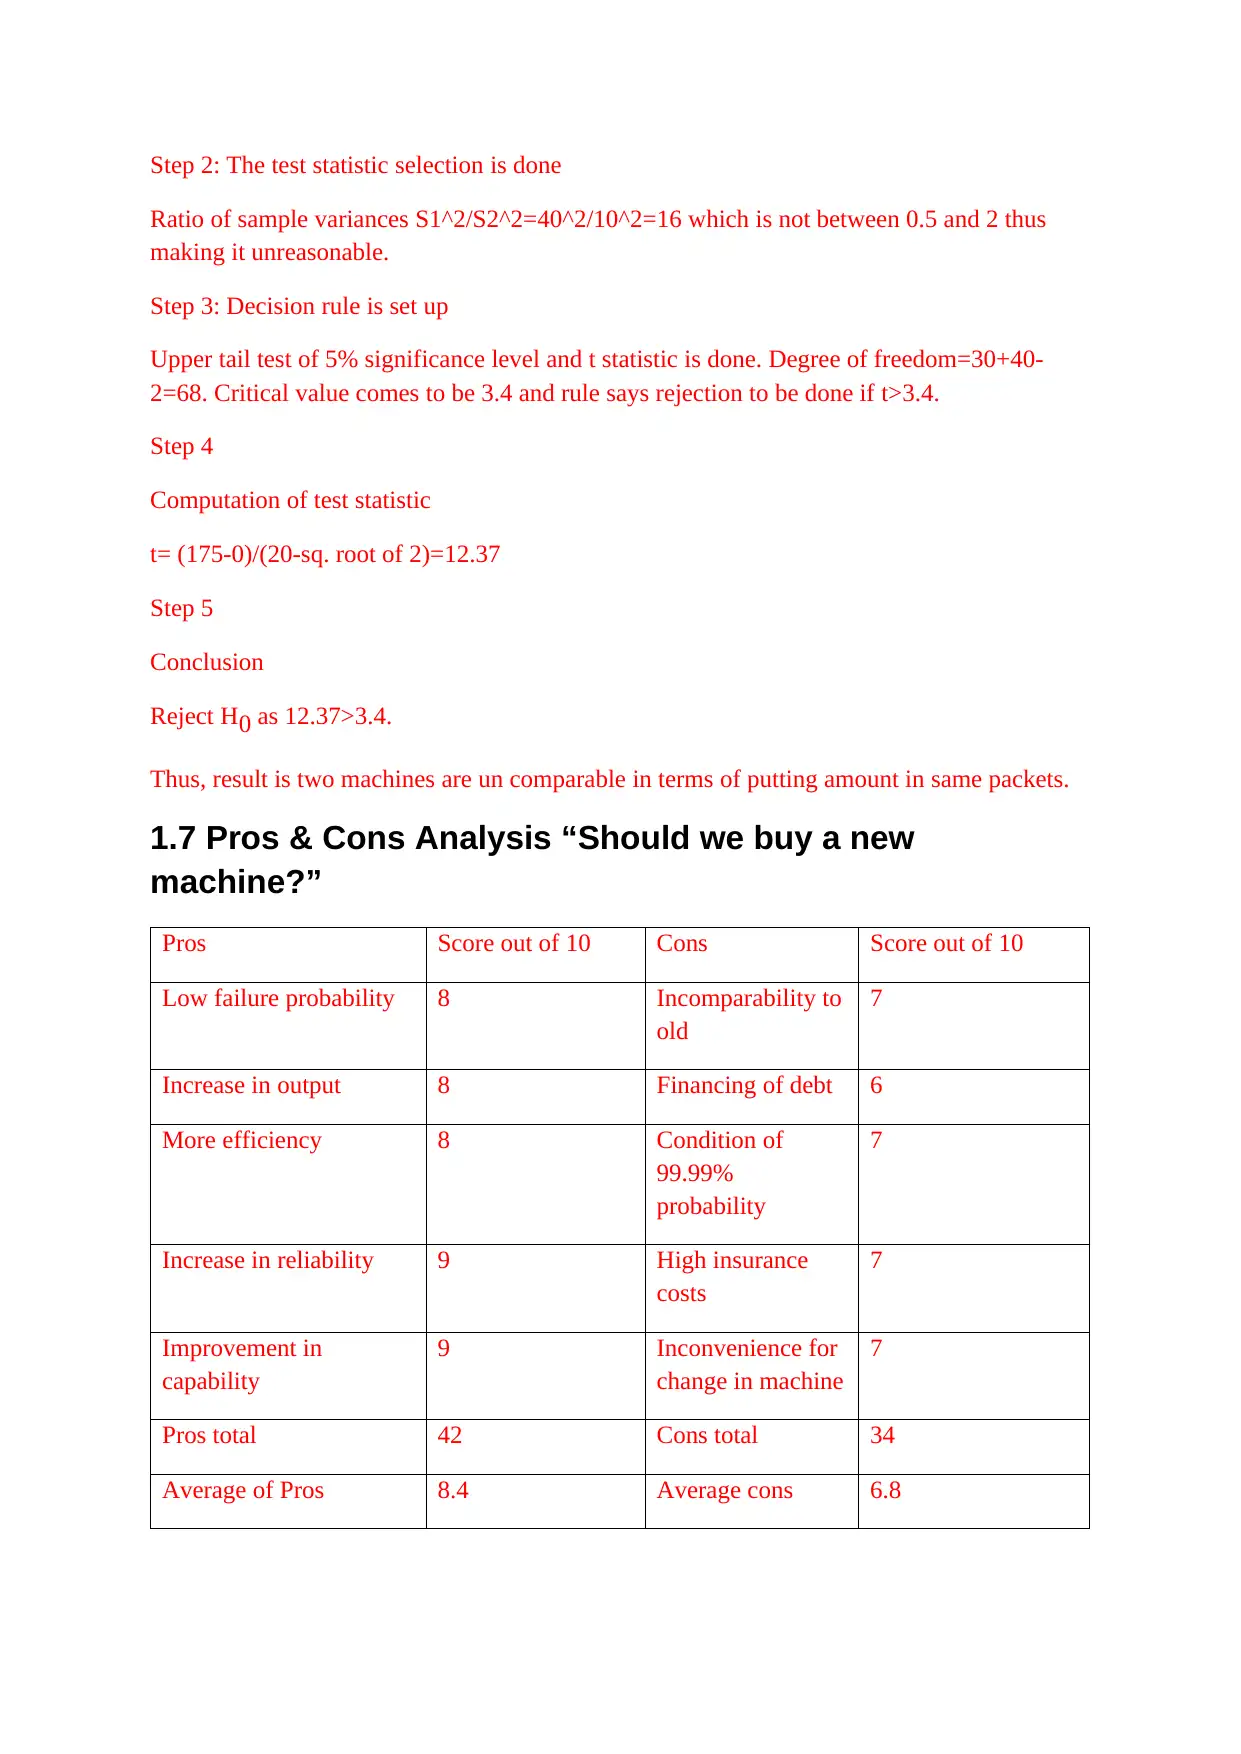
Step 2: The test statistic selection is done
Ratio of sample variances S1^2/S2^2=40^2/10^2=16 which is not between 0.5 and 2 thus
making it unreasonable.
Step 3: Decision rule is set up
Upper tail test of 5% significance level and t statistic is done. Degree of freedom=30+40-
2=68. Critical value comes to be 3.4 and rule says rejection to be done if t>3.4.
Step 4
Computation of test statistic
t= (175-0)/(20-sq. root of 2)=12.37
Step 5
Conclusion
Reject H0 as 12.37>3.4.
Thus, result is two machines are un comparable in terms of putting amount in same packets.
1.7 Pros & Cons Analysis “Should we buy a new
machine?”
Pros Score out of 10 Cons Score out of 10
Low failure probability 8 Incomparability to
old
7
Increase in output 8 Financing of debt 6
More efficiency 8 Condition of
99.99%
probability
7
Increase in reliability 9 High insurance
costs
7
Improvement in
capability
9 Inconvenience for
change in machine
7
Pros total 42 Cons total 34
Average of Pros 8.4 Average cons 6.8
⊘ This is a preview!⊘
Do you want full access?
Subscribe today to unlock all pages.
Trusted by 1+ million students worldwide
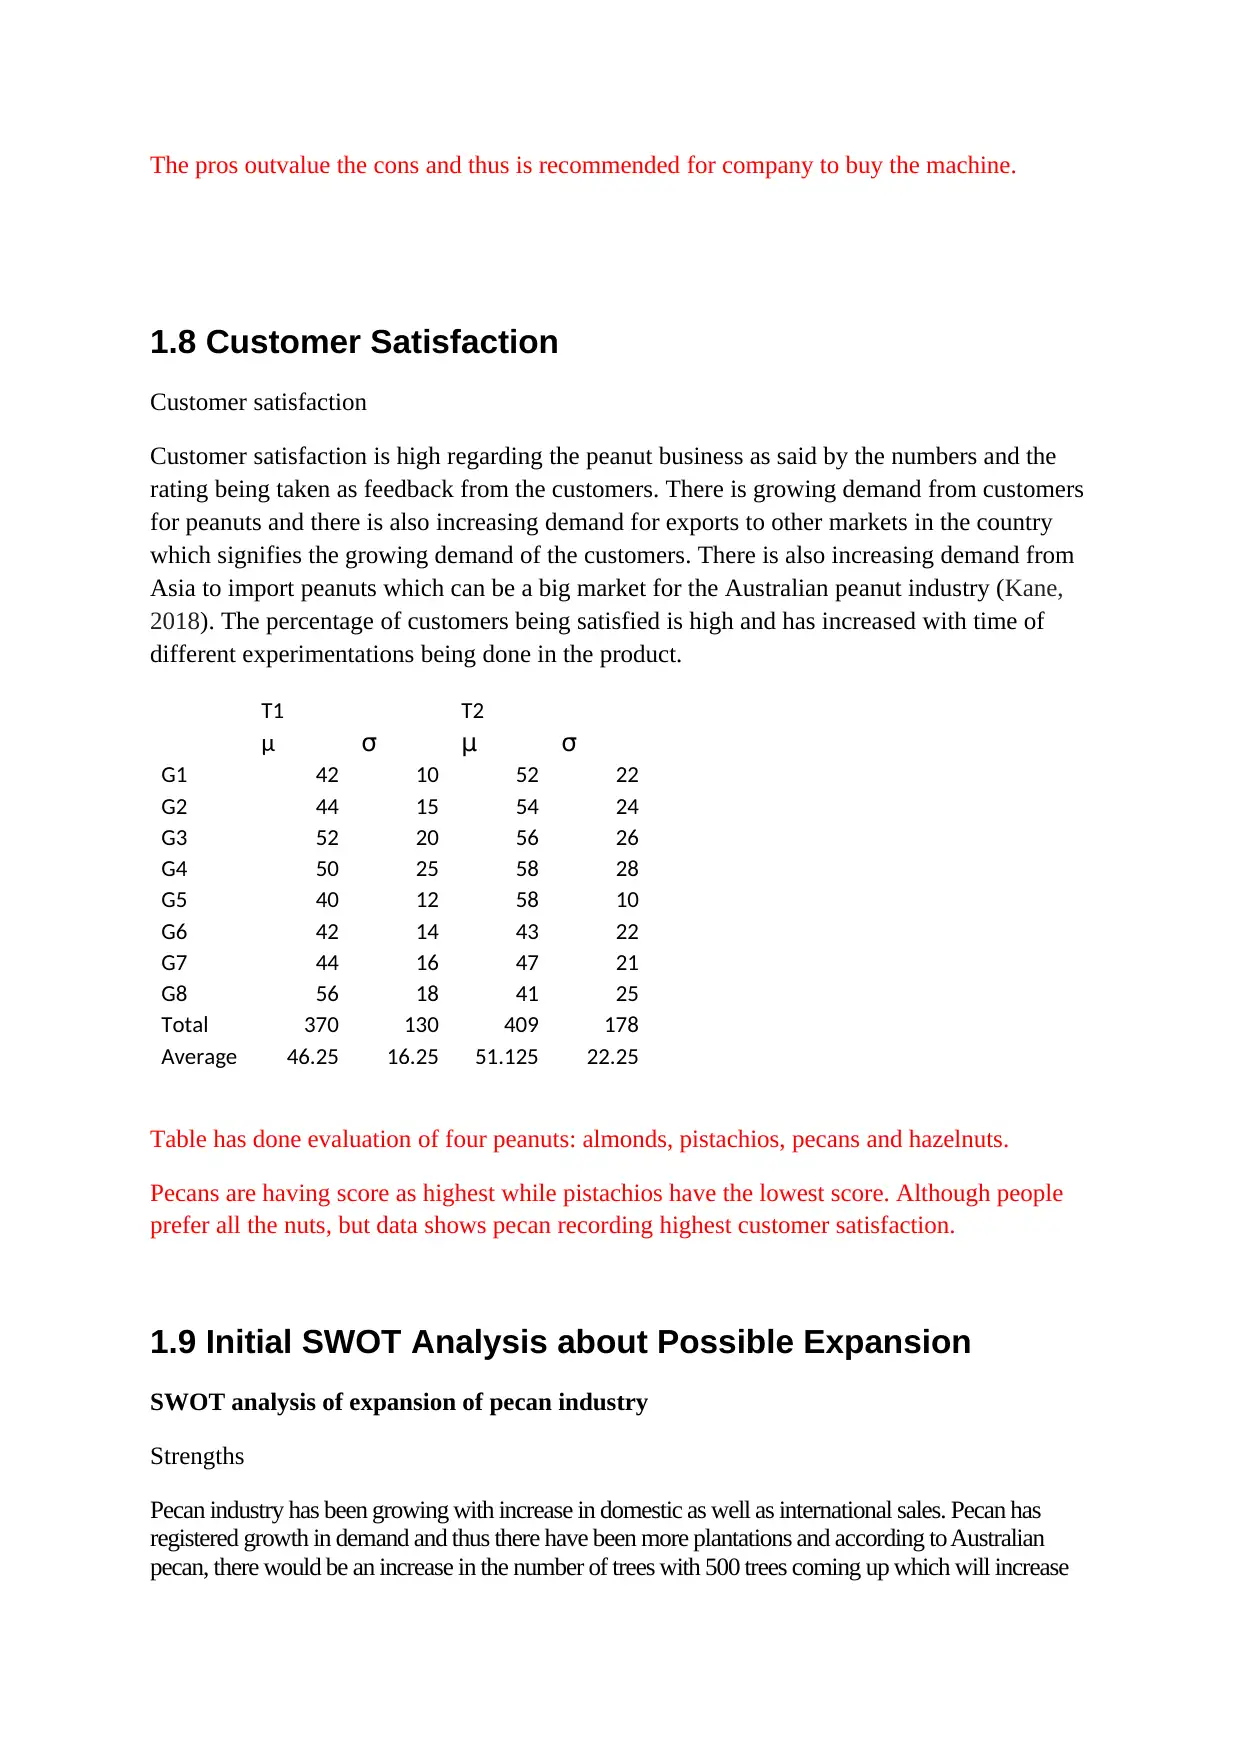
The pros outvalue the cons and thus is recommended for company to buy the machine.
1.8 Customer Satisfaction
Customer satisfaction
Customer satisfaction is high regarding the peanut business as said by the numbers and the
rating being taken as feedback from the customers. There is growing demand from customers
for peanuts and there is also increasing demand for exports to other markets in the country
which signifies the growing demand of the customers. There is also increasing demand from
Asia to import peanuts which can be a big market for the Australian peanut industry (Kane,
2018). The percentage of customers being satisfied is high and has increased with time of
different experimentations being done in the product.
T1 T2
μ σ μ σ
G1 42 10 52 22
G2 44 15 54 24
G3 52 20 56 26
G4 50 25 58 28
G5 40 12 58 10
G6 42 14 43 22
G7 44 16 47 21
G8 56 18 41 25
Total 370 130 409 178
Average 46.25 16.25 51.125 22.25
Table has done evaluation of four peanuts: almonds, pistachios, pecans and hazelnuts.
Pecans are having score as highest while pistachios have the lowest score. Although people
prefer all the nuts, but data shows pecan recording highest customer satisfaction.
1.9 Initial SWOT Analysis about Possible Expansion
SWOT analysis of expansion of pecan industry
Strengths
Pecan industry has been growing with increase in domestic as well as international sales. Pecan has
registered growth in demand and thus there have been more plantations and according to Australian
pecan, there would be an increase in the number of trees with 500 trees coming up which will increase
Paraphrase This Document
Need a fresh take? Get an instant paraphrase of this document with our AI Paraphraser
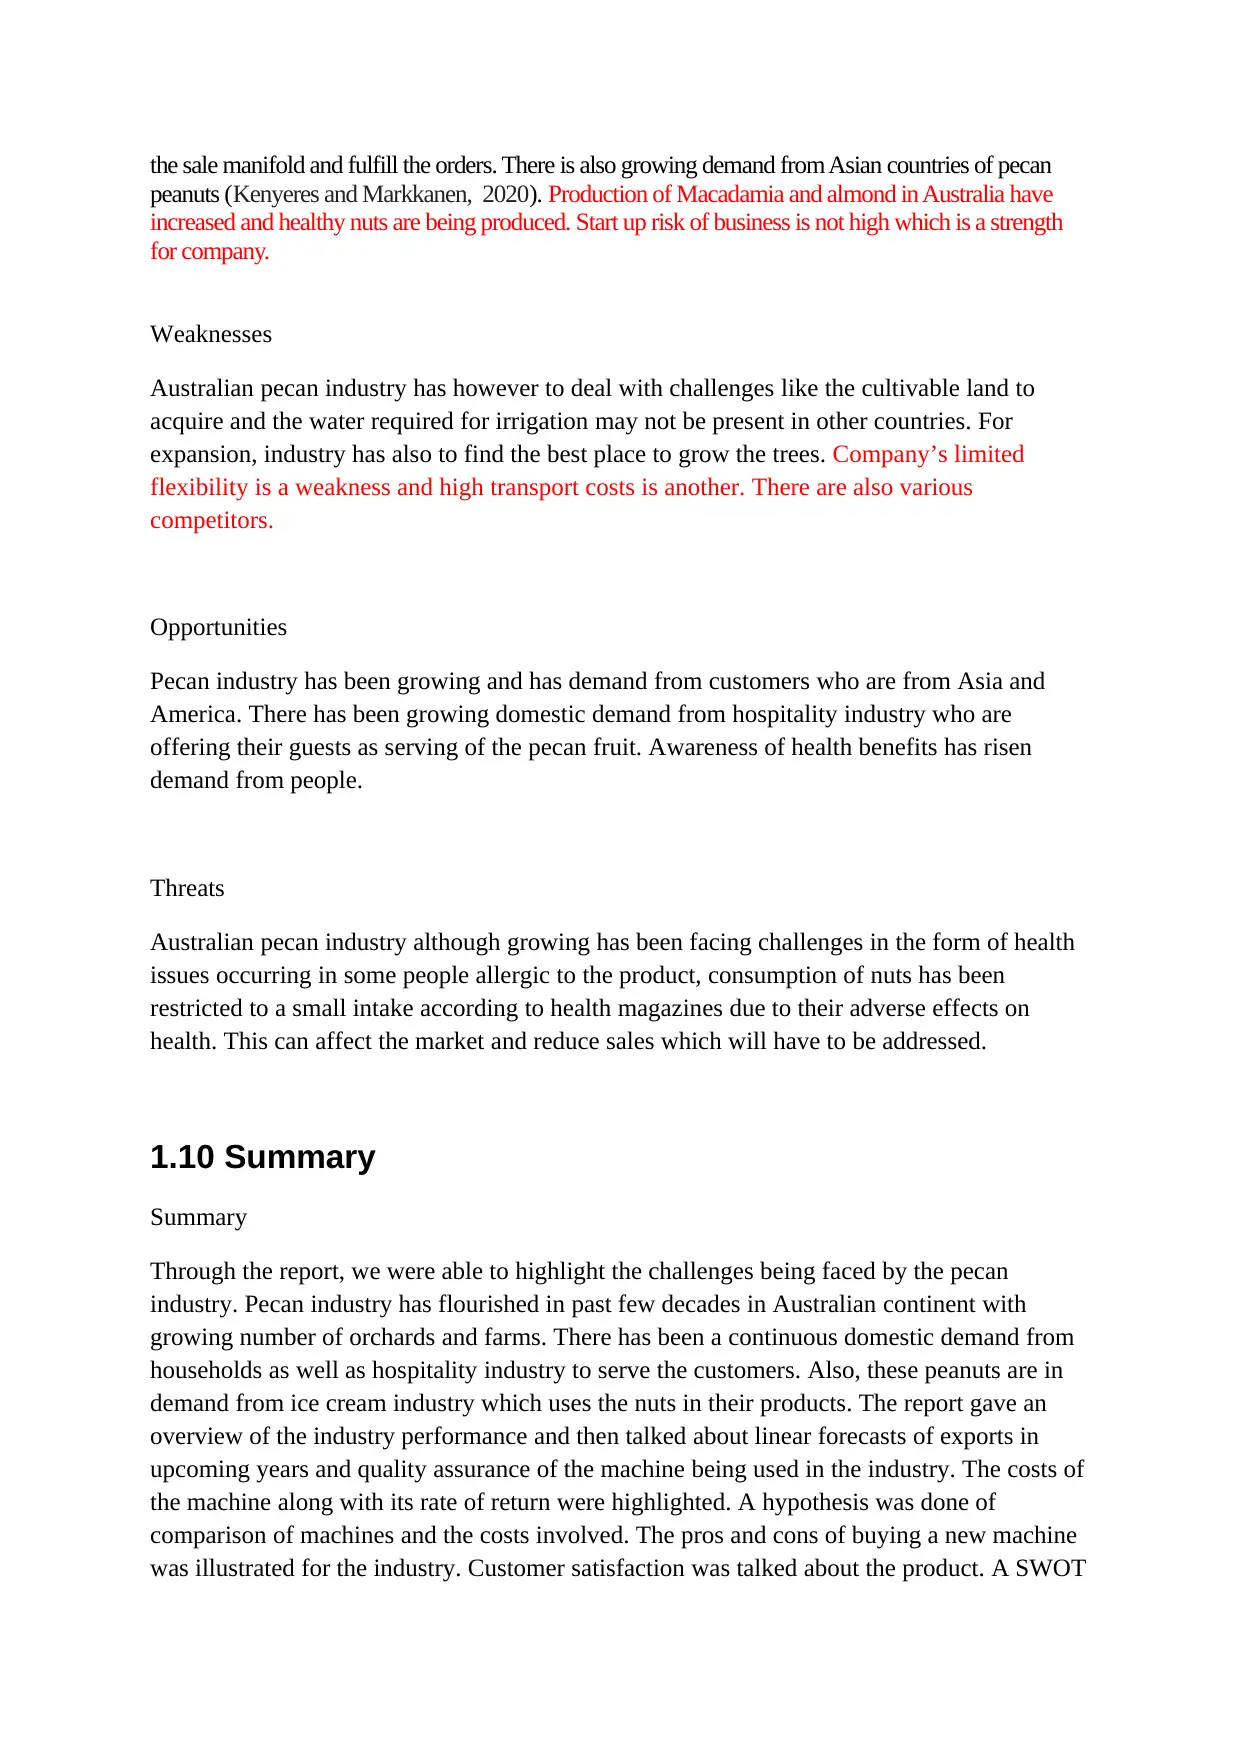
the sale manifold and fulfill the orders. There is also growing demand from Asian countries of pecan
peanuts (Kenyeres and Markkanen, 2020). Production of Macadamia and almond in Australia have
increased and healthy nuts are being produced. Start up risk of business is not high which is a strength
for company.
Weaknesses
Australian pecan industry has however to deal with challenges like the cultivable land to
acquire and the water required for irrigation may not be present in other countries. For
expansion, industry has also to find the best place to grow the trees. Company’s limited
flexibility is a weakness and high transport costs is another. There are also various
competitors.
Opportunities
Pecan industry has been growing and has demand from customers who are from Asia and
America. There has been growing domestic demand from hospitality industry who are
offering their guests as serving of the pecan fruit. Awareness of health benefits has risen
demand from people.
Threats
Australian pecan industry although growing has been facing challenges in the form of health
issues occurring in some people allergic to the product, consumption of nuts has been
restricted to a small intake according to health magazines due to their adverse effects on
health. This can affect the market and reduce sales which will have to be addressed.
1.10 Summary
Summary
Through the report, we were able to highlight the challenges being faced by the pecan
industry. Pecan industry has flourished in past few decades in Australian continent with
growing number of orchards and farms. There has been a continuous domestic demand from
households as well as hospitality industry to serve the customers. Also, these peanuts are in
demand from ice cream industry which uses the nuts in their products. The report gave an
overview of the industry performance and then talked about linear forecasts of exports in
upcoming years and quality assurance of the machine being used in the industry. The costs of
the machine along with its rate of return were highlighted. A hypothesis was done of
comparison of machines and the costs involved. The pros and cons of buying a new machine
was illustrated for the industry. Customer satisfaction was talked about the product. A SWOT

analysis of industry expansion was done for pecan peanuts. The SWOT analysis suggests the
strengths and opportunities industry can work on for expansion and the weaknesses and
threats which the industry will have to address. The pecan industry is bound to grow in the
upcoming years and is also investing to increase the production.
strengths and opportunities industry can work on for expansion and the weaknesses and
threats which the industry will have to address. The pecan industry is bound to grow in the
upcoming years and is also investing to increase the production.
⊘ This is a preview!⊘
Do you want full access?
Subscribe today to unlock all pages.
Trusted by 1+ million students worldwide
1 out of 14
Related Documents


Your All-in-One AI-Powered Toolkit for Academic Success.
+13062052269
info@desklib.com
Available 24*7 on WhatsApp / Email
![[object Object]](/_next/static/media/star-bottom.7253800d.svg)
Unlock your academic potential
Copyright © 2020–2026 A2Z Services. All Rights Reserved. Developed and managed by ZUCOL.