Pecan Peanuts Business Report: Market Analysis and Expansion Strategy
VerifiedAdded on 2021/09/08
|16
|2801
|126
Report
AI Summary
This business report provides a comprehensive analysis of Pecan Peanuts, a growing nut manufacturer. It begins with an overview of the Australian pecan industry, including production trends and expansion opportunities. The report then forecasts export production for 2021 and 2022, followed by a comparison of the health aspects of various nuts, highlighting the benefits of pecans. It also examines quality assurance for machines, machine costs, and hypothesis testing for machine performance. A pros and cons analysis is conducted to evaluate the purchase of a new machine. The report further explores customer satisfaction through survey results and concludes with an initial SWOT analysis regarding potential expansion. References and appendices are also included.
Business Report for Pecan Peanuts 2020
Pecan Peanuts
Business Report
Student ID:
Date: ……
1
Pecan Peanuts
Business Report
Student ID:
Date: ……
1
Paraphrase This Document
Need a fresh take? Get an instant paraphrase of this document with our AI Paraphraser
Business Report for Pecan Peanuts 2020
Table of Contents
Introduction...................................................................................................................................3
1. Analysis of Issues for Pecan Peanuts....................................................................................4
1.1 An Overview of the Australian Pecan Industry..................................................................4
1.2 Linear Forecast of Export Productions for 2021 and 2022.................................................5
1.3 Health Issues in the Pecan, Peanut, Cashew and Pistachio Market....................................6
1.4 Quality Assurance Conditions for Machine Working.........................................................7
1.5 Costs of a New Machine.....................................................................................................8
1.6 Hypothesis Testing for the Possible Difference in Two Machines.....................................9
1.7 Pros & Cons Analysis “Should we buy a new machine?”................................................10
1.8 Customer Satisfaction.......................................................................................................11
1.9 Initial SWOT Analysis about Possible Expansion............................................................12
1.10 Summary.........................................................................................................................13
2. References...........................................................................................................................14
3. Appendices..........................................................................................................................15
2

Business Report for Pecan Peanuts 2020
Introduction
In the following report, several problems & opportunities faced by a growing nut manufacturer
has been identified. The industry & the company itself have gained strong momentum in the
last few years, although its further growth potential still remains very robust. As such the
business is facing some unprecedented challenges that would require close monitoring to
successfully overcome. With the help of various journals & books, attempts have been made to
reach a logical conclusion from the perspective of a business analyst. The findings of the
overall research have been summarized in the conclusion segment.
3
⊘ This is a preview!⊘
Do you want full access?
Subscribe today to unlock all pages.
Trusted by 1+ million students worldwide
Business Report for Pecan Peanuts 2020
1. Analysis of Issues for Pecan Peanuts
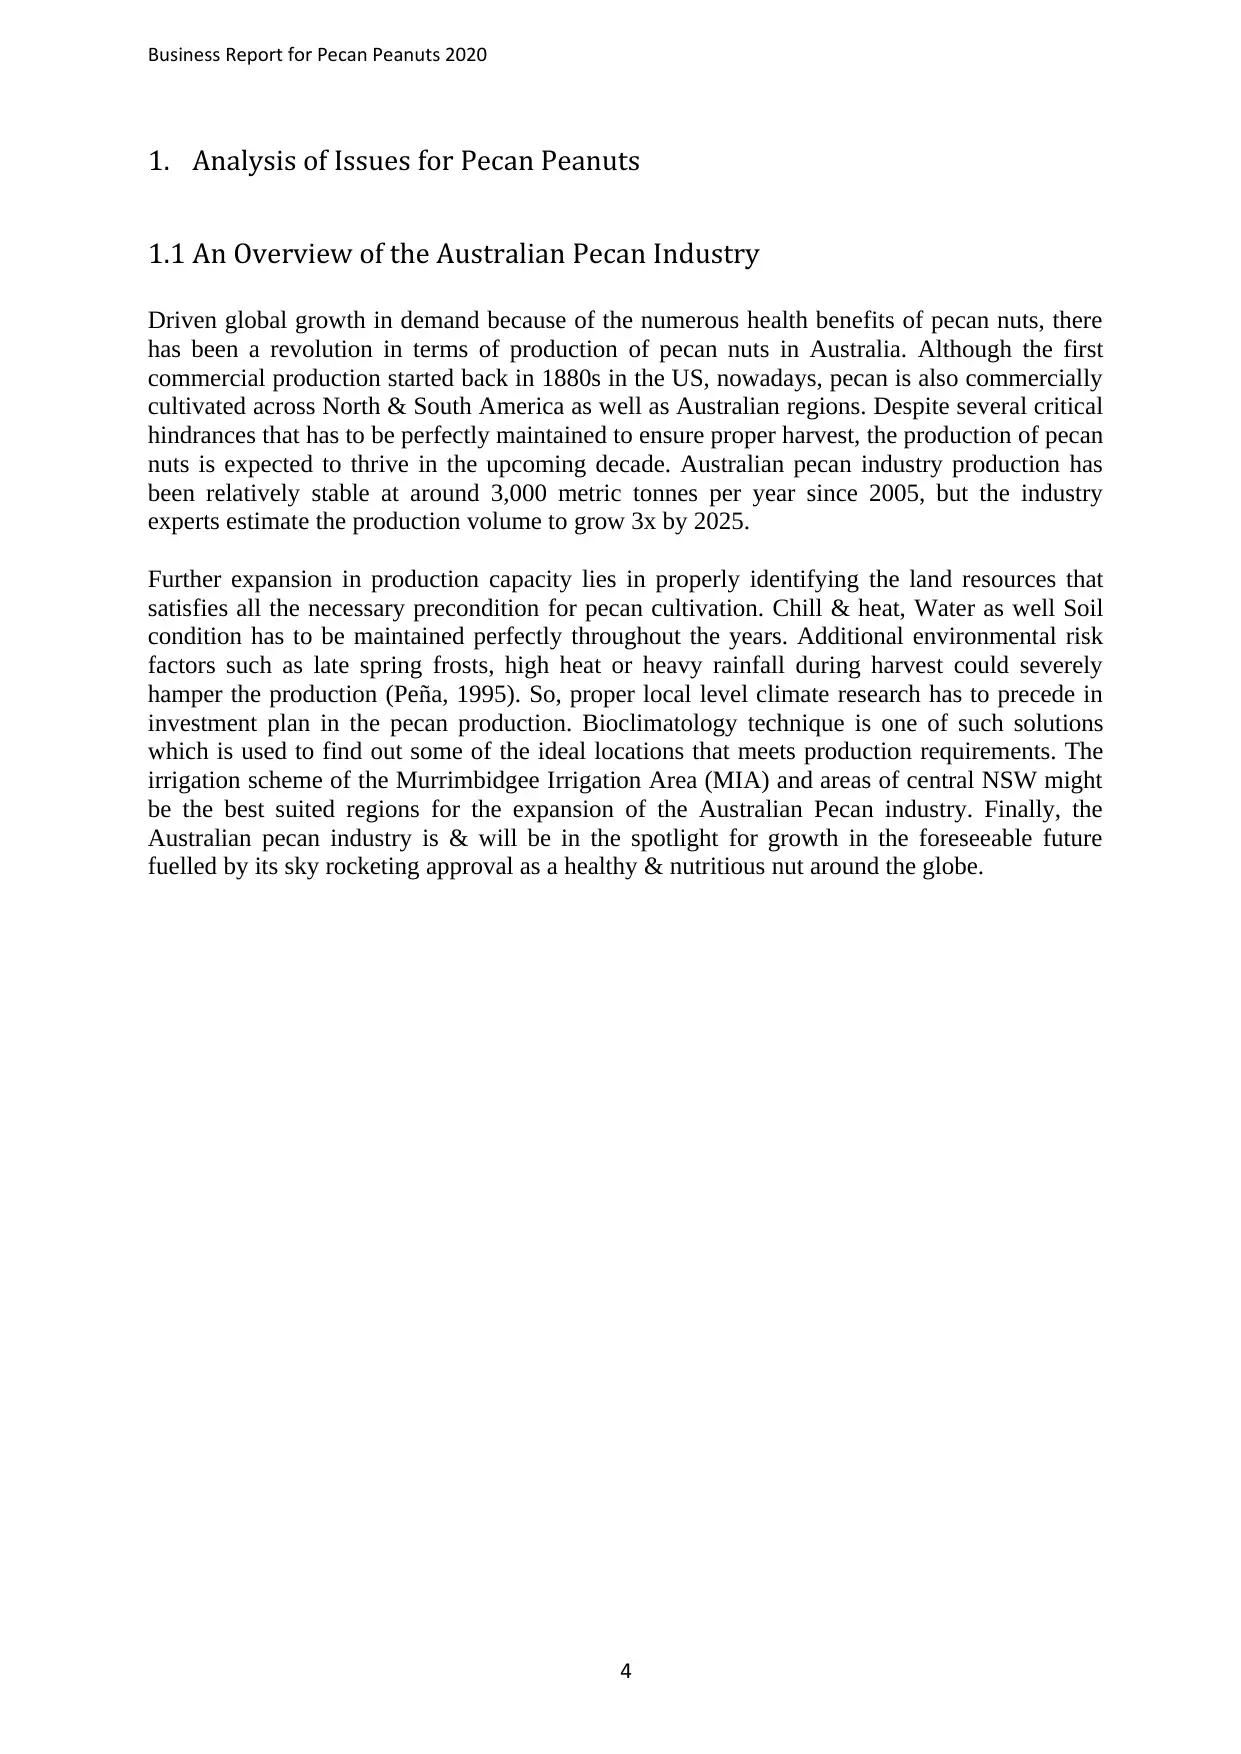
1.1 An Overview of the Australian Pecan Industry
Driven global growth in demand because of the numerous health benefits of pecan nuts, there
has been a revolution in terms of production of pecan nuts in Australia. Although the first
commercial production started back in 1880s in the US, nowadays, pecan is also commercially
cultivated across North & South America as well as Australian regions. Despite several critical
hindrances that has to be perfectly maintained to ensure proper harvest, the production of pecan
nuts is expected to thrive in the upcoming decade. Australian pecan industry production has
been relatively stable at around 3,000 metric tonnes per year since 2005, but the industry
experts estimate the production volume to grow 3x by 2025.
Further expansion in production capacity lies in properly identifying the land resources that
satisfies all the necessary precondition for pecan cultivation. Chill & heat, Water as well Soil
condition has to be maintained perfectly throughout the years. Additional environmental risk
factors such as late spring frosts, high heat or heavy rainfall during harvest could severely
hamper the production (Peña, 1995). So, proper local level climate research has to precede in
investment plan in the pecan production. Bioclimatology technique is one of such solutions
which is used to find out some of the ideal locations that meets production requirements. The
irrigation scheme of the Murrimbidgee Irrigation Area (MIA) and areas of central NSW might
be the best suited regions for the expansion of the Australian Pecan industry. Finally, the
Australian pecan industry is & will be in the spotlight for growth in the foreseeable future
fuelled by its sky rocketing approval as a healthy & nutritious nut around the globe.
4
1. Analysis of Issues for Pecan Peanuts
1.1 An Overview of the Australian Pecan Industry
Driven global growth in demand because of the numerous health benefits of pecan nuts, there
has been a revolution in terms of production of pecan nuts in Australia. Although the first
commercial production started back in 1880s in the US, nowadays, pecan is also commercially
cultivated across North & South America as well as Australian regions. Despite several critical
hindrances that has to be perfectly maintained to ensure proper harvest, the production of pecan
nuts is expected to thrive in the upcoming decade. Australian pecan industry production has
been relatively stable at around 3,000 metric tonnes per year since 2005, but the industry
experts estimate the production volume to grow 3x by 2025.
Further expansion in production capacity lies in properly identifying the land resources that
satisfies all the necessary precondition for pecan cultivation. Chill & heat, Water as well Soil
condition has to be maintained perfectly throughout the years. Additional environmental risk
factors such as late spring frosts, high heat or heavy rainfall during harvest could severely
hamper the production (Peña, 1995). So, proper local level climate research has to precede in
investment plan in the pecan production. Bioclimatology technique is one of such solutions
which is used to find out some of the ideal locations that meets production requirements. The
irrigation scheme of the Murrimbidgee Irrigation Area (MIA) and areas of central NSW might
be the best suited regions for the expansion of the Australian Pecan industry. Finally, the
Australian pecan industry is & will be in the spotlight for growth in the foreseeable future
fuelled by its sky rocketing approval as a healthy & nutritious nut around the globe.
4
Paraphrase This Document
Need a fresh take? Get an instant paraphrase of this document with our AI Paraphraser
Business Report for Pecan Peanuts 2020
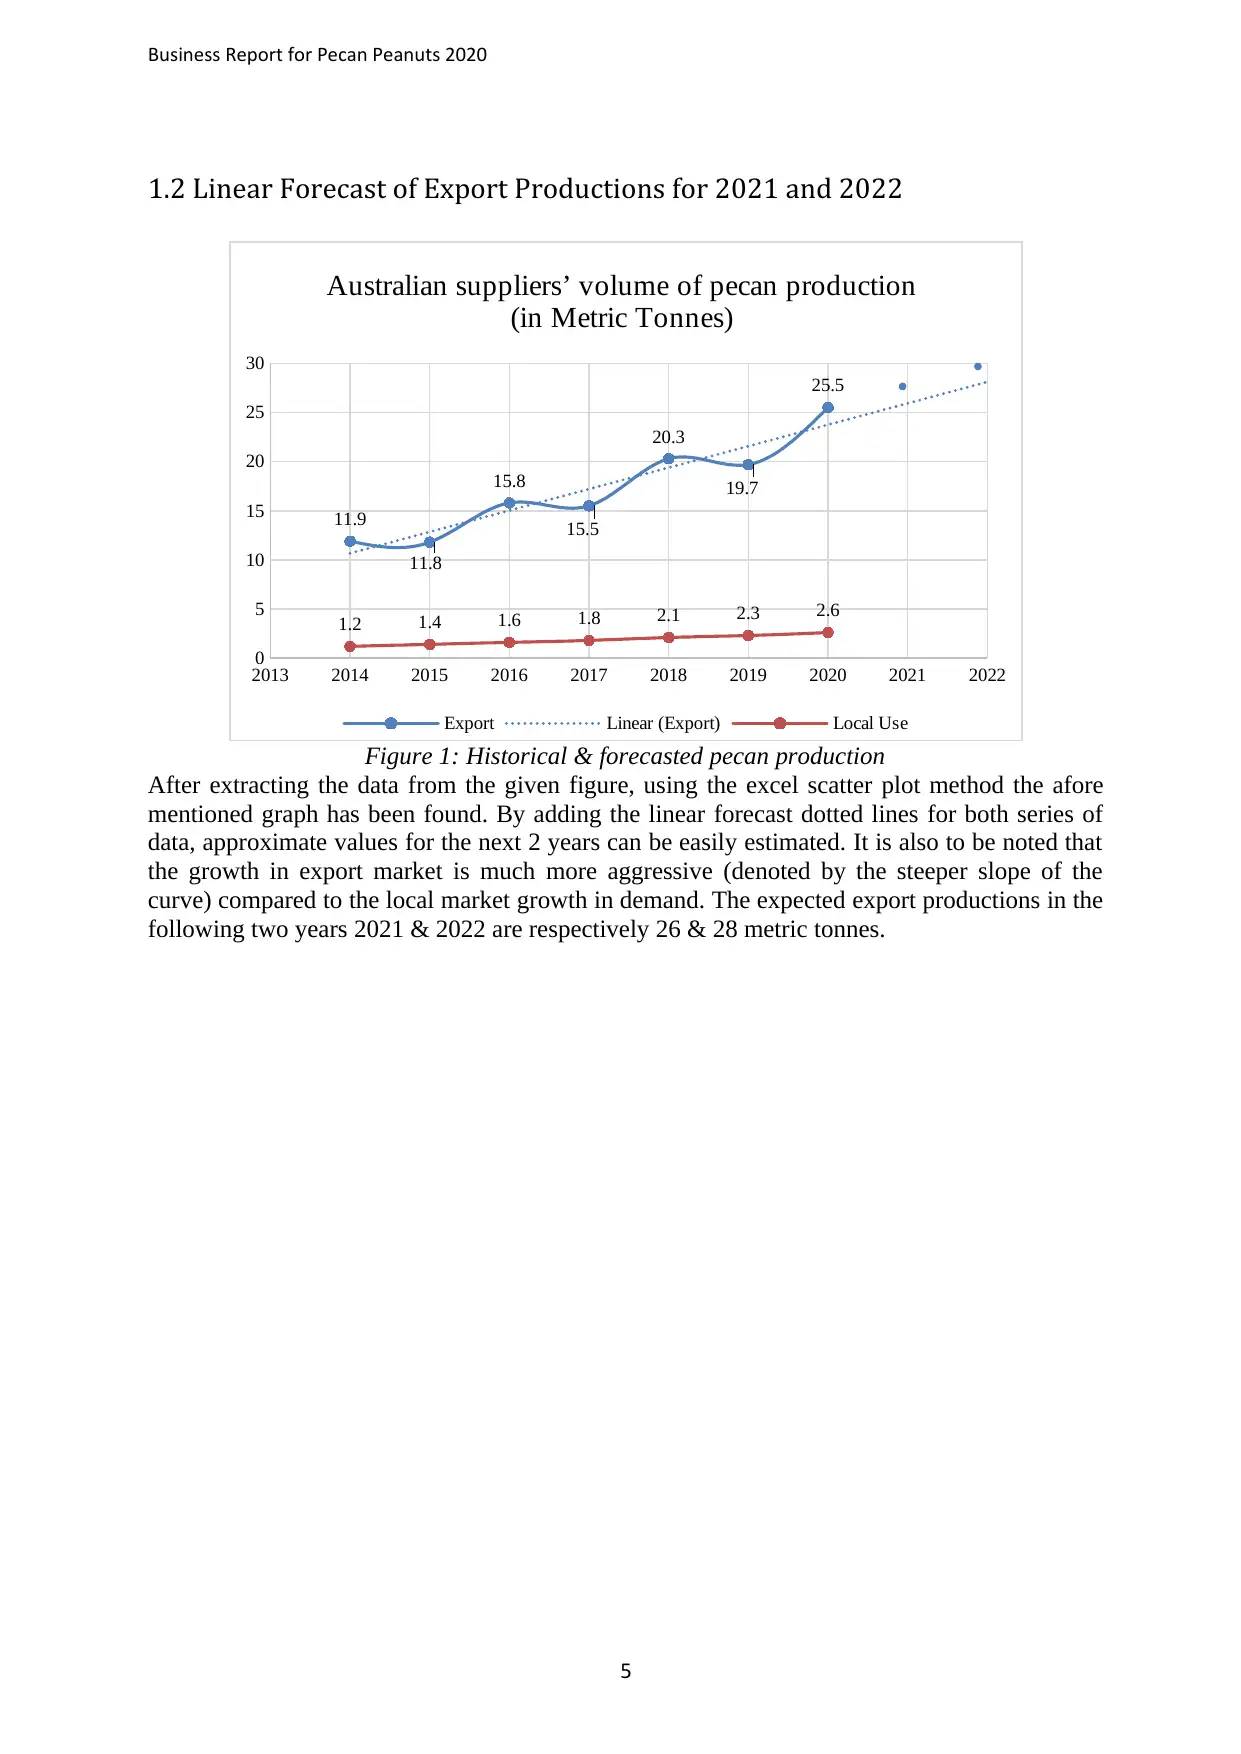
1.2 Linear Forecast of Export Productions for 2021 and 2022
2013 2014 2015 2016 2017 2018 2019 2020 2021 2022
0
5
10
15
20
25
30
1.2 1.4 1.6 1.8 2.1 2.3 2.6
11.9
11.8
15.8
15.5
20.3
19.7
25.5
Australian suppliers’ volume of pecan production
(in Metric Tonnes)
Export Linear (Export) Local Use
Figure 1: Historical & forecasted pecan production
After extracting the data from the given figure, using the excel scatter plot method the afore
mentioned graph has been found. By adding the linear forecast dotted lines for both series of
data, approximate values for the next 2 years can be easily estimated. It is also to be noted that
the growth in export market is much more aggressive (denoted by the steeper slope of the
curve) compared to the local market growth in demand. The expected export productions in the
following two years 2021 & 2022 are respectively 26 & 28 metric tonnes.
5
Business Report for Pecan Peanuts 2020
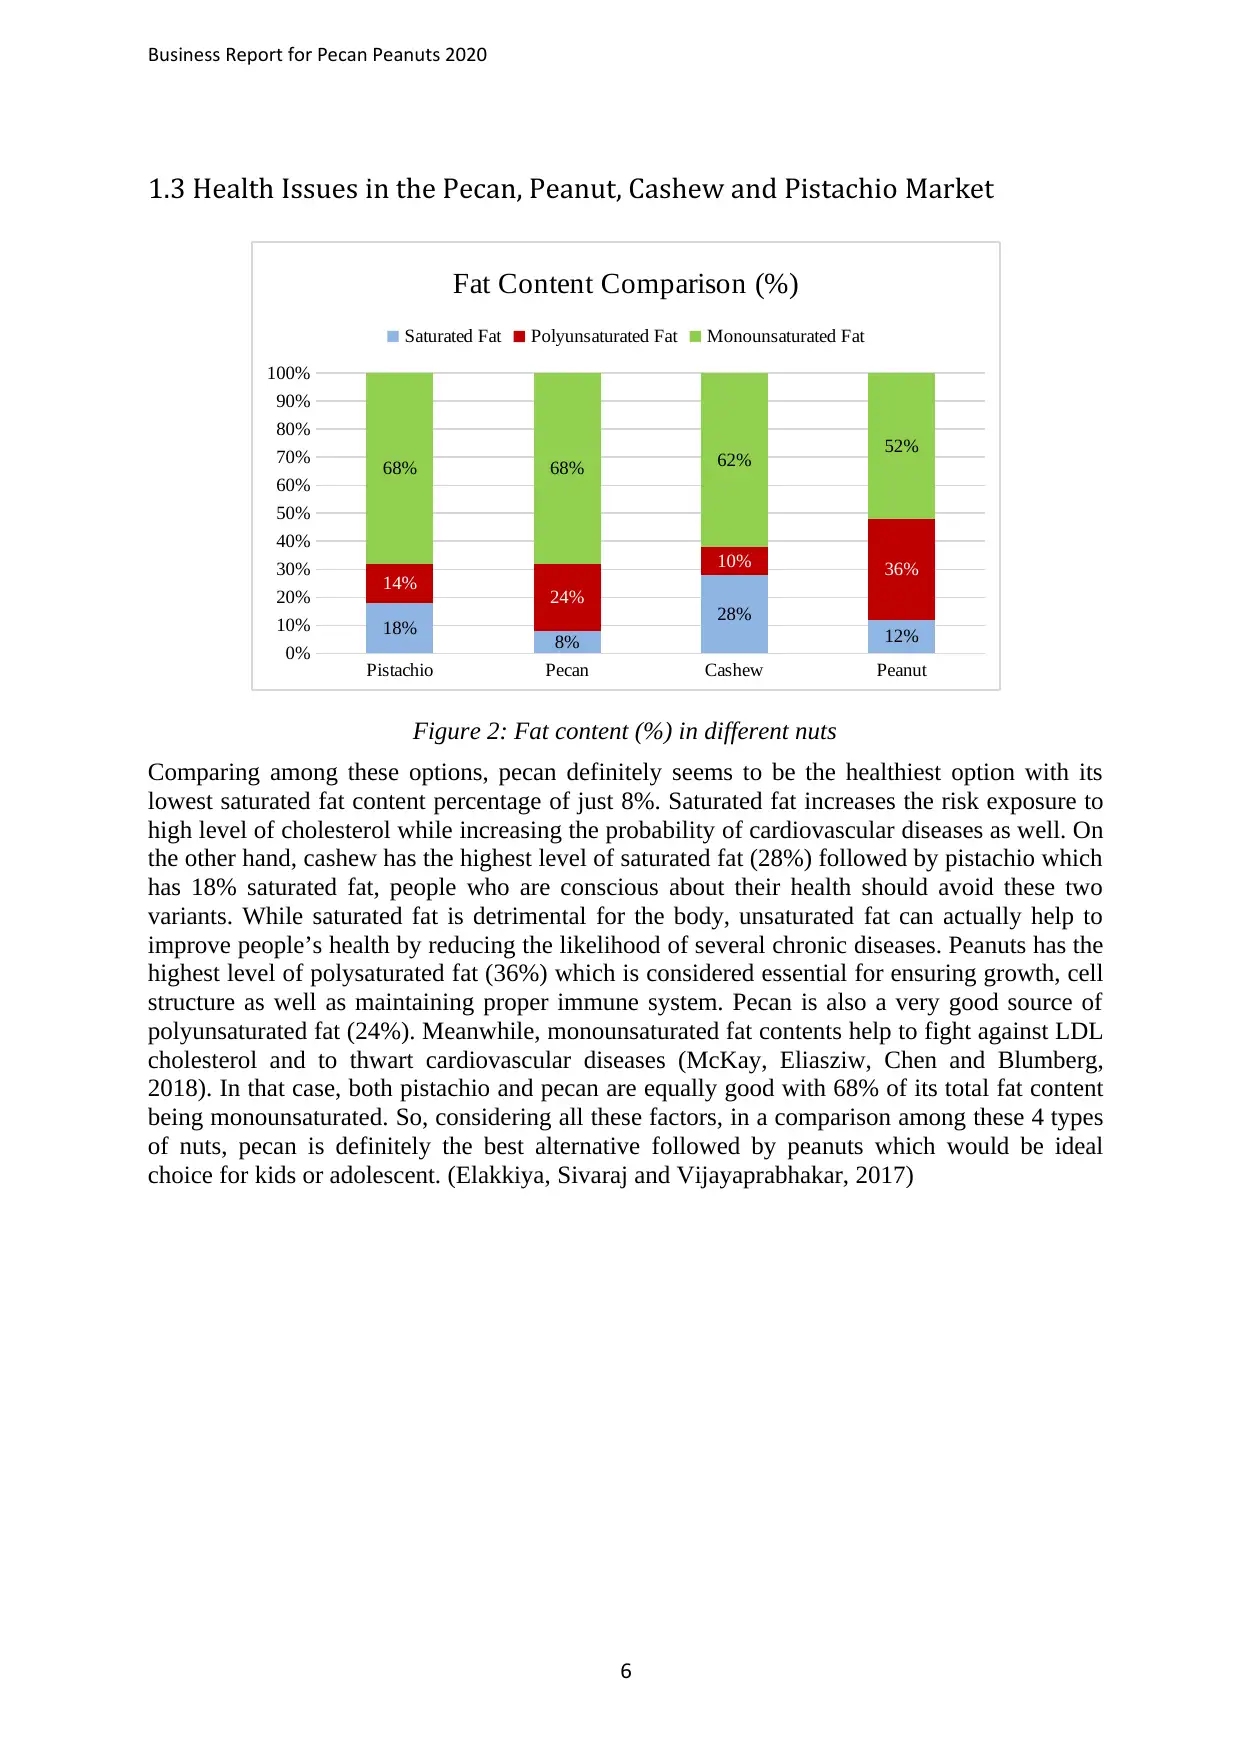
1.3 Health Issues in the Pecan, Peanut, Cashew and Pistachio Market
Pistachio Pecan Cashew Peanut
0%
10%
20%
30%
40%
50%
60%
70%
80%
90%
100%
18% 8%
28%
12%
14% 24%
10% 36%
68% 68% 62% 52%
Fat Content Comparison (%)
Saturated Fat Polyunsaturated Fat Monounsaturated Fat
Figure 2: Fat content (%) in different nuts
Comparing among these options, pecan definitely seems to be the healthiest option with its
lowest saturated fat content percentage of just 8%. Saturated fat increases the risk exposure to
high level of cholesterol while increasing the probability of cardiovascular diseases as well. On
the other hand, cashew has the highest level of saturated fat (28%) followed by pistachio which
has 18% saturated fat, people who are conscious about their health should avoid these two
variants. While saturated fat is detrimental for the body, unsaturated fat can actually help to
improve people’s health by reducing the likelihood of several chronic diseases. Peanuts has the
highest level of polysaturated fat (36%) which is considered essential for ensuring growth, cell
structure as well as maintaining proper immune system. Pecan is also a very good source of
polyunsaturated fat (24%). Meanwhile, monounsaturated fat contents help to fight against LDL
cholesterol and to thwart cardiovascular diseases (McKay, Eliasziw, Chen and Blumberg,
2018). In that case, both pistachio and pecan are equally good with 68% of its total fat content
being monounsaturated. So, considering all these factors, in a comparison among these 4 types
of nuts, pecan is definitely the best alternative followed by peanuts which would be ideal
choice for kids or adolescent. (Elakkiya, Sivaraj and Vijayaprabhakar, 2017)
6
⊘ This is a preview!⊘
Do you want full access?
Subscribe today to unlock all pages.
Trusted by 1+ million students worldwide
Business Report for Pecan Peanuts 2020
1.4 Quality Assurance Conditions for Machine Working
To assess the claim of the quality assurance department, firstly it has to be understood, whether
or not failure of each machine is an independent event. In statistical terminology, two events
are considered to be independent when the occurrence of one does not impact the probability of
occurrence of the other one. In this case, as the two machines are involved in separate
production lines, failure of each machine can be deemed independent.
Probability of 2 independent events occurring simultaneously = P(A) * P(B)
So, in our case, probability of failure in both machines at the same time = (0.20) * (0.80)
= 0.16 or 16%
That means, probability of at least one machine be running at all times is = (1 – 0.16)
= 0.84 or 84%
So, the quality assurance team’s claim is definitely overstated. There is only 84% chance that
at least one of the machines will continue to run when the other one fails. Considering the
actual condition of the machines, it is imperative that the management start looking for
replacement plans for the old machine or at least create an emergency backup system until such
arrangement can be managed.
7
Paraphrase This Document
Need a fresh take? Get an instant paraphrase of this document with our AI Paraphraser
Business Report for Pecan Peanuts 2020
1.5 Costs of a New Machine
The formula of annuity can be applied to find out what should be the ideal tenure of the loan if
the company wants to payback £96,000 at 9% interest rate when maximum monthly payment
would be £2,000 per month. Annuity refers to equal amount of cash inflow or outflow after
equal interval of time.
So, using the present value annuity formula to solve for n, (Berk and DeMarzo, 2019)
nPVA =
ln [ (1- PV ( r)−1
P ] /
ln (1+r)
Here, rate, r = 9%/12 or 0.75%
Payment, P = 2,000
Number of periods = n
Present value (of Annuity) PV = 96,000
So, after solving for the value of the only unknown variable, n = 59.728 periods.
That means, the ideal loan tenure would be = (60/12) = 5 years.
In that case, monthly instalment would be £1,993.
Although, it might seem that the firm can reduce annual interest expense by opting for a longer
tenure, it would be an unwise decision as it would further raise the effective annual interest rate
that they would have actually paid in a shorter term. So, considering the capability of the firm
choosing the 5-year option would be ideal (Sharma, 2018).
An amortization table showing the full maturity of the loan has been attached in appendix.
8
Business Report for Pecan Peanuts 2020
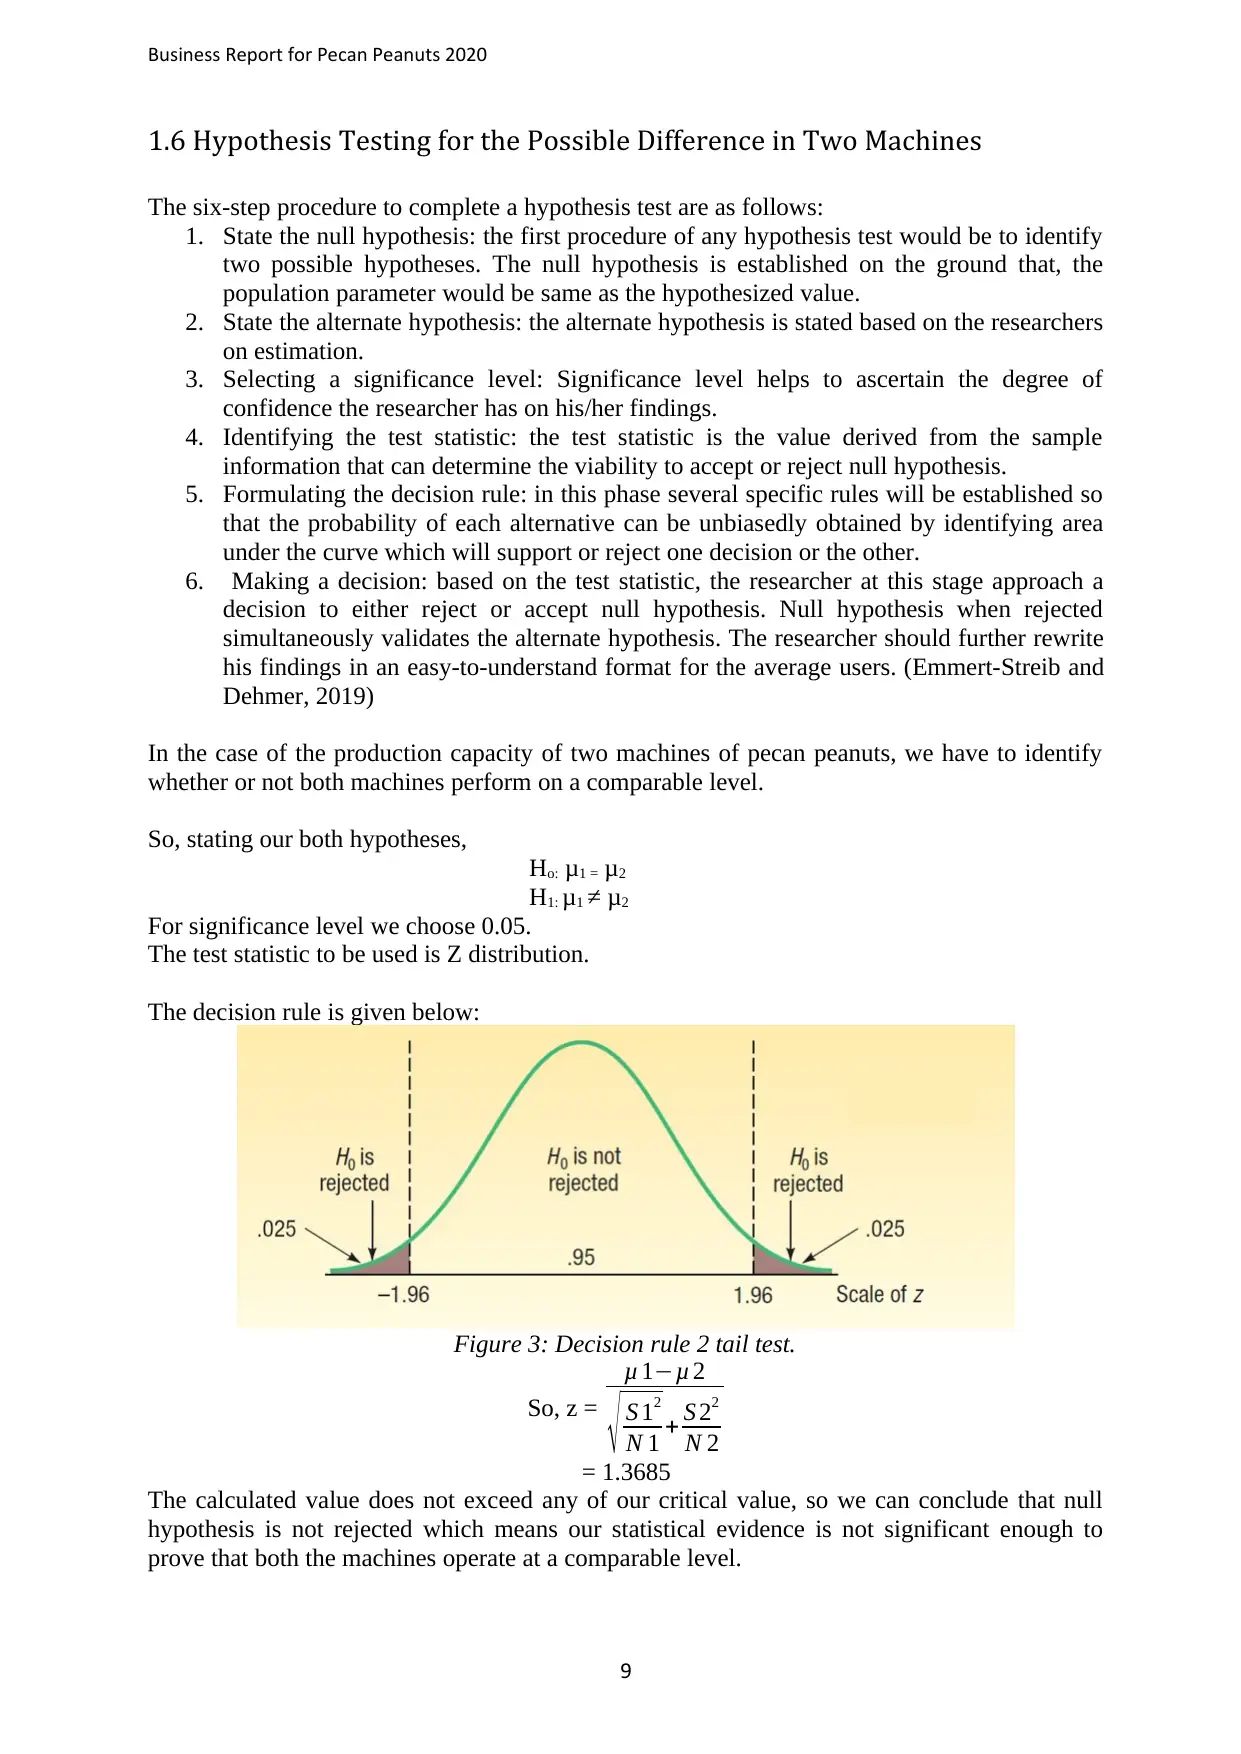
1.6 Hypothesis Testing for the Possible Difference in Two Machines
The six-step procedure to complete a hypothesis test are as follows:
1. State the null hypothesis: the first procedure of any hypothesis test would be to identify
two possible hypotheses. The null hypothesis is established on the ground that, the
population parameter would be same as the hypothesized value.
2. State the alternate hypothesis: the alternate hypothesis is stated based on the researchers
on estimation.
3. Selecting a significance level: Significance level helps to ascertain the degree of
confidence the researcher has on his/her findings.
4. Identifying the test statistic: the test statistic is the value derived from the sample
information that can determine the viability to accept or reject null hypothesis.
5. Formulating the decision rule: in this phase several specific rules will be established so
that the probability of each alternative can be unbiasedly obtained by identifying area
under the curve which will support or reject one decision or the other.
6. Making a decision: based on the test statistic, the researcher at this stage approach a
decision to either reject or accept null hypothesis. Null hypothesis when rejected
simultaneously validates the alternate hypothesis. The researcher should further rewrite
his findings in an easy-to-understand format for the average users. (Emmert-Streib and
Dehmer, 2019)
In the case of the production capacity of two machines of pecan peanuts, we have to identify
whether or not both machines perform on a comparable level.
So, stating our both hypotheses,
Ho: μ1 = μ2
H1: μ1 ≠ μ2
For significance level we choose 0.05.
The test statistic to be used is Z distribution.
The decision rule is given below:
Figure 3: Decision rule 2 tail test.
So, z =
μ 1−μ 2
√ S 12
N 1 + S 22
N 2
= 1.3685
The calculated value does not exceed any of our critical value, so we can conclude that null
hypothesis is not rejected which means our statistical evidence is not significant enough to
prove that both the machines operate at a comparable level.
9
⊘ This is a preview!⊘
Do you want full access?
Subscribe today to unlock all pages.
Trusted by 1+ million students worldwide
Business Report for Pecan Peanuts 2020
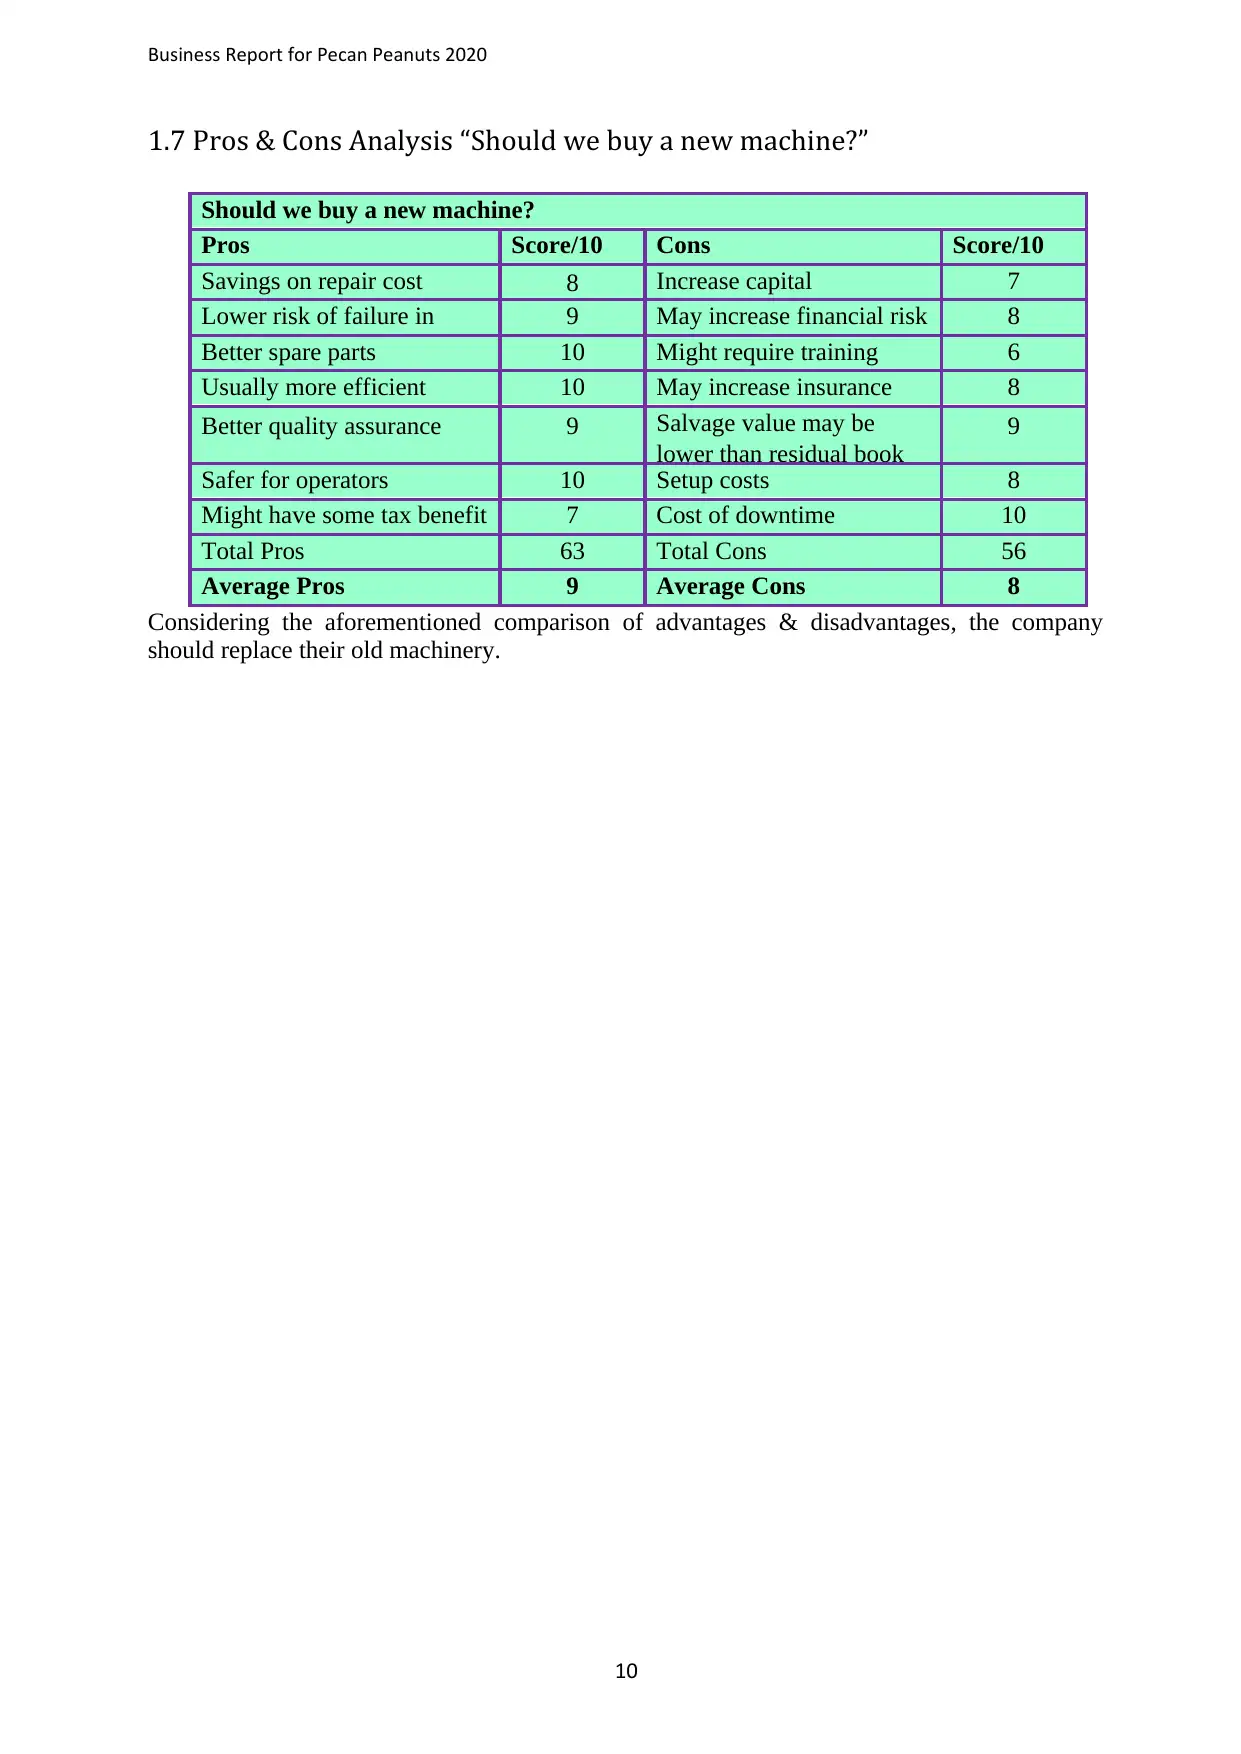
1.7 Pros & Cons Analysis “Should we buy a new machine?”
Should we buy a new machine?
Pros Score/10 Cons Score/10
Savings on repair cost 8 Increase capital
expenditure
7
Lower risk of failure in
future
9 May increase financial risk 8
Better spare parts
availability
10 Might require training 6
Usually more efficient 10 May increase insurance
cost
8
Better quality assurance 9 Salvage value may be
lower than residual book
9
Safer for operators 10 Setup costs 8
Might have some tax benefit 7 Cost of downtime 10
Total Pros 63 Total Cons 56
Average Pros 9 Average Cons 8
Considering the aforementioned comparison of advantages & disadvantages, the company
should replace their old machinery.
10
Paraphrase This Document
Need a fresh take? Get an instant paraphrase of this document with our AI Paraphraser
Business Report for Pecan Peanuts 2020
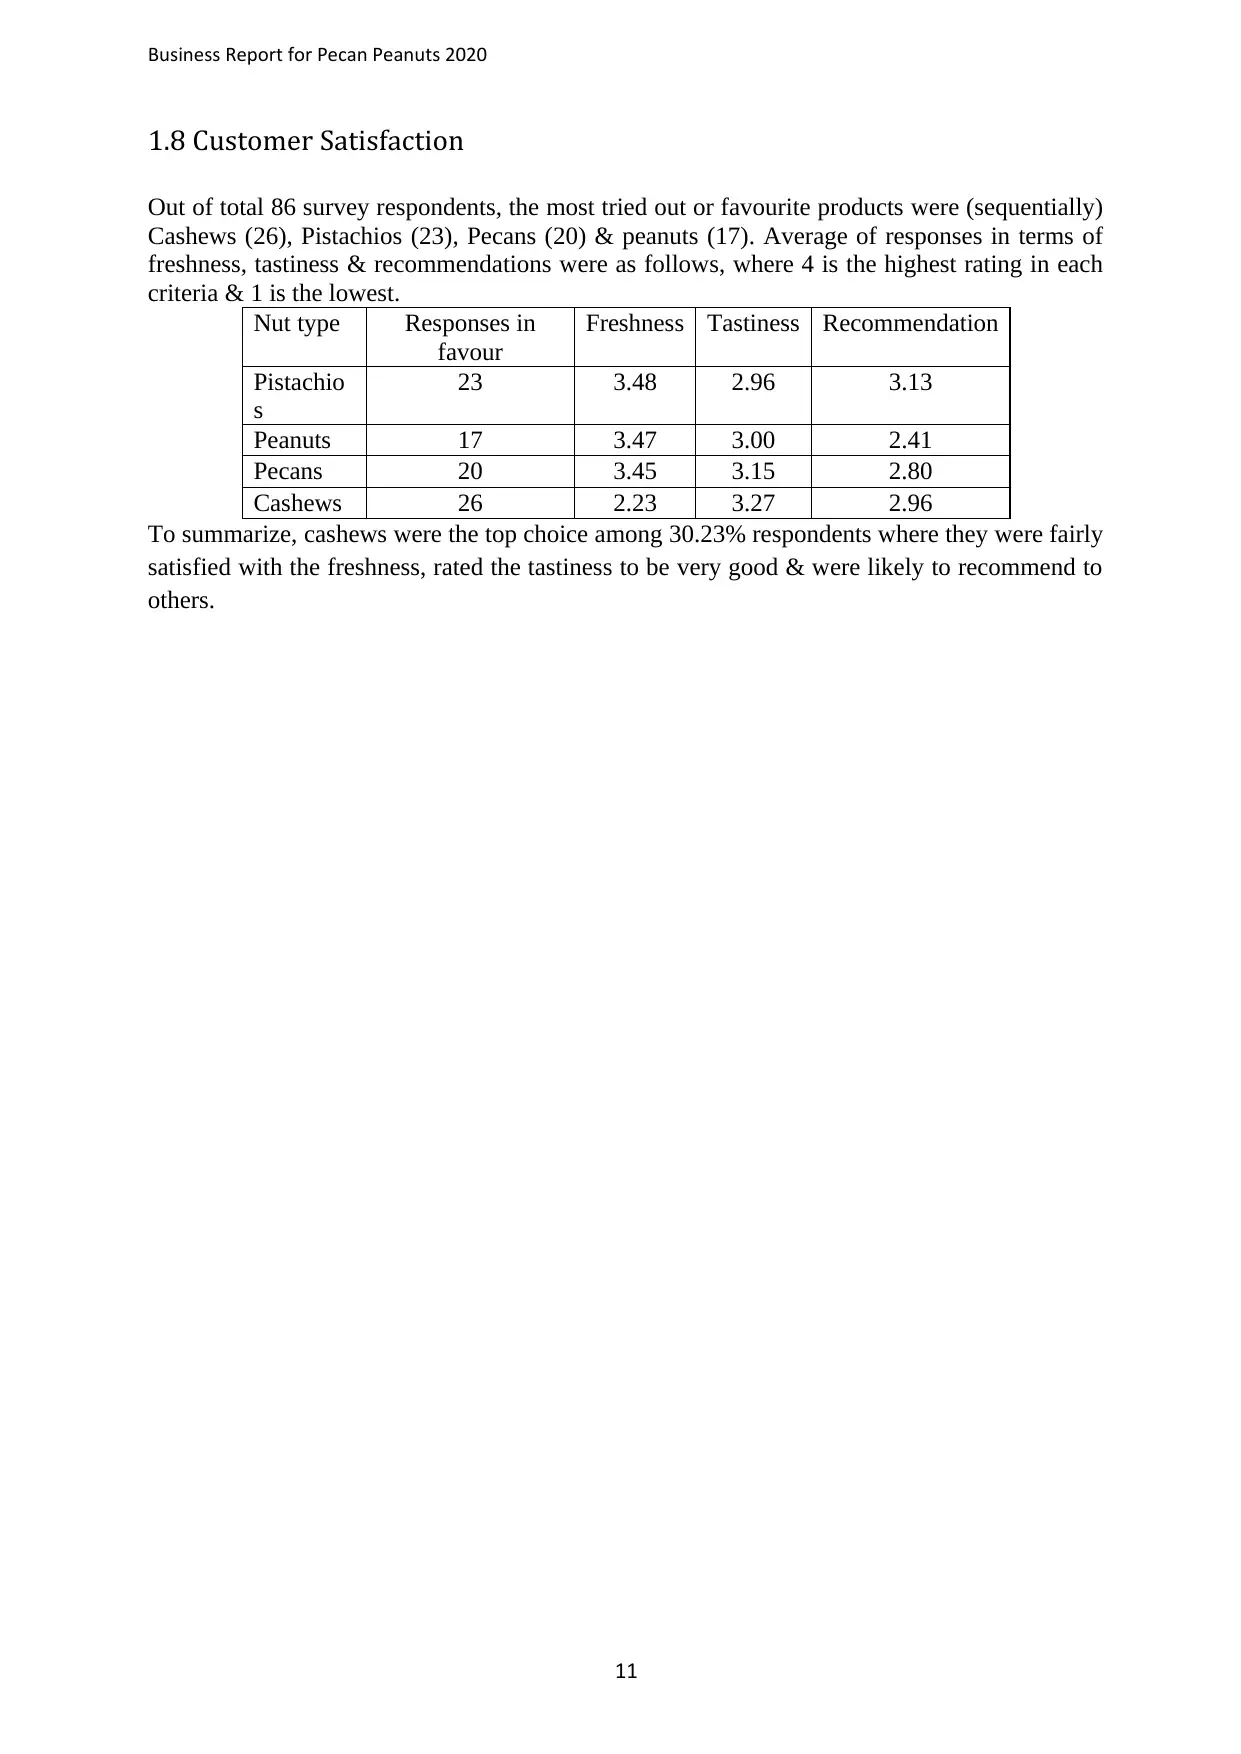
1.8 Customer Satisfaction
Out of total 86 survey respondents, the most tried out or favourite products were (sequentially)
Cashews (26), Pistachios (23), Pecans (20) & peanuts (17). Average of responses in terms of
freshness, tastiness & recommendations were as follows, where 4 is the highest rating in each
criteria & 1 is the lowest.
Nut type Responses in
favour
Freshness Tastiness Recommendation
Pistachio
s
23 3.48 2.96 3.13
Peanuts 17 3.47 3.00 2.41
Pecans 20 3.45 3.15 2.80
Cashews 26 2.23 3.27 2.96
To summarize, cashews were the top choice among 30.23% respondents where they were fairly
satisfied with the freshness, rated the tastiness to be very good & were likely to recommend to
others.
11
Business Report for Pecan Peanuts 2020
1.9 Initial SWOT Analysis about Possible Expansion
Strength:
1. Established brand positioning: As the consumers are already accustomed to similar
range of products, newer variants are most likely to be well received.
2. Perceived product quality: The consumers are already quite satisfied with the quality
of offerings from the brand, which is why they will also feel confident about the newly
launched variants. (M and Nedumaran, 2020)
Weakness:
1. Additional investment: Undoubtedly, exploring into newer segments would require
additional investment from the owners, which will expose them to further business risk.
2. Uncertainty over demand: Proper market research has to be done prior to the launch
to identify viable market for the product.
Opportunities:
1. Becoming the market leader: With newer offerings, the company will be able to
consolidate their market position even further. (Kolbina, 2015)
2. Exploring overseas market: After acquiring respectable reputation in the home
market, they can also explore foreign markets to yield benefits of the brand reputation.
Threats:
1. Supply chain risk: All types of nuts do not grow abundant in one area. So, for
expansion backward linkage will become more diverse & exposed to higher level of
risks.
2. Competition: Similar snacks from other established brands or even some new ones
could jeopardize the market potential.
12
⊘ This is a preview!⊘
Do you want full access?
Subscribe today to unlock all pages.
Trusted by 1+ million students worldwide
1 out of 16
Related Documents


Your All-in-One AI-Powered Toolkit for Academic Success.
+13062052269
info@desklib.com
Available 24*7 on WhatsApp / Email
![[object Object]](/_next/static/media/star-bottom.7253800d.svg)
Unlock your academic potential
Copyright © 2020–2026 A2Z Services. All Rights Reserved. Developed and managed by ZUCOL.