Issues in Corporate Finance: An Analysis of the Pecking Order Theory
VerifiedAdded on 2020/02/03
|15
|2171
|54
Report
AI Summary
This report delves into the complexities of corporate finance, specifically analyzing the pecking order theory. The introduction establishes the significance of finance in business and its impact on profitability, setting the stage for an examination of how companies prioritize funding sources. The report explores the theory, which suggests that firms favor retained earnings, then debt, and finally equity to finance their operations. Statistical tools, such as regression analysis, are applied to data to assess the practical application of the theory. The analysis includes evaluations of financial ratios, comparisons of share repurchase trends, and the impact of profitability and growth on debt and equity financing decisions. Scatter plots and statistical data are used to support the conclusions. The report concludes that the pecking order theory is widely applicable in the business world, reflecting investor behavior and the strategic financial choices of corporations.

ISSUES IN CORPORRATE
FINANCE
FINANCE
Paraphrase This Document
Need a fresh take? Get an instant paraphrase of this document with our AI Paraphraser
TABLE OF CONTENTS
INTRODUCTION...........................................................................................................................4
Question 1........................................................................................................................................4
(a).................................................................................................................................................4
(b).................................................................................................................................................4
©..................................................................................................................................................4
Question 2........................................................................................................................................5
(a).................................................................................................................................................5
(b).................................................................................................................................................5
©..................................................................................................................................................5
Question 3........................................................................................................................................6
(a).................................................................................................................................................6
(b).................................................................................................................................................6
(C)................................................................................................................................................6
(d).................................................................................................................................................6
Question 4........................................................................................................................................6
(a).................................................................................................................................................6
(b).................................................................................................................................................7
©..................................................................................................................................................7
(d).................................................................................................................................................7
Question 5........................................................................................................................................7
(a).................................................................................................................................................7
(b).................................................................................................................................................8
©..................................................................................................................................................9
(d).................................................................................................................................................9
Question 6......................................................................................................................................10
(a)...............................................................................................................................................10
(b)...............................................................................................................................................10
©................................................................................................................................................10
(d)...............................................................................................................................................11
CONCLUSION..............................................................................................................................11

REFERERNCES............................................................................................................................12
APPENDIX....................................................................................................................................13
APPENDIX....................................................................................................................................13
⊘ This is a preview!⊘
Do you want full access?
Subscribe today to unlock all pages.
Trusted by 1+ million students worldwide
INTRODUCTION
Finance is vast domain that greatly affects business firms and their profitability. In present
report discussion is carried out on pecking order theory. Analysis of data is done and it is identify
that to what extent pecking order theory is applied practically in business world. It is identify that
business firm’s trust more on debt then equity in order to finance their business. Statistical tools
like regression is also applied on data and results of same are interpreted.
Question 1
(a)
Pecking order theory of capital structure state that most of business firms fund their
investment by making use of retained earnings. Debt is used to meet fund requirement after
retained earnings is early invested in business. Equity is the last option that companies consider
to meet their fund requirements (De Jong, Verbeek and Verwijmeren, 2011). There is high
probability that due to issue of shares by other company just after specific firm bring IPO in the
market same may remain unsubscribed. This is e the reason due to which most firms use equity
as last option to fund their projects.
(b)
Pecking order theory state that investors think that firm is issuing shares because its business is
overvalued and it wants to take advantage of same. Thus, investors who intends to make
investment in the firm shares (which bring IPO and is having good financial condition) wait for
decline in price of same. At low price they purchase shares in secondary market. Thus, there is
probability that issue may remain unsubscribe (Pecking order, 2016). Cost of finance for equity
elevate due to asymmetric information. Hence, pecking order theory state that cost of new equity
finance may be high.
©
Pecking order predict that share repurchase are not common among the business firms.
This is because they view equity as last option and less issue shares in the market. If they will
purchase shares even same is undervalued then cash outflow takes place in business. Hence, less
firms carry out repurchase of shares.
Paraphrase This Document
Need a fresh take? Get an instant paraphrase of this document with our AI Paraphraser
Question 2
(a)
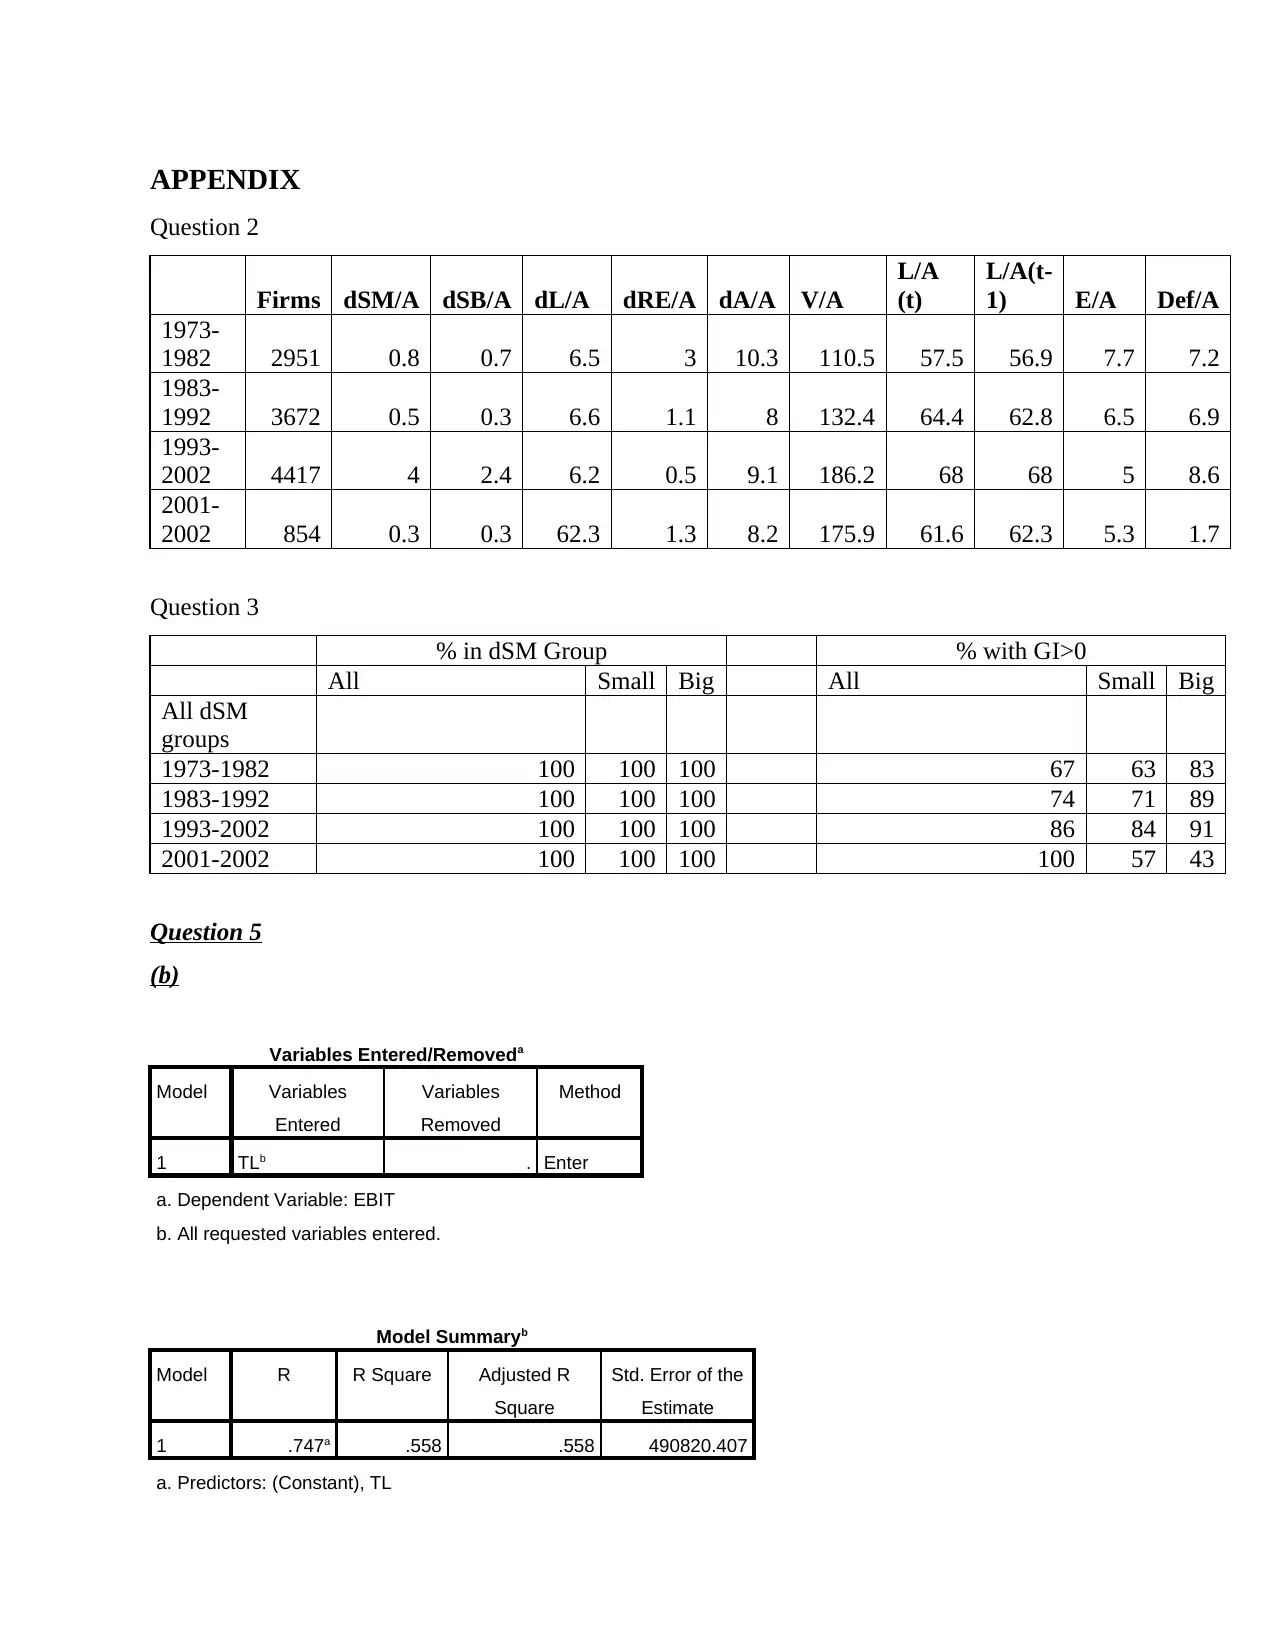
On evaluation of ratios given in above table it is identified that shareholder equity
increases in last groups after split as investors are taking advantage and are buying shares at low
price (dSM/a). Book value per share increase which means assets of firms increase and firm
make net issue of shares (dSB/a). However, change in debt is very high or huge (dL/A)and it can
be said that less equity is taken to finance projects. This acts as evidence in support of the fact
that Pecking order theoy is practically applied by business firms. Retained earning reduce at fast
rate (dRE/a) which is evident from value of (Def/A) ratio which indicate that asset increase at
higher rate then retained earning. Funds in proportion asset elevated which is reflected by (V/A)
ratio.
We can link ratios (V/A) and (dL/A) which reflect that funds in business increases but in
same debt elevate at rapid pace. On other hand, after split in most time inerval (1973-1982 and
1983-1992) share price decline. Hence, pecking theory applies which state that equity must be
last option.
(b)
Table prepared and attached in appendix.
©
On comparison it is identified that relative to previous year retained earnings increase (dre/a)
and liability reduced relative previous year. Overall proportion of fund to asset (v/a) reduce.
Moreover, equity reduce sharply. Hence, past trends are observed in 2001-02. Internal finance is
done by retained earnings. It can said that Packing theory apply practically.
Question 3
(a)
Table 3 is presenting evidence in better way than table 2 because it is clearly reflecting the
percentage of firms that are taken as sample in the research issue shares or repurchase same.
Apart from this, it is also indicating percentage of companies that face gain or loss on issue of
shares or repurchase of same. It can be said that indicate the proportion of firms out of total
(a)
On evaluation of ratios given in above table it is identified that shareholder equity
increases in last groups after split as investors are taking advantage and are buying shares at low
price (dSM/a). Book value per share increase which means assets of firms increase and firm
make net issue of shares (dSB/a). However, change in debt is very high or huge (dL/A)and it can
be said that less equity is taken to finance projects. This acts as evidence in support of the fact
that Pecking order theoy is practically applied by business firms. Retained earning reduce at fast
rate (dRE/a) which is evident from value of (Def/A) ratio which indicate that asset increase at
higher rate then retained earning. Funds in proportion asset elevated which is reflected by (V/A)
ratio.
We can link ratios (V/A) and (dL/A) which reflect that funds in business increases but in
same debt elevate at rapid pace. On other hand, after split in most time inerval (1973-1982 and
1983-1992) share price decline. Hence, pecking theory applies which state that equity must be
last option.
(b)
Table prepared and attached in appendix.
©
On comparison it is identified that relative to previous year retained earnings increase (dre/a)
and liability reduced relative previous year. Overall proportion of fund to asset (v/a) reduce.
Moreover, equity reduce sharply. Hence, past trends are observed in 2001-02. Internal finance is
done by retained earnings. It can said that Packing theory apply practically.
Question 3
(a)
Table 3 is presenting evidence in better way than table 2 because it is clearly reflecting the
percentage of firms that are taken as sample in the research issue shares or repurchase same.
Apart from this, it is also indicating percentage of companies that face gain or loss on issue of
shares or repurchase of same. It can be said that indicate the proportion of firms out of total
sample that issue shares or repurchase same in varied conditions. Hence, table 3 give better
overview of Pecking order theory.
(b)
Facts revealed that when firms observed negative growth in shares dSM<0 most
company’s repurchase same from market (83%) and issue less firms issue shares in market
(56%). Contrary to this, when dSM >0 when firms observe positive split growth in shares and all
firms make issue and repurchase of shares consecutively. This fact support packing order theory
which state that less number of firms actually issue shares in the market as reflected by dSM>0.
(C)
Table is prepared and paste in appendix.
(d)
On compassion of present table with relevant one it can be said that most of firms are
involved in issue and repurchase of shares irrespective of their size. Both tables reflect that less
firms prefer to issue equity in higher quantity. Most firms issues shares but reduce their net
quantity by repurchasing same from market.
Question 4
(a)
The first patch of standard packing theory is that there are number of factors that are
considered by firms in there divided decisions. Less firms in order to pay dividend repurchase
their shares. Second patch in mentioned theory is that firms if think that debt may adversely
affect their financial condition then they prefer to raise fund through equity instead of debt.
(b)
Theory predict that firm will prefer equity as best option when it feel that debt may
increase financial burden which will lead to poor business performance.
©
Theory predict that less firms prefer repurchase of shares for giving dividend for the
shareholders.
⊘ This is a preview!⊘
Do you want full access?
Subscribe today to unlock all pages.
Trusted by 1+ million students worldwide
(d)
Patched packing order theory does not explain table 3 because in mentioned table nothing
is given about debt. Data is available only in relation to issue of shares and repurchase.
Question 5
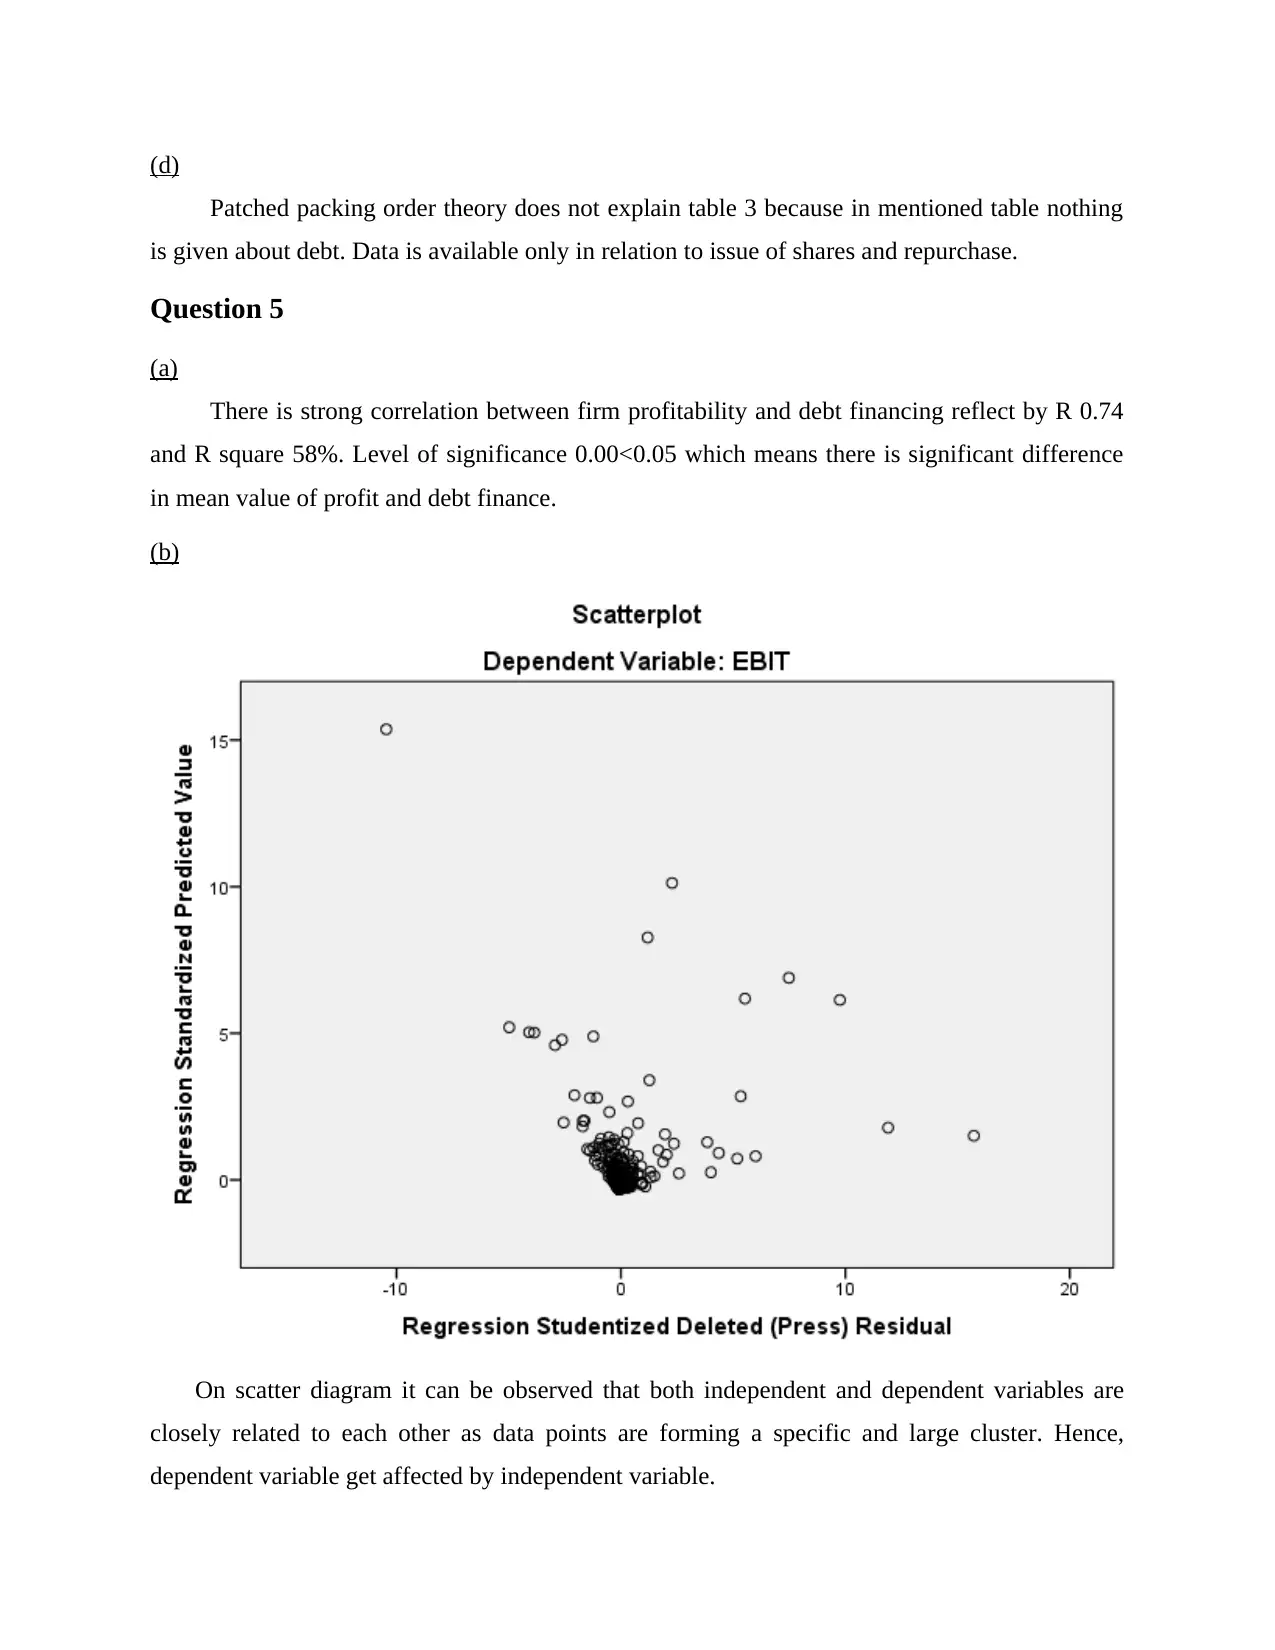
(a)
There is strong correlation between firm profitability and debt financing reflect by R 0.74
and R square 58%. Level of significance 0.00<0.05 which means there is significant difference
in mean value of profit and debt finance.
(b)
On scatter diagram it can be observed that both independent and dependent variables are
closely related to each other as data points are forming a specific and large cluster. Hence,
dependent variable get affected by independent variable.
Patched packing order theory does not explain table 3 because in mentioned table nothing
is given about debt. Data is available only in relation to issue of shares and repurchase.
Question 5
(a)
There is strong correlation between firm profitability and debt financing reflect by R 0.74
and R square 58%. Level of significance 0.00<0.05 which means there is significant difference
in mean value of profit and debt finance.
(b)
On scatter diagram it can be observed that both independent and dependent variables are
closely related to each other as data points are forming a specific and large cluster. Hence,
dependent variable get affected by independent variable.
Paraphrase This Document
Need a fresh take? Get an instant paraphrase of this document with our AI Paraphraser
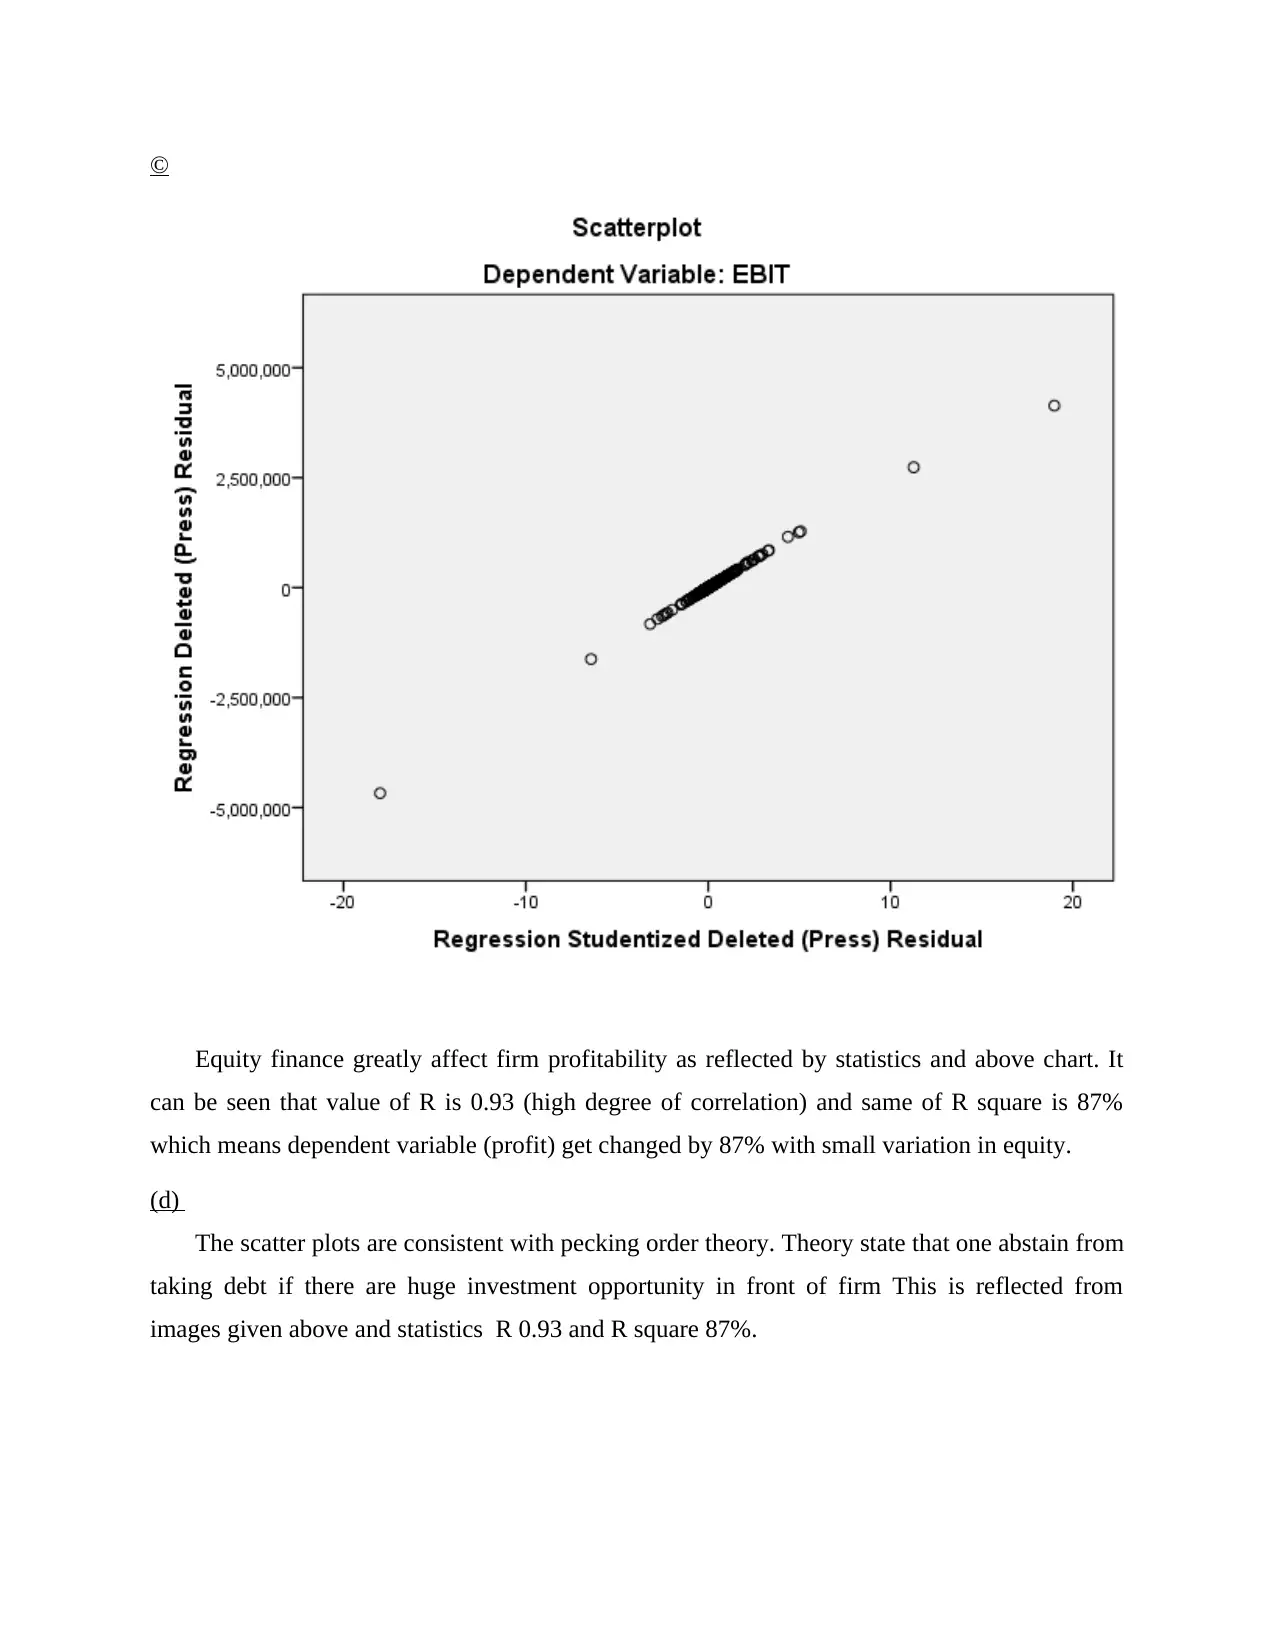
©
Equity finance greatly affect firm profitability as reflected by statistics and above chart. It
can be seen that value of R is 0.93 (high degree of correlation) and same of R square is 87%
which means dependent variable (profit) get changed by 87% with small variation in equity.
(d)
The scatter plots are consistent with pecking order theory. Theory state that one abstain from
taking debt if there are huge investment opportunity in front of firm This is reflected from
images given above and statistics R 0.93 and R square 87%.
Question 6
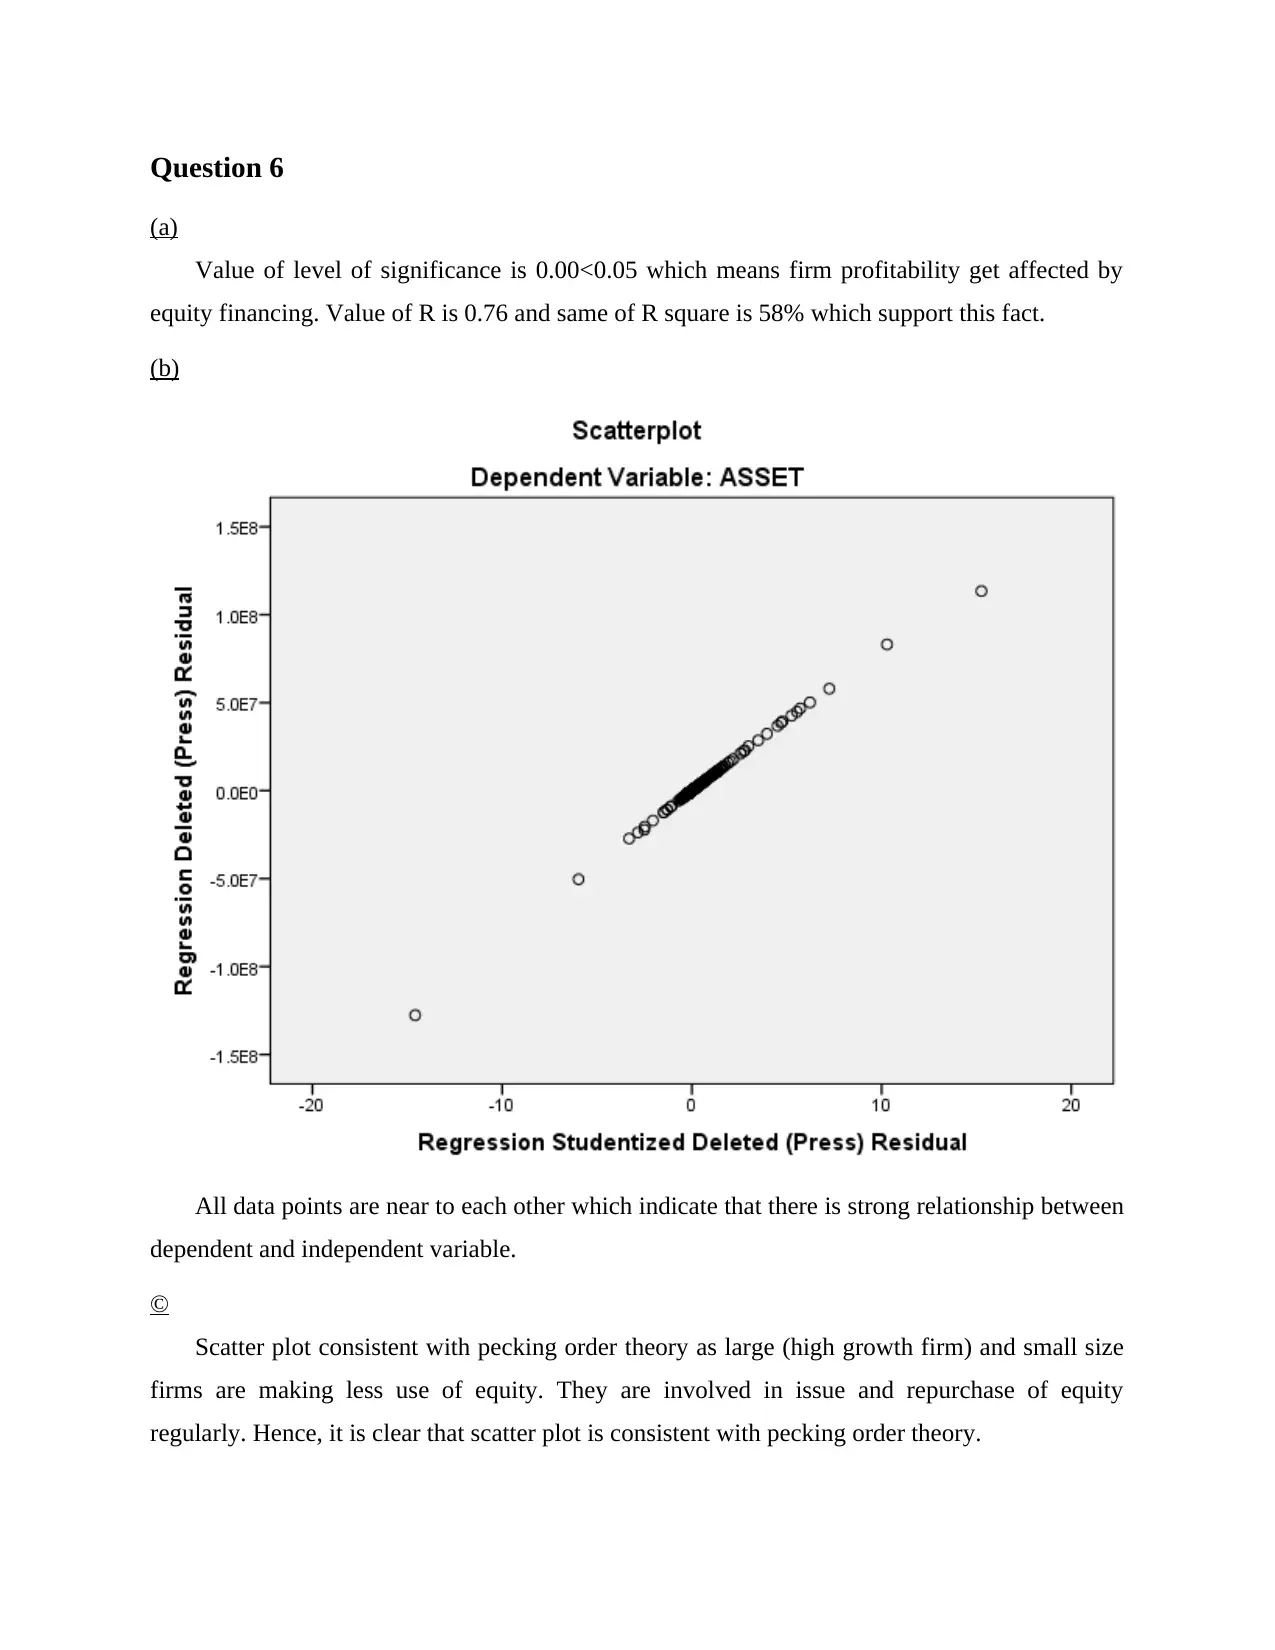
(a)
Value of level of significance is 0.00<0.05 which means firm profitability get affected by
equity financing. Value of R is 0.76 and same of R square is 58% which support this fact.
(b)
All data points are near to each other which indicate that there is strong relationship between
dependent and independent variable.
©
Scatter plot consistent with pecking order theory as large (high growth firm) and small size
firms are making less use of equity. They are involved in issue and repurchase of equity
regularly. Hence, it is clear that scatter plot is consistent with pecking order theory.
⊘ This is a preview!⊘
Do you want full access?
Subscribe today to unlock all pages.
Trusted by 1+ million students worldwide
(d)
Profitability and growth can be two variables for understanding variations in debt and
equity. This is because business firms evaluate growth opportunities and on that basis determine
amount of fund they will require. At same time control on finance cost is another important
factor so as to maximize profit. Hence, in this way profit and growth can be used to comprehend
variations in debt and equity. R square statistics can be used in this regard.
CONCLUSION
On the basis of results of analysis done above it is concluded that pecking order theory to
large extent applied by the business firms. This is because there is common mentality among
investors is that business is overvalued and due to this reason firm will sale its shares at high
price. Hence, they wait for decline in shares price. Hence, IPO may remain unsubscribe. This is
the reason due to which most business firms finance their business first by retained earning then
by debt and finally they use equity to fund business.
Paraphrase This Document
Need a fresh take? Get an instant paraphrase of this document with our AI Paraphraser
REFERERNCES
Books & journals
De Jong, A., Verbeek, M. and Verwijmeren, P., 2011. Firms’ debt–equity decisions when the
static tradeoff theory and the pecking order theory disagree. Journal of Banking & Finance,
35(5), pp.1303-1314.
Online
Pecking order, 2016. [Online]. Available through :<
https://www.boundless.com/finance/textbooks/boundless-finance-textbook/capital-structure-
13/capital-structure-considerations-102/pecking-order-440-7966/>. [Accessed on 15th
October 2016].
APPENDIX
Question 2
Firms dSM/A dSB/A dL/A dRE/A dA/A V/A
L/A
(t)
L/A(t-
1) E/A Def/A
1973-
1982 2951 0.8 0.7 6.5 3 10.3 110.5 57.5 56.9 7.7 7.2
1983-
1992 3672 0.5 0.3 6.6 1.1 8 132.4 64.4 62.8 6.5 6.9
1993-
2002 4417 4 2.4 6.2 0.5 9.1 186.2 68 68 5 8.6
2001-
2002 854 0.3 0.3 62.3 1.3 8.2 175.9 61.6 62.3 5.3 1.7
Question 3
% in dSM Group % with GI>0
All Small Big All Small Big
All dSM
groups
1973-1982 100 100 100 67 63 83
1983-1992 100 100 100 74 71 89
1993-2002 100 100 100 86 84 91
2001-2002 100 100 100 100 57 43
Question 5
(b)
Variables Entered/Removeda
Model Variables
Entered
Variables
Removed
Method
1 TLb . Enter
a. Dependent Variable: EBIT
b. All requested variables entered.
Model Summaryb
Model R R Square Adjusted R
Square
Std. Error of the
Estimate
1 .747a .558 .558 490820.407
a. Predictors: (Constant), TL
⊘ This is a preview!⊘
Do you want full access?
Subscribe today to unlock all pages.
Trusted by 1+ million students worldwide
1 out of 15
Related Documents


Your All-in-One AI-Powered Toolkit for Academic Success.
+13062052269
info@desklib.com
Available 24*7 on WhatsApp / Email
![[object Object]](/_next/static/media/star-bottom.7253800d.svg)
Unlock your academic potential
Copyright © 2020–2026 A2Z Services. All Rights Reserved. Developed and managed by ZUCOL.