Report on Technical Selection of Penstock Material for Hydro System
VerifiedAdded on 2023/06/15
|16
|3059
|320
Report
AI Summary
This report presents a comprehensive analysis of penstock material selection for a hydro-electric pumped storage piping system. It begins with an introduction to the importance of such systems and then delves into the design and selection process, considering two distinct steel materials (Steel A and Steel B). The analysis includes calculating wall thickness based on allowable design stress, evaluating fracture toughness, and assessing the criticality of material cracking under repetitive loading using methods like the Newton-Raphson method. Non-destructive testing (NDT) methods and their accuracy are discussed, along with failure assessment diagrams (FAD) to determine material viability. A sensitivity test is performed, followed by lifetime and fatigue assessments to estimate the durability of the penstock. The report concludes by summarizing the findings and recommending the better-suited material based on structural integrity, fracture resistance, and fatigue life, emphasizing the importance of accurate NDT methods for early crack detection and prevention of catastrophic failures.
REPORT ON TECHNICAL SELECTION OF PENSTOCK MATERIAL
FOR HYDRO-ELECTRIC PUMPED STORAGE PIPING SYSTEM
PREPARED BY: ENG XYZ
DATED:
FOR HYDRO-ELECTRIC PUMPED STORAGE PIPING SYSTEM
PREPARED BY: ENG XYZ
DATED:
Paraphrase This Document
Need a fresh take? Get an instant paraphrase of this document with our AI Paraphraser
Contents
1. Introduction……………………………………………………………………………………………………3
2. Design and Selection……………………………………………………………………………………… 4
Design data……………………………………………………………………………………………….4
Design of the two steel material ………………………………………………………………
Fracture Assessment ……………………………………………………………………………….
NDT methods………………………………………………………………………………………….
3. Sensitivity Test………………………………………………………………………………………………11
Lifetime assessment………………………………………………………………………………..12
Revised assessment…………………………………………………………………………………14
4. Fatigue Assessment………………………………………………………………………………………14
5. Conclusion…………………………………………………………………………………………………….15
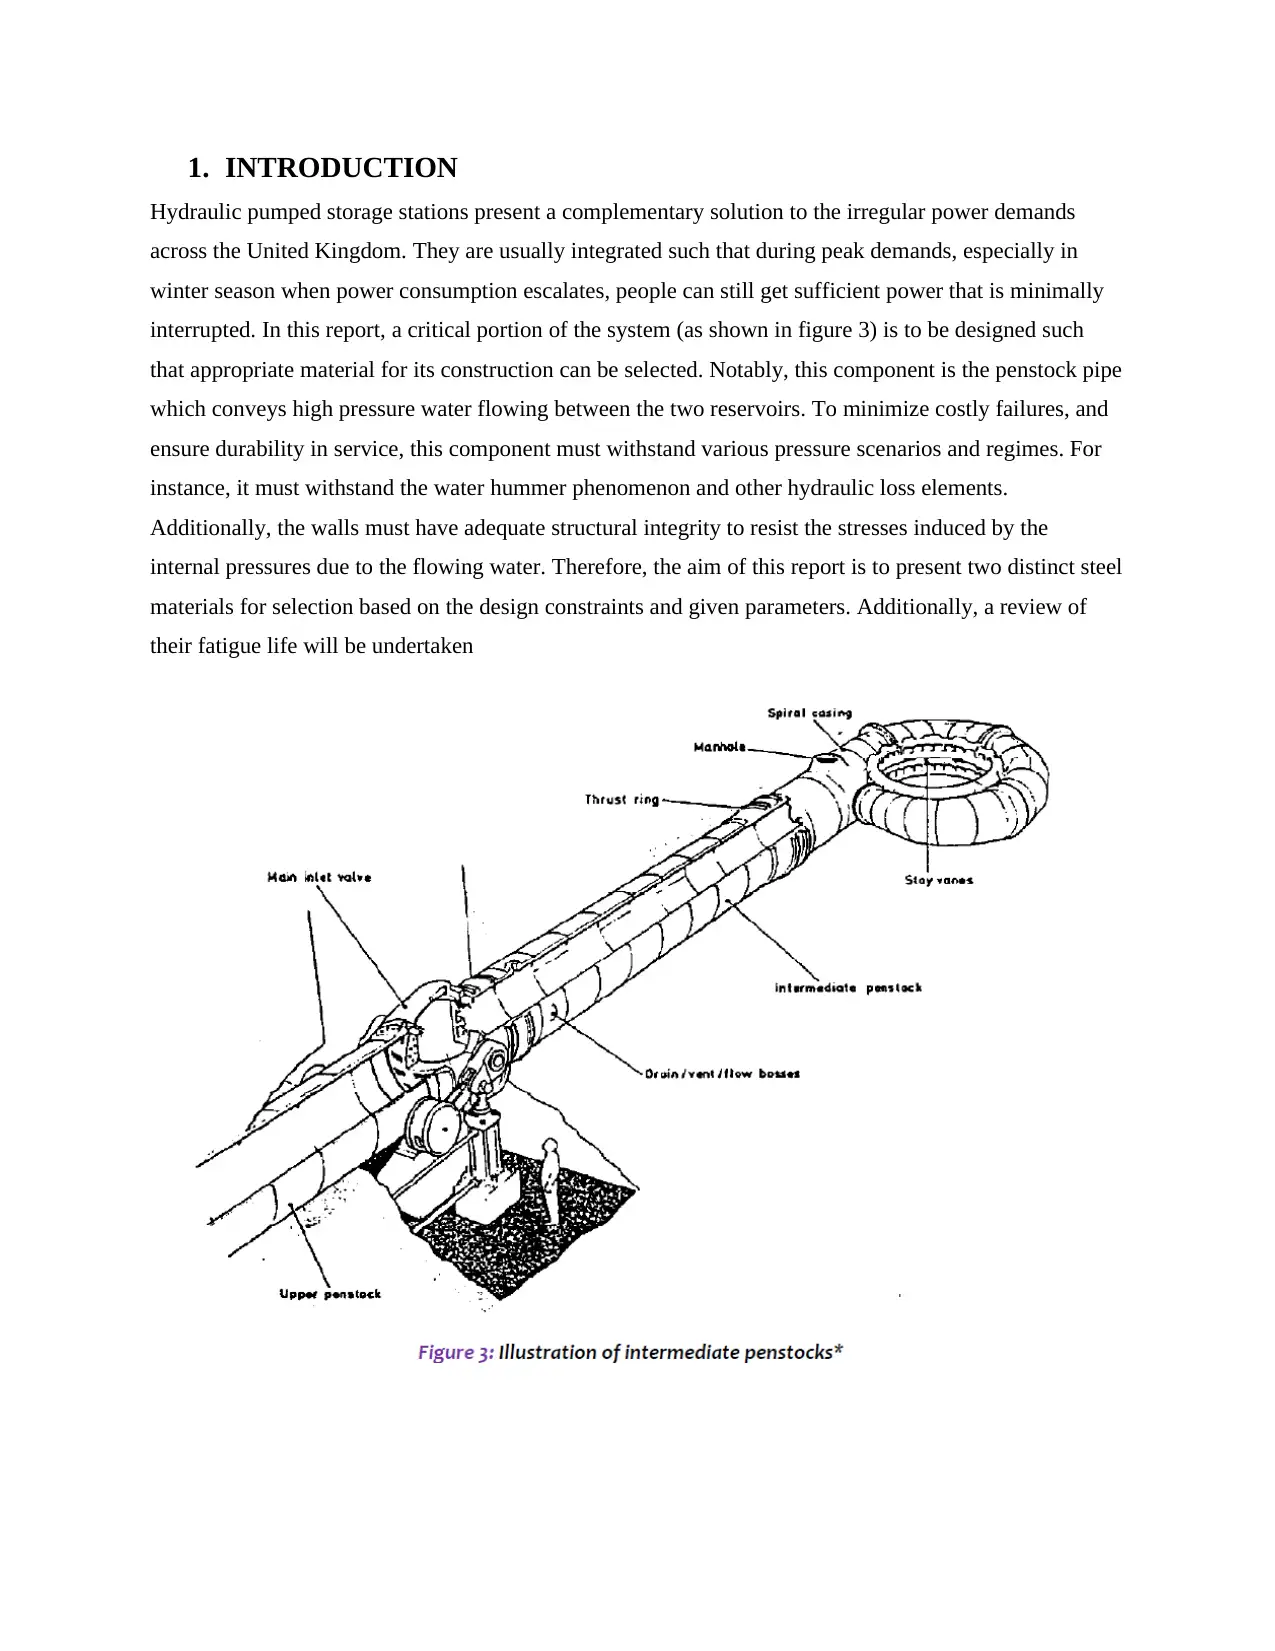
1. INTRODUCTION
Hydraulic pumped storage stations present a complementary solution to the irregular power demands
across the United Kingdom. They are usually integrated such that during peak demands, especially in
winter season when power consumption escalates, people can still get sufficient power that is minimally
interrupted. In this report, a critical portion of the system (as shown in figure 3) is to be designed such
that appropriate material for its construction can be selected. Notably, this component is the penstock pipe
which conveys high pressure water flowing between the two reservoirs. To minimize costly failures, and
ensure durability in service, this component must withstand various pressure scenarios and regimes. For
instance, it must withstand the water hummer phenomenon and other hydraulic loss elements.
Additionally, the walls must have adequate structural integrity to resist the stresses induced by the
internal pressures due to the flowing water. Therefore, the aim of this report is to present two distinct steel
materials for selection based on the design constraints and given parameters. Additionally, a review of
their fatigue life will be undertaken
⊘ This is a preview!⊘
Do you want full access?
Subscribe today to unlock all pages.
Trusted by 1+ million students worldwide
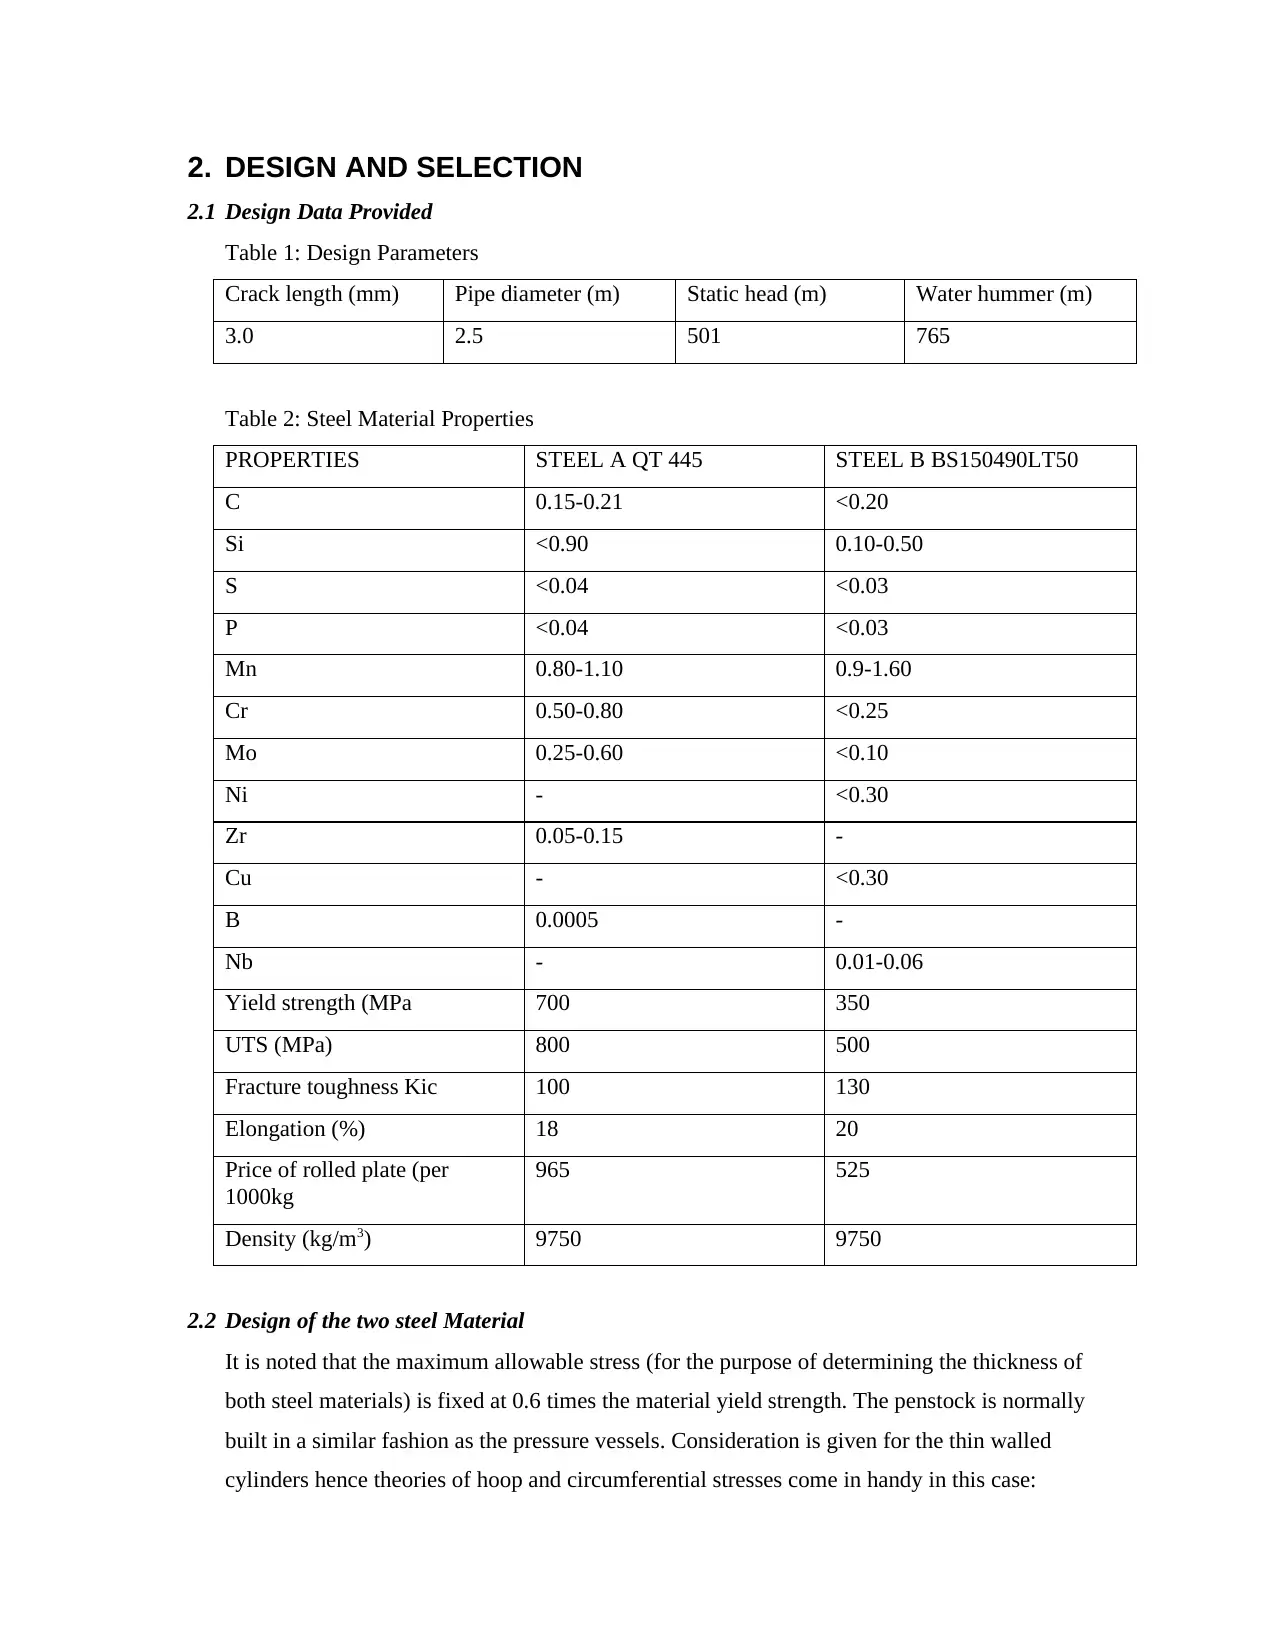
2. DESIGN AND SELECTION
2.1 Design Data Provided
Table 1: Design Parameters
Crack length (mm) Pipe diameter (m) Static head (m) Water hummer (m)
3.0 2.5 501 765
Table 2: Steel Material Properties
PROPERTIES STEEL A QT 445 STEEL B BS150490LT50
C 0.15-0.21 <0.20
Si <0.90 0.10-0.50
S <0.04 <0.03
P <0.04 <0.03
Mn 0.80-1.10 0.9-1.60
Cr 0.50-0.80 <0.25
Mo 0.25-0.60 <0.10
Ni - <0.30
Zr 0.05-0.15 -
Cu - <0.30
B 0.0005 -
Nb - 0.01-0.06
Yield strength (MPa 700 350
UTS (MPa) 800 500
Fracture toughness Kic 100 130
Elongation (%) 18 20
Price of rolled plate (per
1000kg
965 525
Density (kg/m3) 9750 9750
2.2 Design of the two steel Material
It is noted that the maximum allowable stress (for the purpose of determining the thickness of
both steel materials) is fixed at 0.6 times the material yield strength. The penstock is normally
built in a similar fashion as the pressure vessels. Consideration is given for the thin walled
cylinders hence theories of hoop and circumferential stresses come in handy in this case:
Paraphrase This Document
Need a fresh take? Get an instant paraphrase of this document with our AI Paraphraser
Firstly, the wall thickness is determined by considering the loading conditions and the yield stress
Consider steel A:
The allowable design stress= Yield stress/factor of safety=0.6x 700= 420MPa
The effective head, he= hw+hwh= 501 + 765= 1266m
Next, internal pressure P in determined:
P= ρgh= 1000x 9.81x 1266= 12.419MN/m2
Radius of pipe= d/2= 2.5/2= 1.25m
Now, we assume the pipe is designed in a fashion similar to pressure vessel hence thickness
is given as:
Hoop stress (maximum principal stress) = Pr/t
Implying: tA= (1.25x12.419)/420 = 0.03696m=36.96mm
Now, considering Steel B:
The allowable design stress= Yield stress/factor of safety=0.6x 350= 210MPa
The effective head, he= hw+hwh= 501 + 765= 1266m
Next, internal pressure P is determined:
P= ρgh= 1000x 9.81x 1266= 12.419MN/m2
Radius of pipe= d/2= 2.5/2= 1.25m
Hoop stress (maximum principal stress) = Pr/t
Hence tB= (1.25x12.419)/210 = 0.07392m= 73.92mm
Steel B wall pipe will have to be thicker than that of steel A in order to withstand the same loading
conditions. Although, per a thousand kg, steel B is cheaper than steel A, however in the long run more
capital would be needed to purchase steel B material given the doubling of material quantity due to
increased thickness (Bannister, 1998).
In fact considering the cost implications:
Cost A and Cost B can be compared:
Cost A/Cost B= tA$A/tB$B
36.96x 96.5/52.5x73.92= 0.9190
This implies that Material A will cost about 92%relative to material B
2.3 Fracture assessment
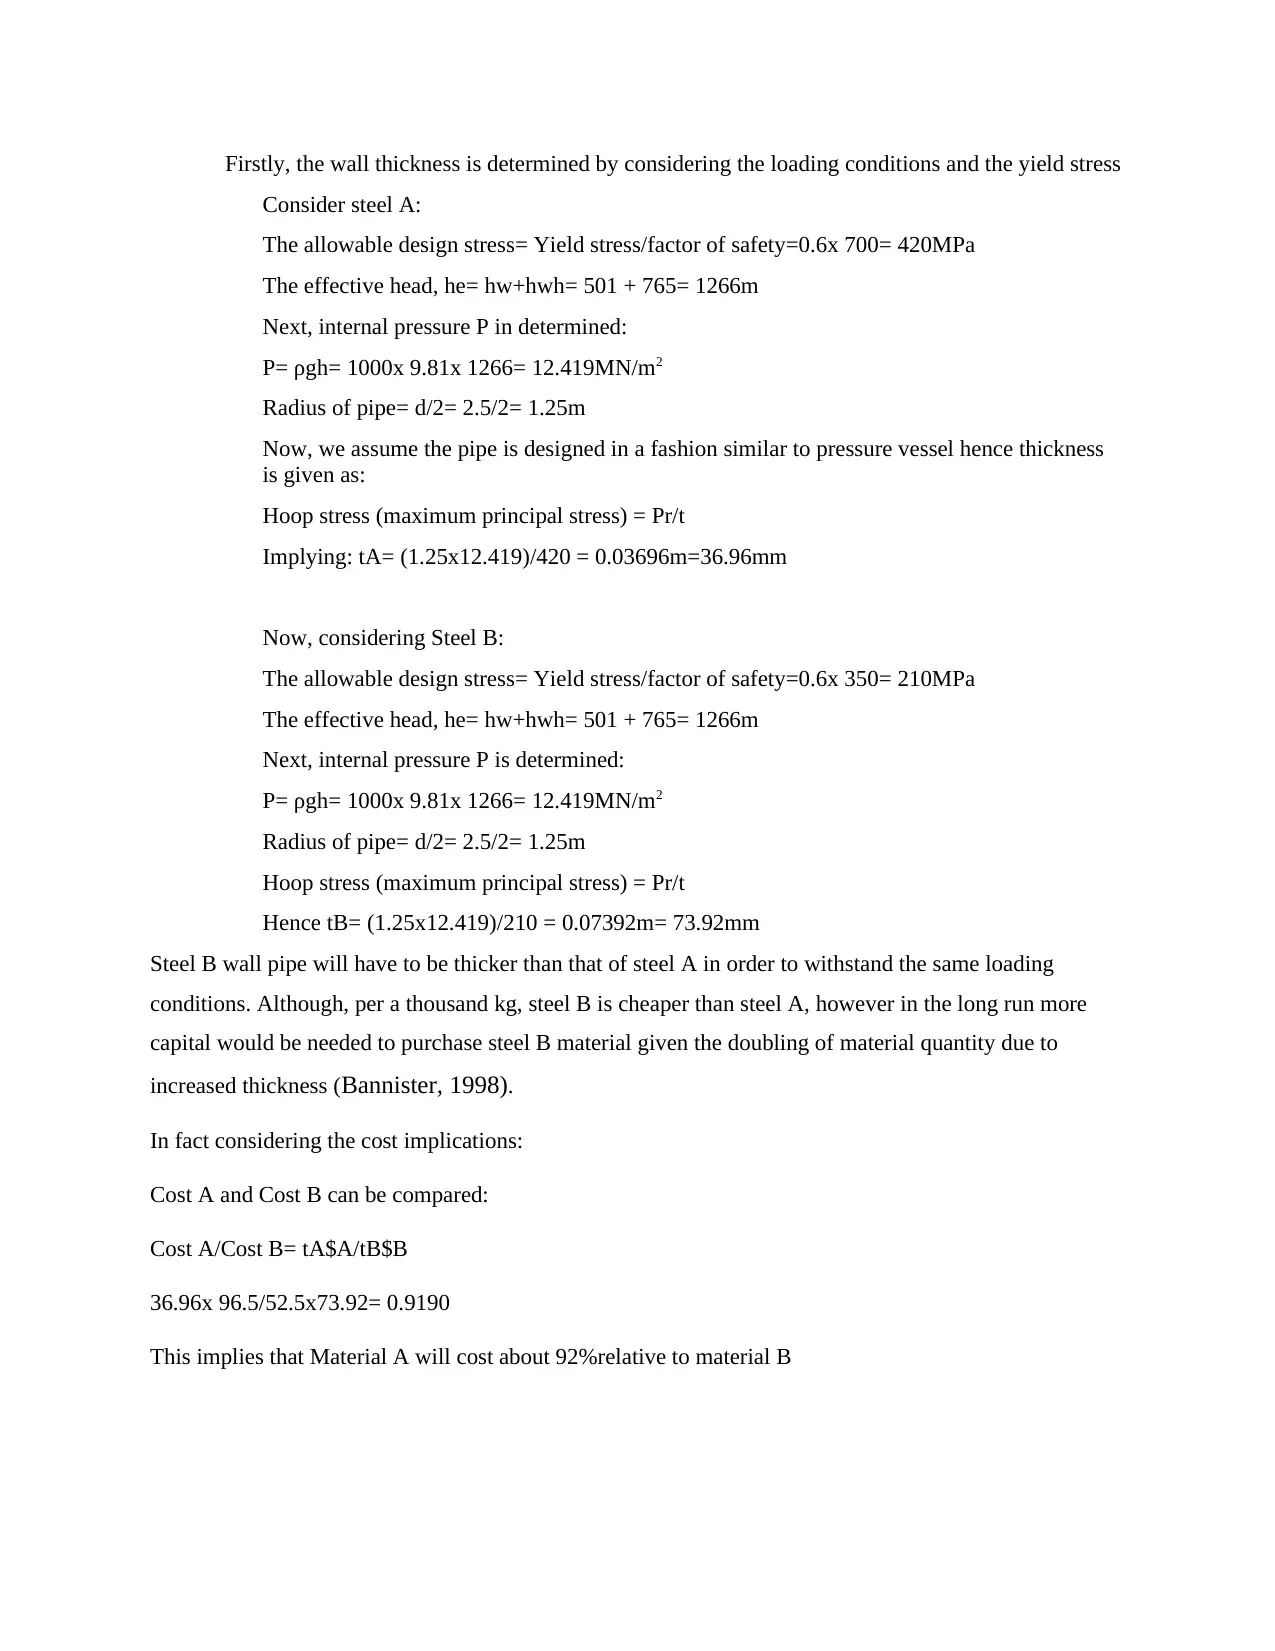
(i) The effects of cracks on the integrity of the structure using FAD is considered.
Temper
ature
(oC)
24 0 -20 -35 -40
0
20
40
60
80
100
120
Charpy Energy (J)
Kc (Fracture toughness
Figure 1: Charpy energy and facture toughness for Steel A
Temper
ature
(oC)
24 0 -20 -35 -40
0
20
40
60
80
100
120
140
Charpy Energy (J)
Kc(Fracture toughness)
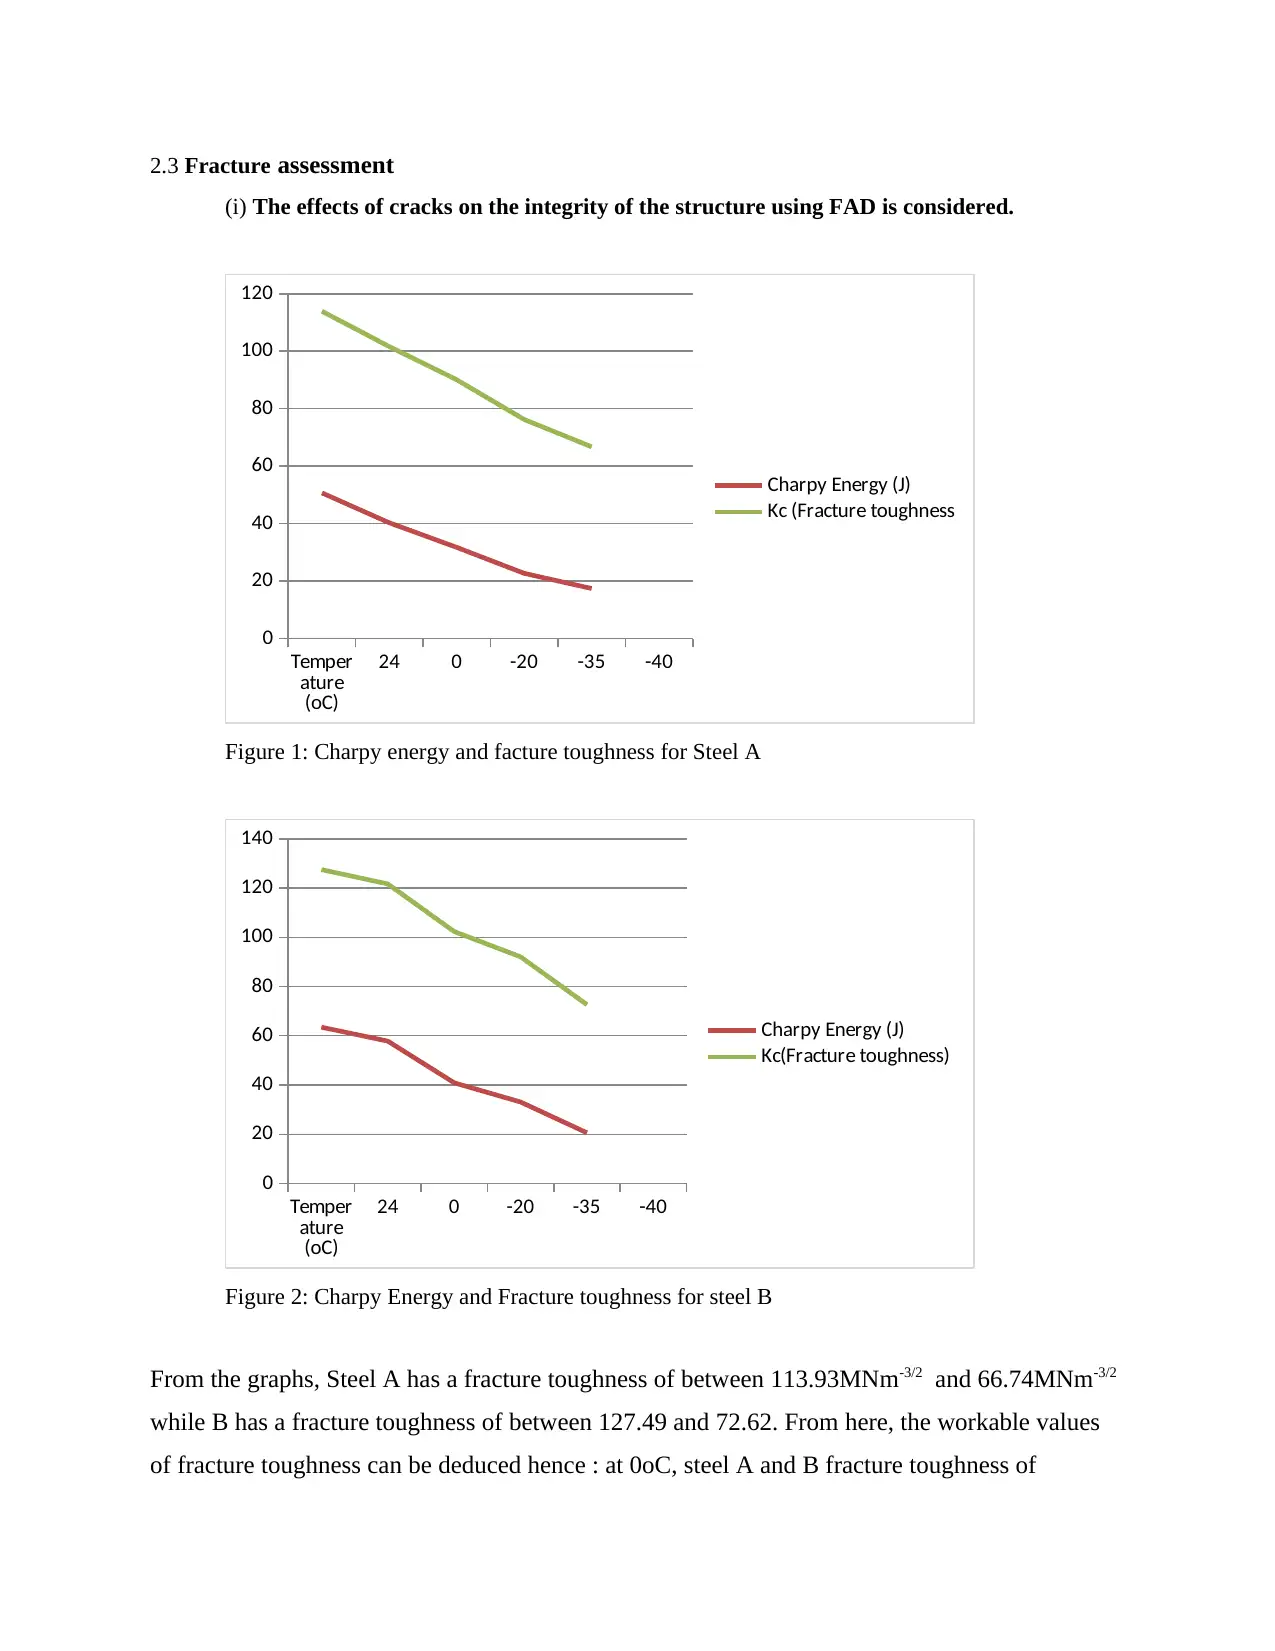
Figure 2: Charpy Energy and Fracture toughness for steel B
From the graphs, Steel A has a fracture toughness of between 113.93MNm-3/2 and 66.74MNm-3/2
while B has a fracture toughness of between 127.49 and 72.62. From here, the workable values
of fracture toughness can be deduced hence : at 0oC, steel A and B fracture toughness of
(i) The effects of cracks on the integrity of the structure using FAD is considered.
Temper
ature
(oC)
24 0 -20 -35 -40
0
20
40
60
80
100
120
Charpy Energy (J)
Kc (Fracture toughness
Figure 1: Charpy energy and facture toughness for Steel A
Temper
ature
(oC)
24 0 -20 -35 -40
0
20
40
60
80
100
120
140
Charpy Energy (J)
Kc(Fracture toughness)
Figure 2: Charpy Energy and Fracture toughness for steel B
From the graphs, Steel A has a fracture toughness of between 113.93MNm-3/2 and 66.74MNm-3/2
while B has a fracture toughness of between 127.49 and 72.62. From here, the workable values
of fracture toughness can be deduced hence : at 0oC, steel A and B fracture toughness of
⊘ This is a preview!⊘
Do you want full access?
Subscribe today to unlock all pages.
Trusted by 1+ million students worldwide
102MNm-3/2 and 128MNm-3/2 respectively. Therefore, it can be said that steel A is less tough
given the design values. It should be noted that in arriving at the fracture toughness values, te
following equation was used: Kc= 16(Cv)0.5
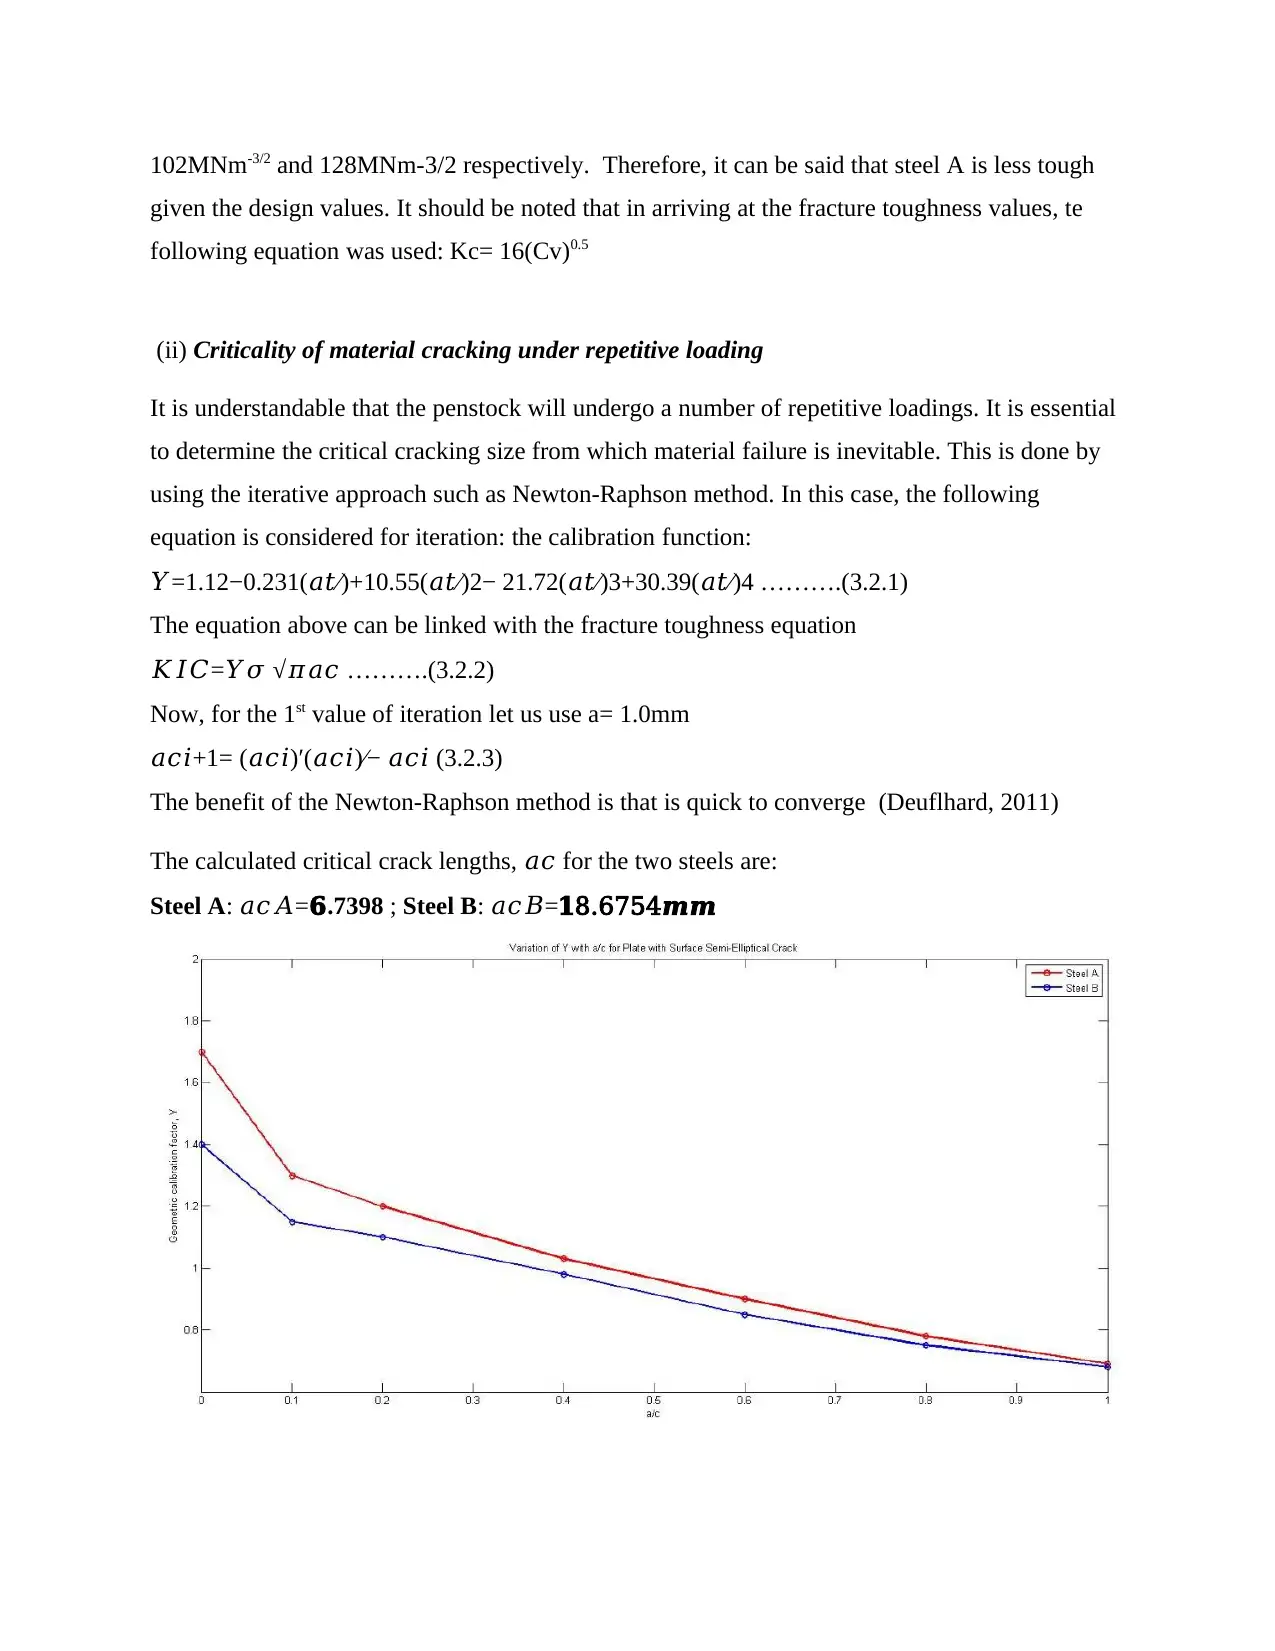
(ii) Criticality of material cracking under repetitive loading
It is understandable that the penstock will undergo a number of repetitive loadings. It is essential
to determine the critical cracking size from which material failure is inevitable. This is done by
using the iterative approach such as Newton-Raphson method. In this case, the following
equation is considered for iteration: the calibration function:
𝑌=1.12−0.231(𝑎𝑡⁄)+10.55(𝑎𝑡⁄)2− 21.72(𝑎𝑡⁄)3+30.39(𝑎𝑡⁄)4 ……….(3.2.1)
The equation above can be linked with the fracture toughness equation
𝐾𝐼𝐶=𝑌𝜎 √𝜋𝑎𝑐 ……….(3.2.2)
Now, for the 1st value of iteration let us use a= 1.0mm
𝑎𝑐𝑖+1= (𝑎𝑐𝑖)′(𝑎𝑐𝑖)⁄− 𝑎𝑐𝑖 (3.2.3)
The benefit of the Newton-Raphson method is that is quick to converge (Deuflhard, 2011)
The calculated critical crack lengths, 𝑎𝑐 for the two steels are:
Steel A: 𝑎𝑐𝐴=𝟔.7398 ; Steel B: 𝑎𝑐𝐵=𝟏8.6754𝒎𝒎
given the design values. It should be noted that in arriving at the fracture toughness values, te
following equation was used: Kc= 16(Cv)0.5
(ii) Criticality of material cracking under repetitive loading
It is understandable that the penstock will undergo a number of repetitive loadings. It is essential
to determine the critical cracking size from which material failure is inevitable. This is done by
using the iterative approach such as Newton-Raphson method. In this case, the following
equation is considered for iteration: the calibration function:
𝑌=1.12−0.231(𝑎𝑡⁄)+10.55(𝑎𝑡⁄)2− 21.72(𝑎𝑡⁄)3+30.39(𝑎𝑡⁄)4 ……….(3.2.1)
The equation above can be linked with the fracture toughness equation
𝐾𝐼𝐶=𝑌𝜎 √𝜋𝑎𝑐 ……….(3.2.2)
Now, for the 1st value of iteration let us use a= 1.0mm
𝑎𝑐𝑖+1= (𝑎𝑐𝑖)′(𝑎𝑐𝑖)⁄− 𝑎𝑐𝑖 (3.2.3)
The benefit of the Newton-Raphson method is that is quick to converge (Deuflhard, 2011)
The calculated critical crack lengths, 𝑎𝑐 for the two steels are:
Steel A: 𝑎𝑐𝐴=𝟔.7398 ; Steel B: 𝑎𝑐𝐵=𝟏8.6754𝒎𝒎
Paraphrase This Document
Need a fresh take? Get an instant paraphrase of this document with our AI Paraphraser
Since steel B gives a much bigger value of critical crack length, it can be stated that steel
B is structurally more resilient than A in terms of fracture toughness. The critical crack
size for Steel A is 𝟔.7398 mm, which is greater than 6mm, which is the assigned
detectable flaw size. With a total crack propagation length of only 0.7398mm, steel A
may not withstand repetitive loading as the critical crack size is nearer the design value of
6mm.
(iii) NDT methods and its accuracy
Accuracy of NDT Methods:
NDT methods like ultrasonic inspection often are used to detect flaws on the surface pipe
in a real-time fashion (Bannister, 1998). At minimum, a crack size of 6mm would be
perceived and this will facilitate repairs before cracking failure supersedes. Notably, with
time, the geometry calibration factor, Y would go down as the stress intensity ratio, Kr
and load ratio, Lr both increase with crack size. Thus assessment would focus on slightly
shifting along the failure curve so that crack size can be detected earlier than that of
6mm. Normally crack propagation is rapid and would bear catastrophic results if not
checked in real time. The NDT therefore provide tools of assessment of its status.
However, the accuracy of these methods would have to be increased so that chance of
failure can be fixed at the minimum level. For instance, as mentioned, one can reduce the
detectable flaw size by half which will then significantly thwart material failure (Hudson
& Rich,1986).
(iv) Failure assessment diagram (FAD) Analysis
The geometry calibration function factor for both steel materials A and B are: 𝑌𝐴=𝟏.7398
(𝑆𝑡𝑒𝑒𝑙 𝐴) 𝑌𝐵=𝟏.3𝟕𝟓𝟗 (𝑆𝑡𝑒𝑒𝑙 𝐵)
The resulting curve has an equation given by:
Y= 1.12-0.231t+10.67t2+ 30.39t3
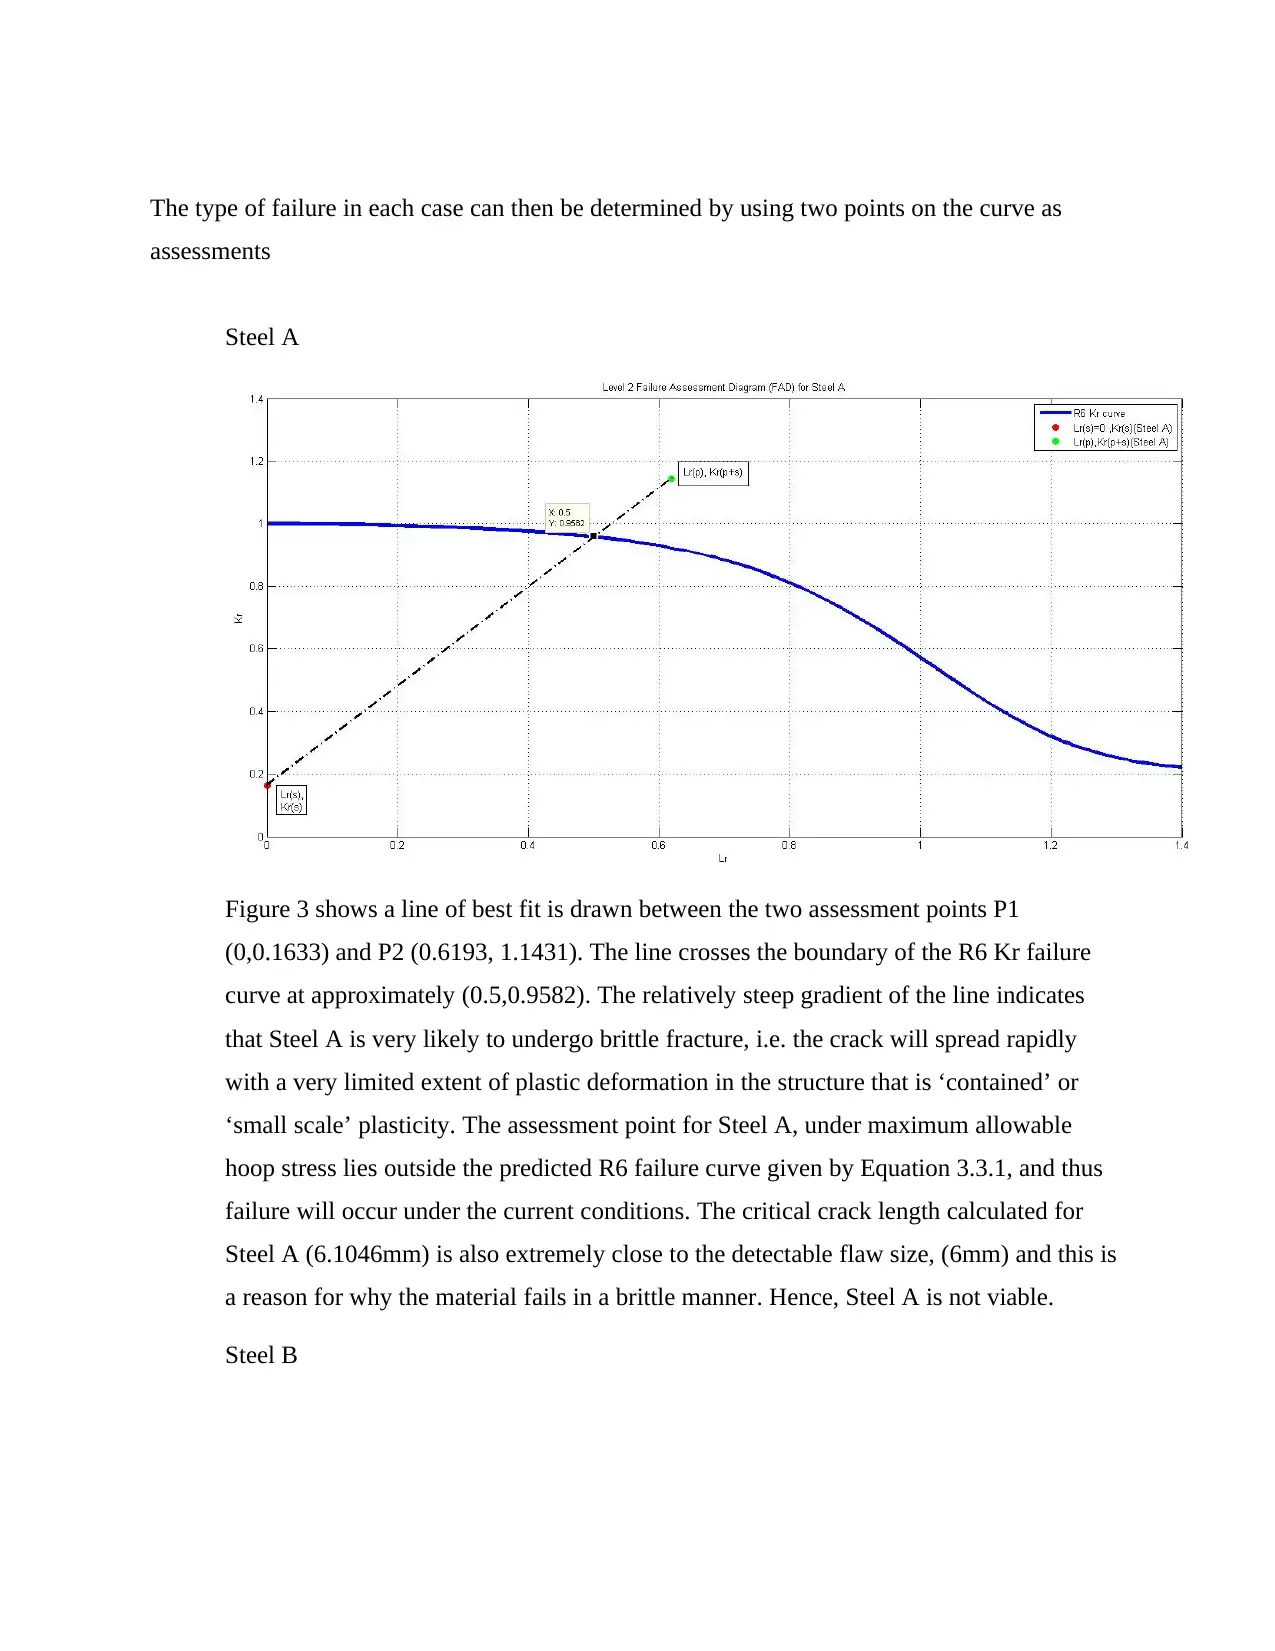
The type of failure in each case can then be determined by using two points on the curve as
assessments
Steel A
Figure 3 shows a line of best fit is drawn between the two assessment points P1
(0,0.1633) and P2 (0.6193, 1.1431). The line crosses the boundary of the R6 Kr failure
curve at approximately (0.5,0.9582). The relatively steep gradient of the line indicates
that Steel A is very likely to undergo brittle fracture, i.e. the crack will spread rapidly
with a very limited extent of plastic deformation in the structure that is ‘contained’ or
‘small scale’ plasticity. The assessment point for Steel A, under maximum allowable
hoop stress lies outside the predicted R6 failure curve given by Equation 3.3.1, and thus
failure will occur under the current conditions. The critical crack length calculated for
Steel A (6.1046mm) is also extremely close to the detectable flaw size, (6mm) and this is
a reason for why the material fails in a brittle manner. Hence, Steel A is not viable.
Steel B
⊘ This is a preview!⊘
Do you want full access?
Subscribe today to unlock all pages.
Trusted by 1+ million students worldwide
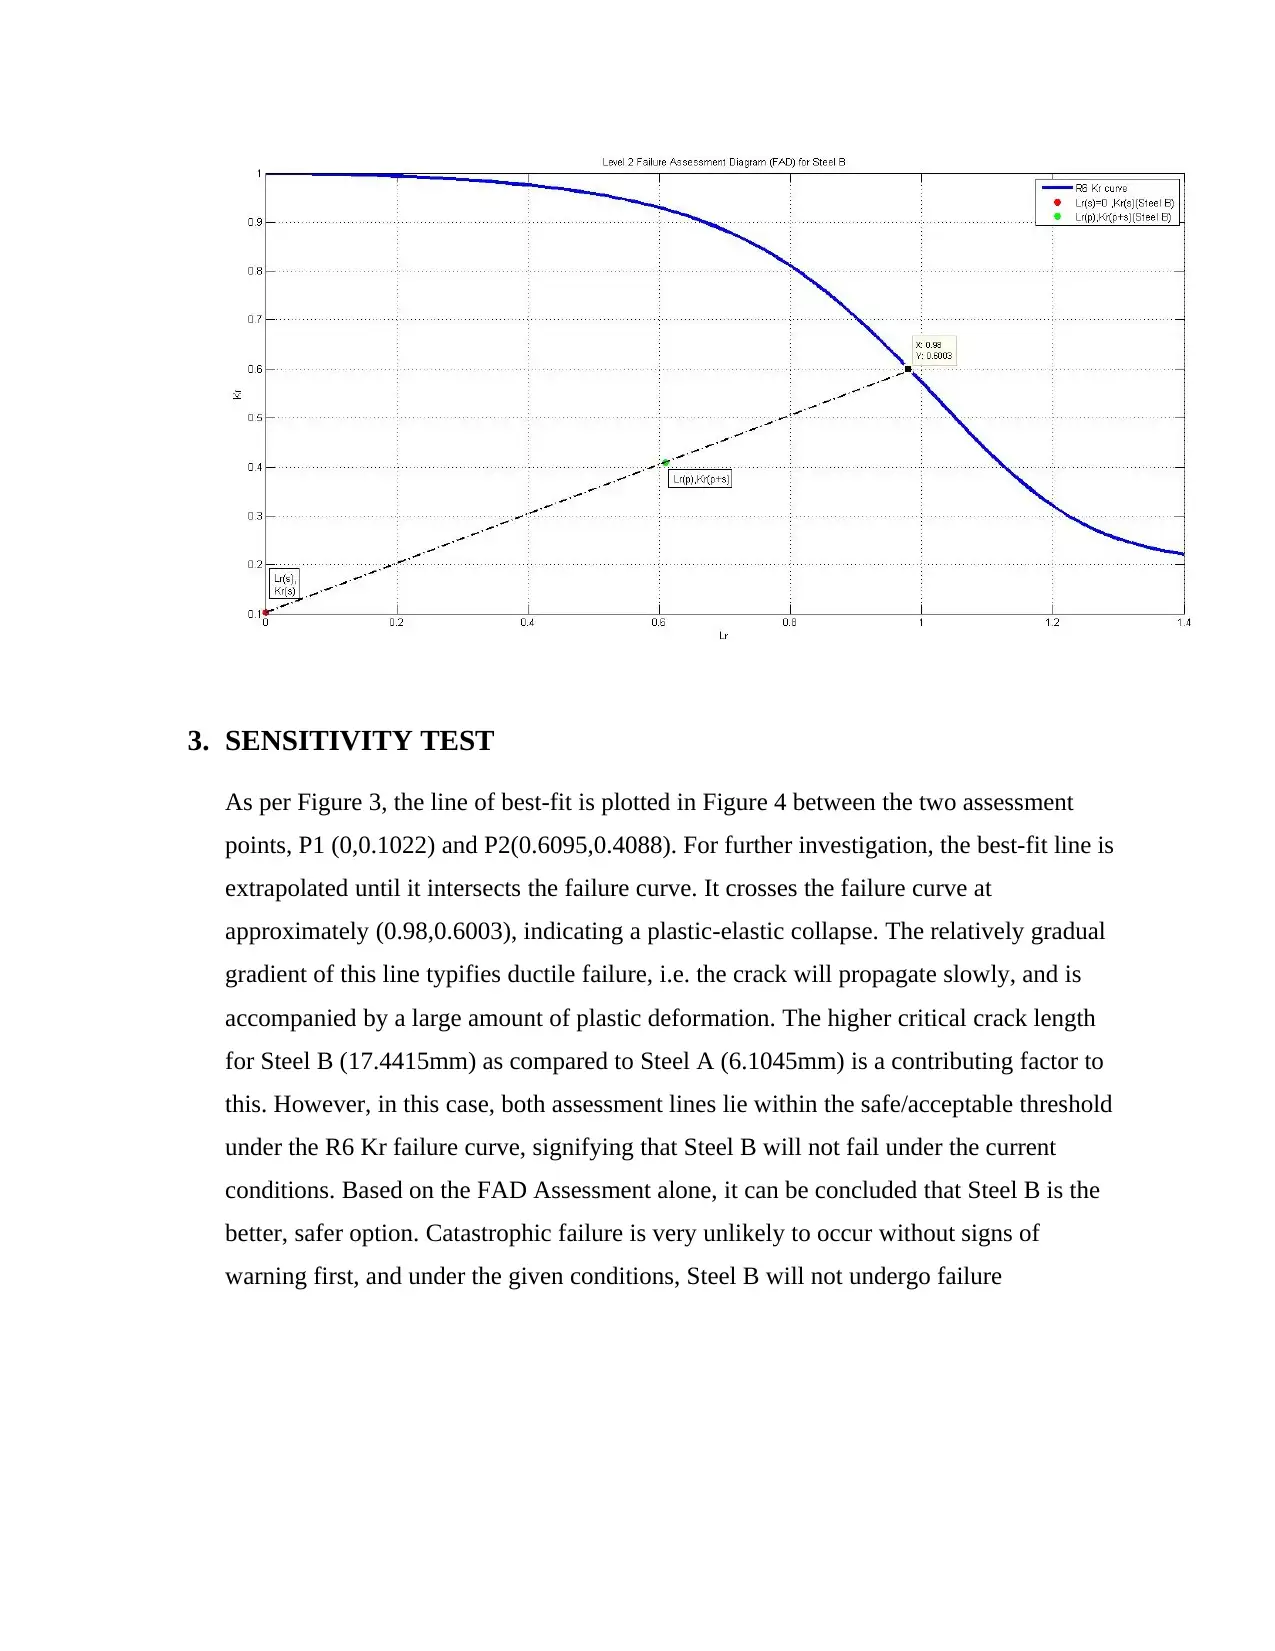
3. SENSITIVITY TEST
As per Figure 3, the line of best-fit is plotted in Figure 4 between the two assessment
points, P1 (0,0.1022) and P2(0.6095,0.4088). For further investigation, the best-fit line is
extrapolated until it intersects the failure curve. It crosses the failure curve at
approximately (0.98,0.6003), indicating a plastic-elastic collapse. The relatively gradual
gradient of this line typifies ductile failure, i.e. the crack will propagate slowly, and is
accompanied by a large amount of plastic deformation. The higher critical crack length
for Steel B (17.4415mm) as compared to Steel A (6.1045mm) is a contributing factor to
this. However, in this case, both assessment lines lie within the safe/acceptable threshold
under the R6 Kr failure curve, signifying that Steel B will not fail under the current
conditions. Based on the FAD Assessment alone, it can be concluded that Steel B is the
better, safer option. Catastrophic failure is very unlikely to occur without signs of
warning first, and under the given conditions, Steel B will not undergo failure
Paraphrase This Document
Need a fresh take? Get an instant paraphrase of this document with our AI Paraphraser
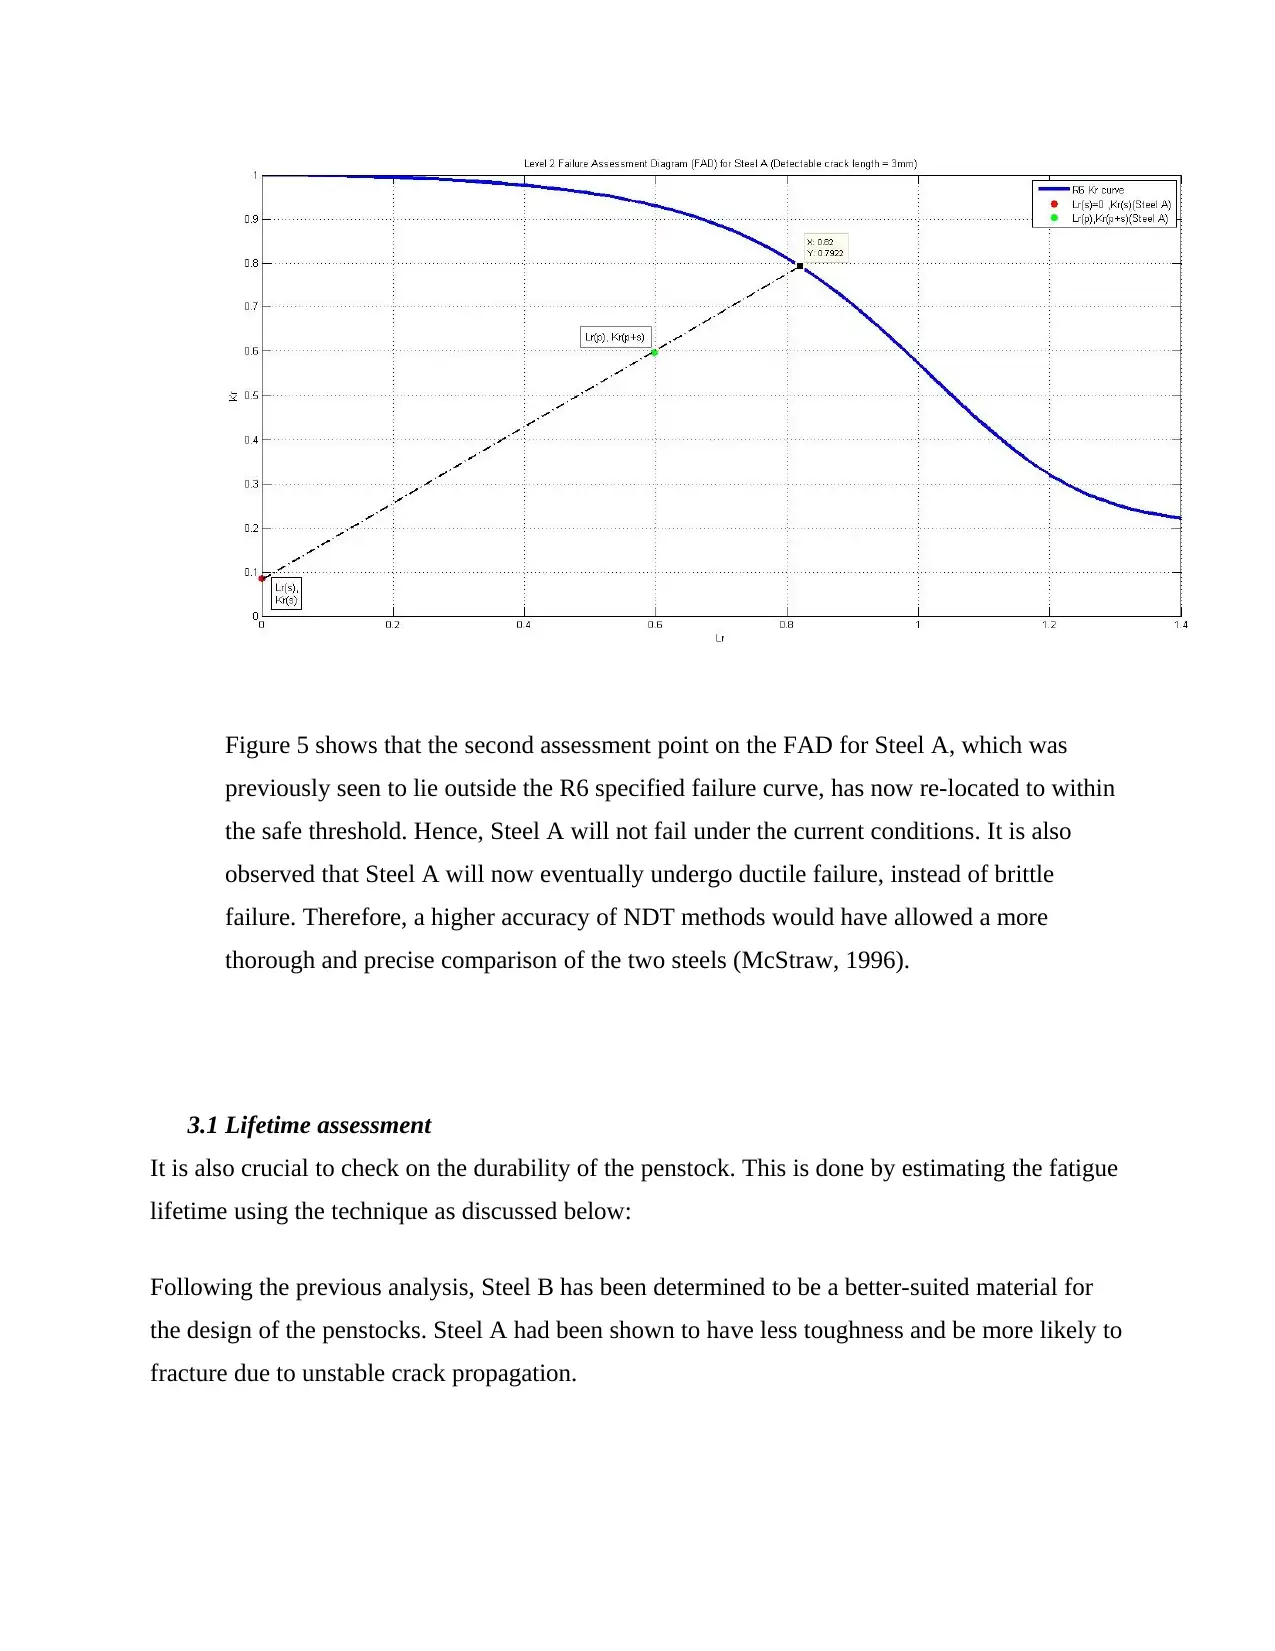
Figure 5 shows that the second assessment point on the FAD for Steel A, which was
previously seen to lie outside the R6 specified failure curve, has now re-located to within
the safe threshold. Hence, Steel A will not fail under the current conditions. It is also
observed that Steel A will now eventually undergo ductile failure, instead of brittle
failure. Therefore, a higher accuracy of NDT methods would have allowed a more
thorough and precise comparison of the two steels (McStraw, 1996).
3.1 Lifetime assessment
It is also crucial to check on the durability of the penstock. This is done by estimating the fatigue
lifetime using the technique as discussed below:
Following the previous analysis, Steel B has been determined to be a better-suited material for
the design of the penstocks. Steel A had been shown to have less toughness and be more likely to
fracture due to unstable crack propagation.
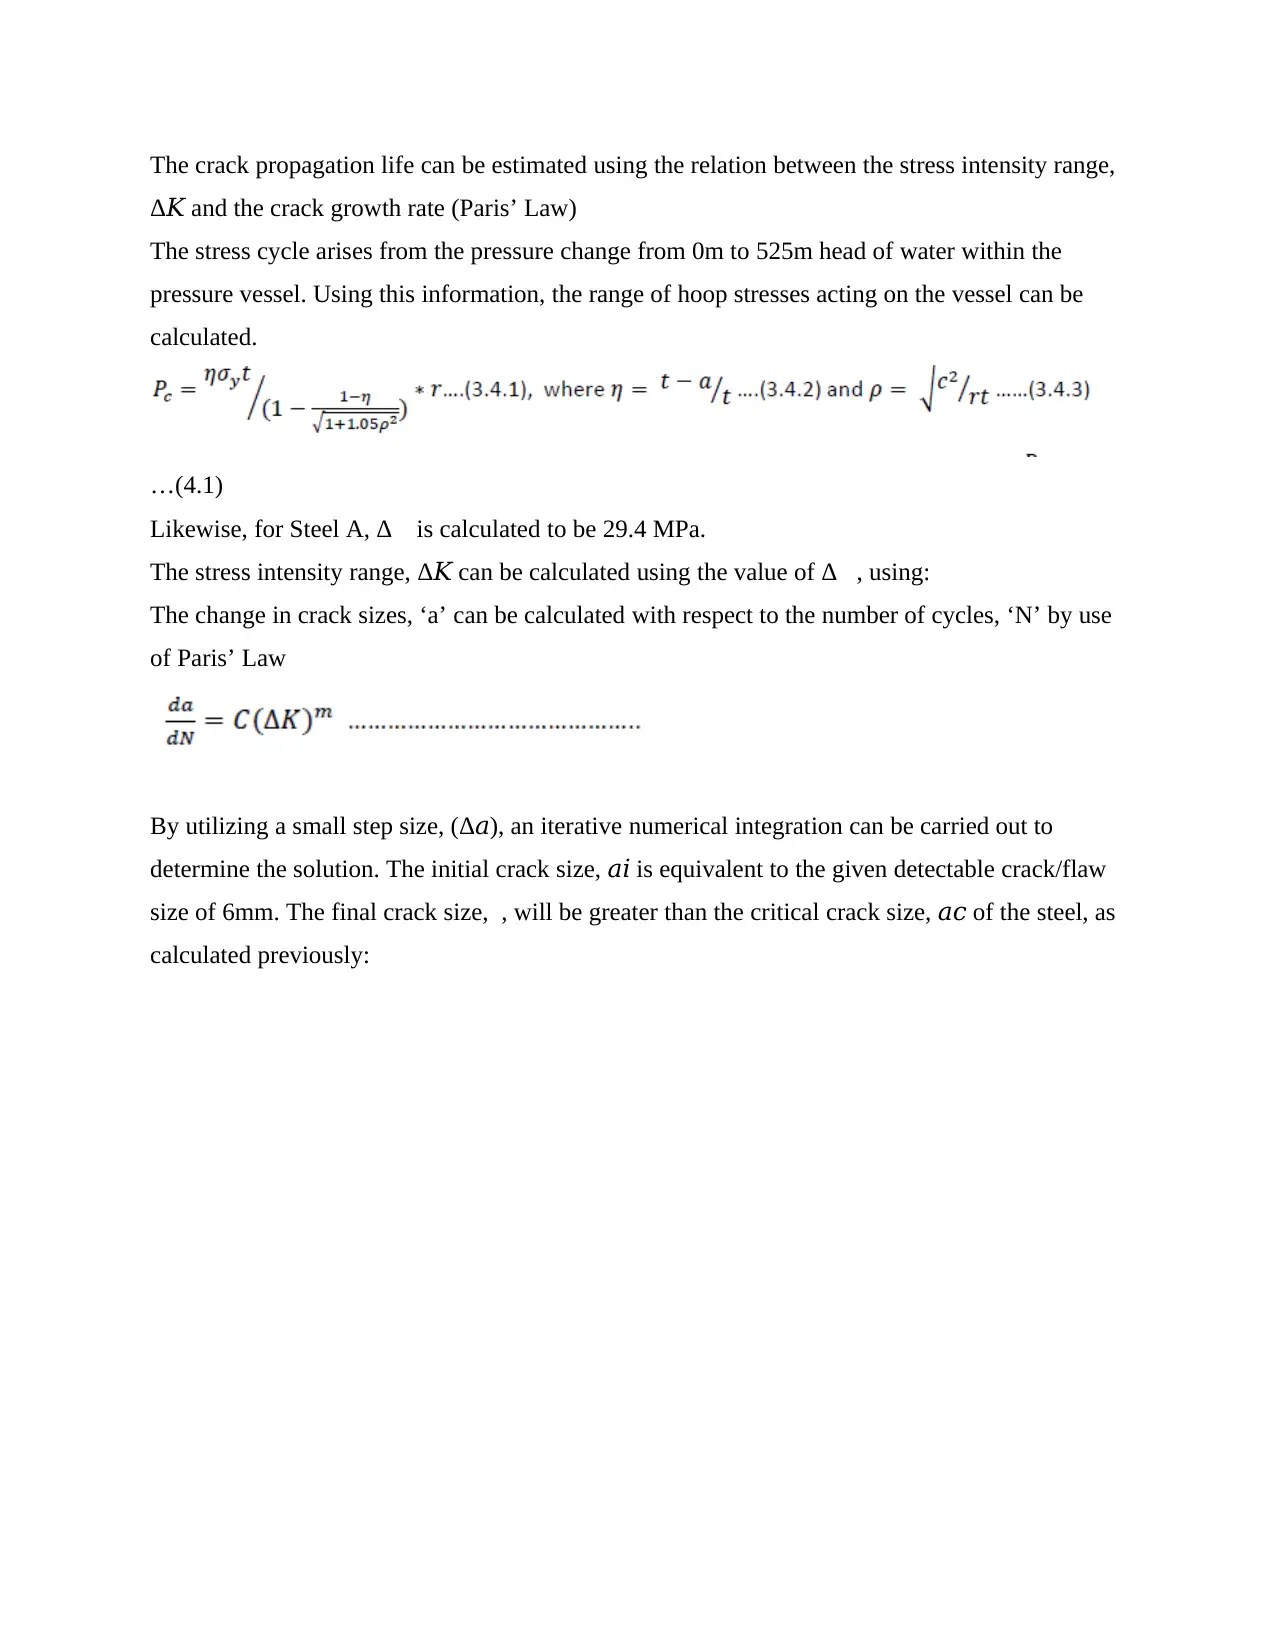
The crack propagation life can be estimated using the relation between the stress intensity range,
Δ and the crack growth rate (Paris’ Law)𝐾
The stress cycle arises from the pressure change from 0m to 525m head of water within the
pressure vessel. Using this information, the range of hoop stresses acting on the vessel can be
calculated.
…(4.1)
Likewise, for Steel A, Δ𝜎 is calculated to be 29.4 MPa.
The stress intensity range, Δ can be calculated using the value of Δ𝜎, using:𝐾
The change in crack sizes, ‘a’ can be calculated with respect to the number of cycles, ‘N’ by use
of Paris’ Law
By utilizing a small step size, (Δ ), an iterative numerical integration can be carried out to𝑎
determine the solution. The initial crack size, is equivalent to the given detectable crack/flaw𝑎𝑖
size of 6mm. The final crack size, , will be greater than the critical crack size, of the steel, as𝑎𝑐
calculated previously:
⊘ This is a preview!⊘
Do you want full access?
Subscribe today to unlock all pages.
Trusted by 1+ million students worldwide
1 out of 16

Your All-in-One AI-Powered Toolkit for Academic Success.
+13062052269
info@desklib.com
Available 24*7 on WhatsApp / Email
![[object Object]](/_next/static/media/star-bottom.7253800d.svg)
Unlock your academic potential
Copyright © 2020–2026 A2Z Services. All Rights Reserved. Developed and managed by ZUCOL.