Depreciation Analysis: Pepsi Bottling Group & Coca-Cola Enterprises
VerifiedAdded on 2023/04/21
|7
|1377
|131
Case Study
AI Summary
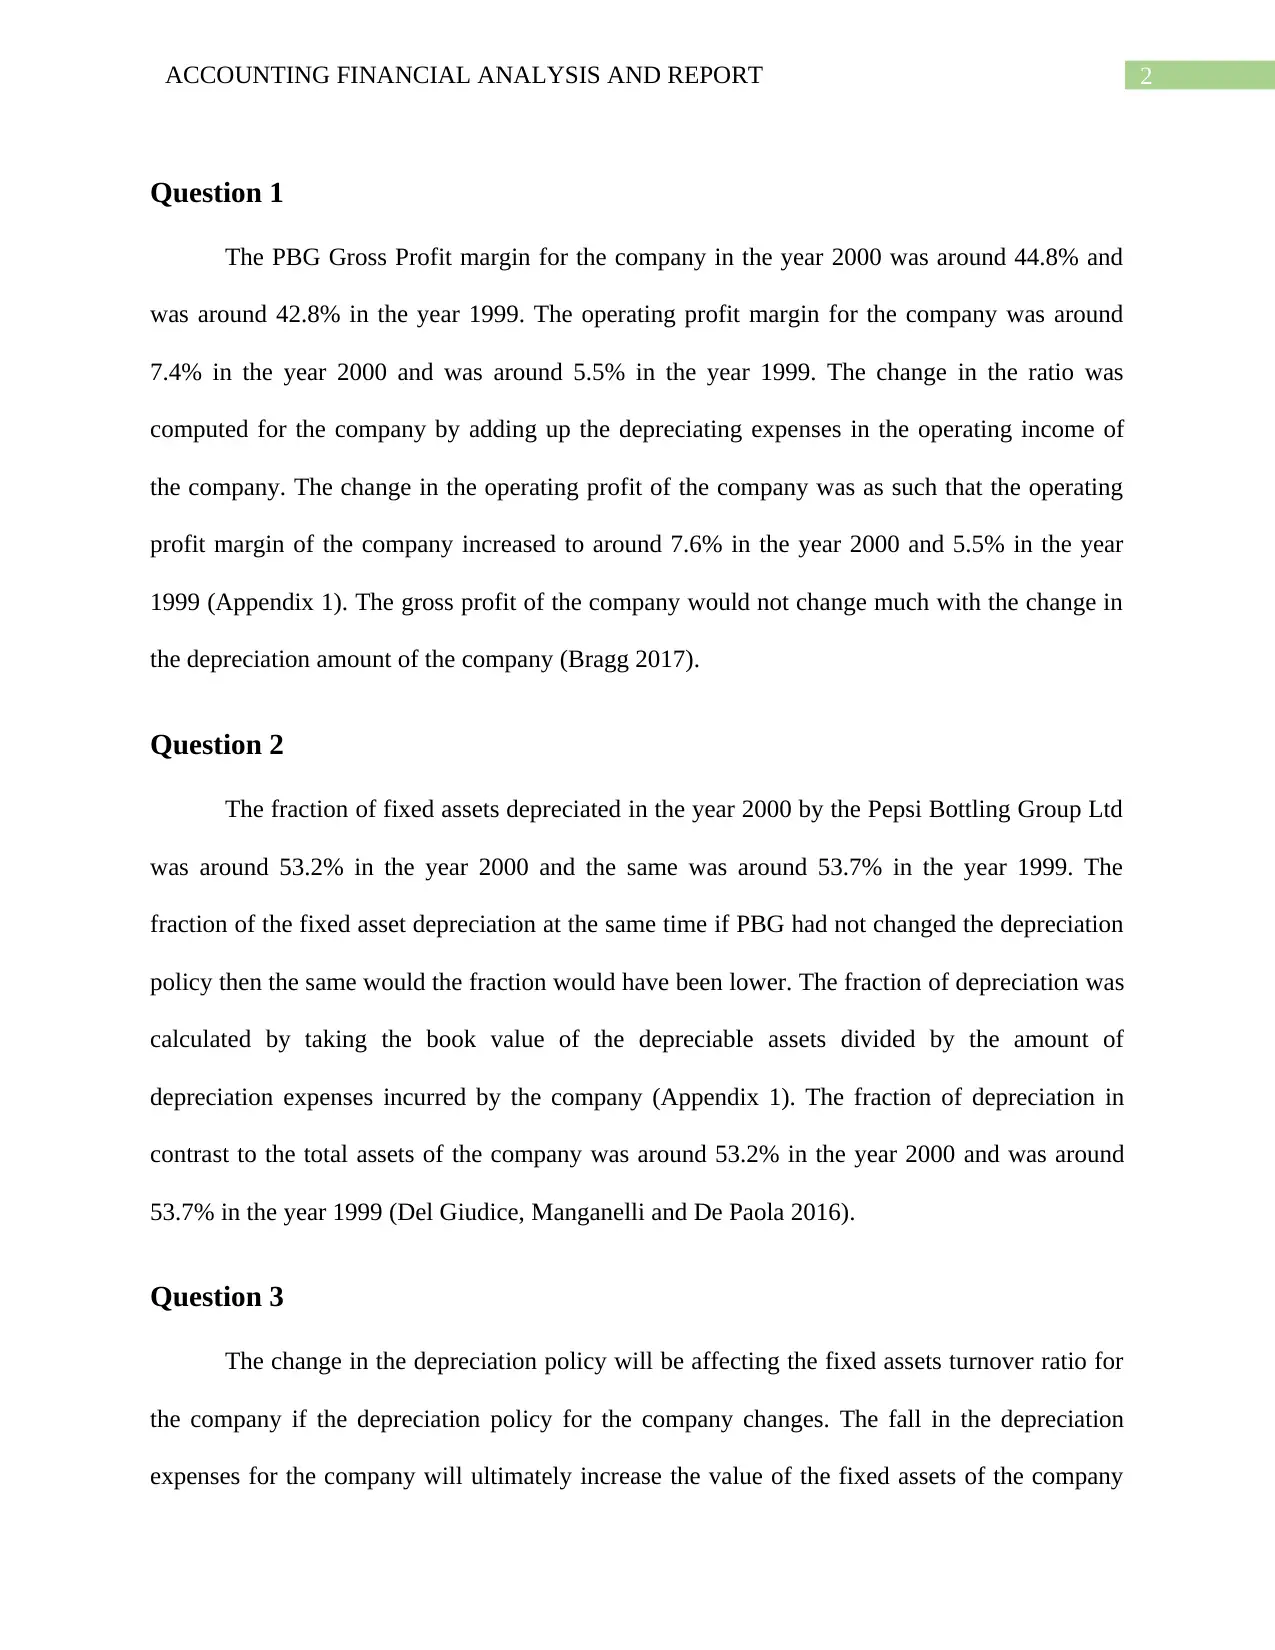
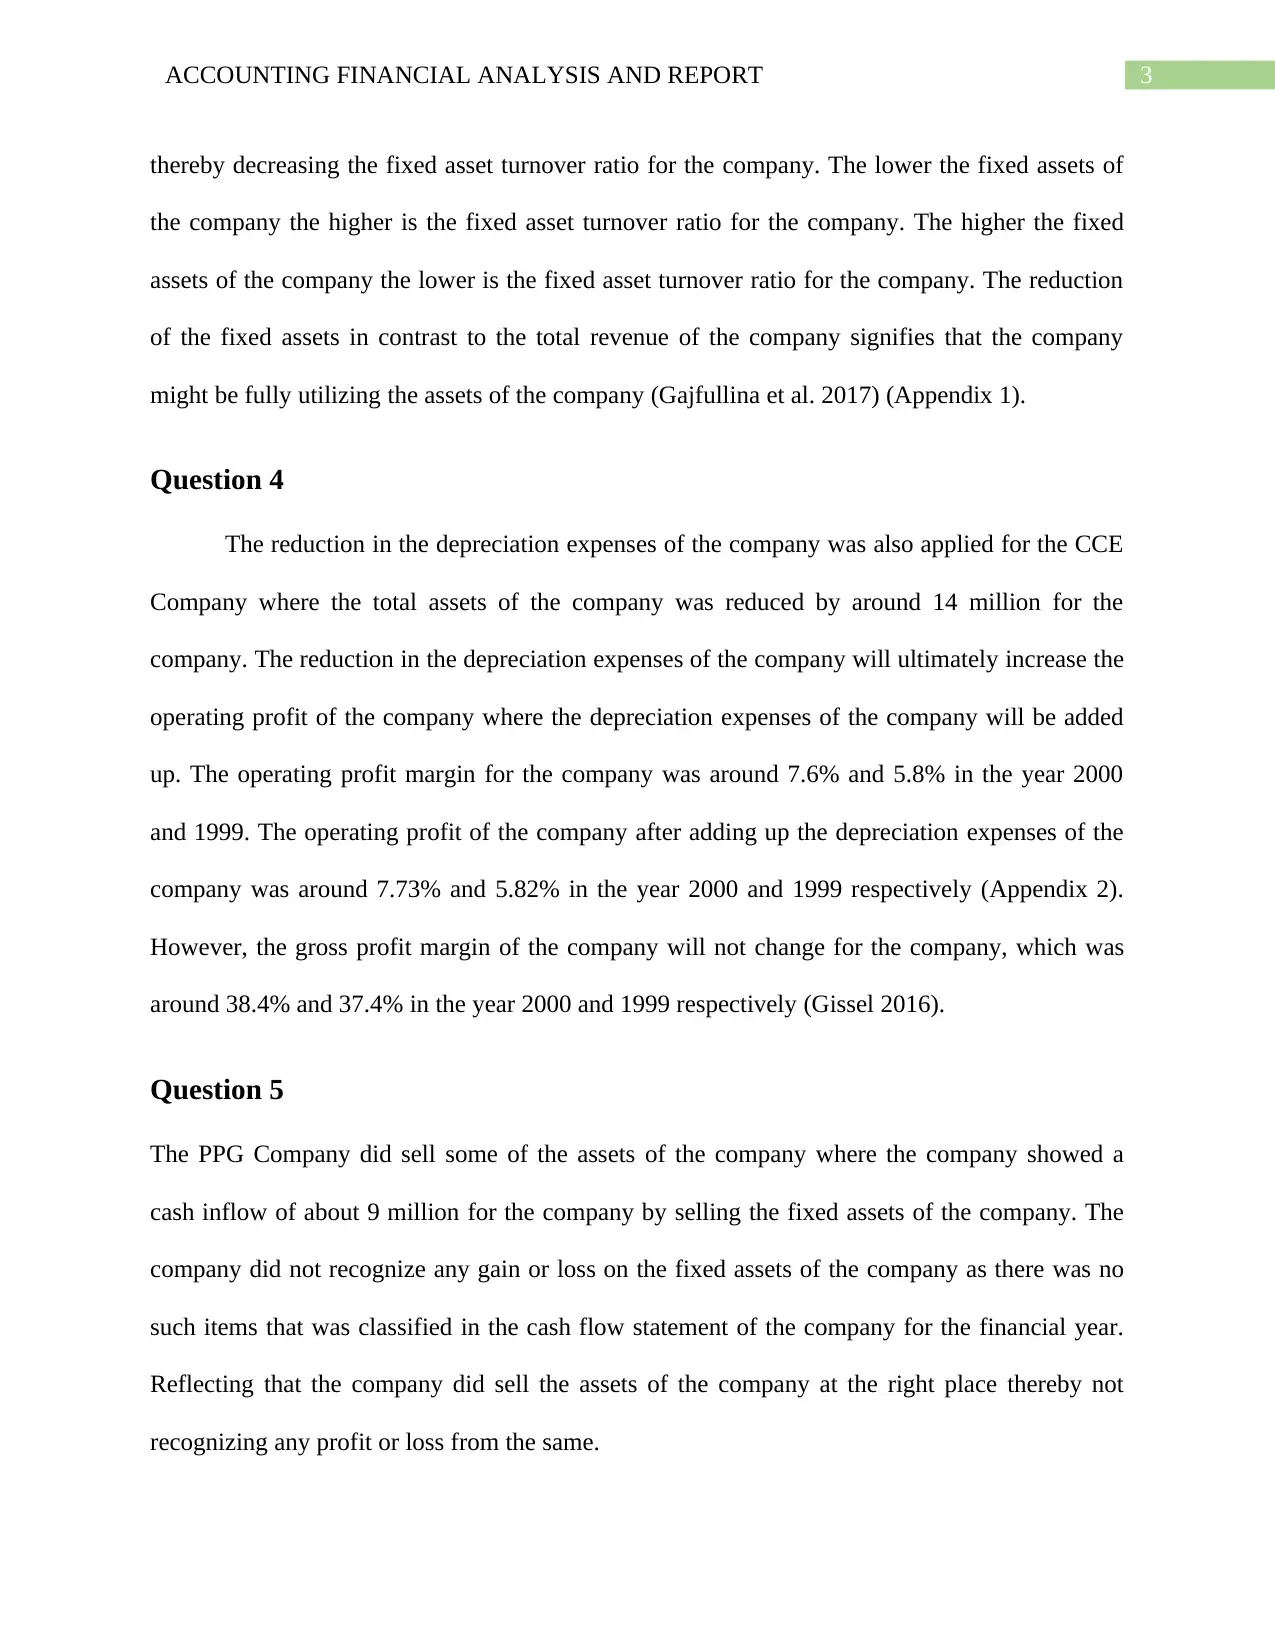
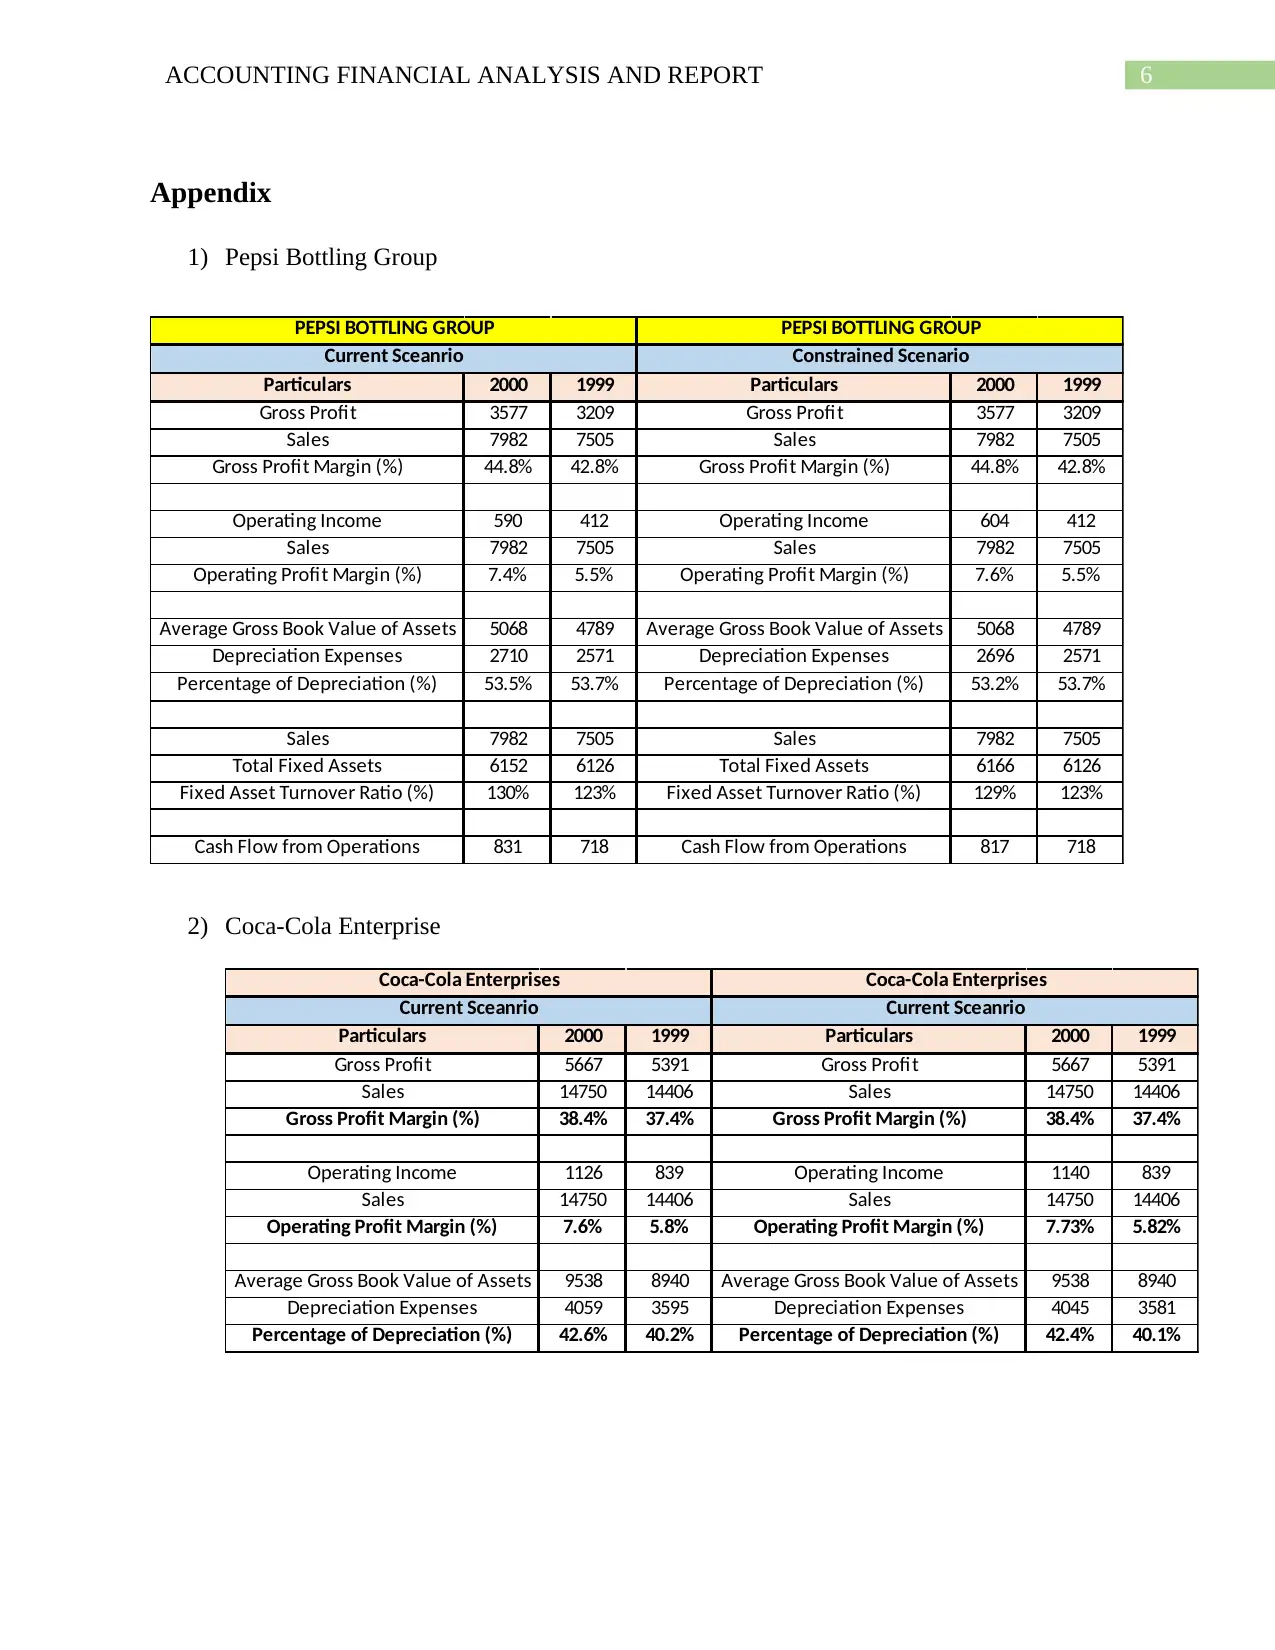
This case study provides a financial analysis of Pepsi Bottling Group (PBG) and Coca-Cola Enterprises (CCE), focusing on their depreciation policies and financial performance. It examines the impact of PBG's change in depreciation policy in 2000, analyzing its effect on gross profit margin, operating profit margin, fixed asset turnover ratio, and fraction of fixed assets depreciated. The analysis extends to CCE, assessing the impact of similar adjustments on their financial metrics. Furthermore, the case study evaluates the earnings quality of both companies based on their financial disclosures, concluding that CCE demonstrates a higher quality of earnings due to more comprehensive and transparent reporting practices. The document includes calculations and comparisons of key financial ratios for both companies, providing a detailed insight into their financial health and accounting practices. Desklib offers a platform to access such solved assignments and past papers.
1 out of 7
Related Documents


Your All-in-One AI-Powered Toolkit for Academic Success.
+13062052269
info@desklib.com
Available 24*7 on WhatsApp / Email
![[object Object]](/_next/static/media/star-bottom.7253800d.svg)
Copyright © 2020–2026 A2Z Services. All Rights Reserved. Developed and managed by ZUCOL.