Comparative Analysis of Per Capita GDP of Ten Nations - Economics
VerifiedAdded on 2022/11/18
|12
|2212
|255
Report
AI Summary
This report presents a comparative analysis of the per capita GDP of ten nations, including five rich countries (Australia, US, Sweden, South Africa, and Zimbabwe) and five poor countries (Nigeria, Ethiopia, Niger, Burundi, and Liberia). The analysis examines the GDP per capita trends from 2013 to 2017, identifying key economic and historical factors influencing their economic performance. The study investigates how factors such as trade policies, political issues, infrastructure, human capital, and global economic conditions impact GDP per capita growth. The report highlights the disparities between rich and poor nations, discusses the roles of international standards, and the impact of automation. The analysis supports the findings with data tables and figures, providing a comprehensive understanding of the economic dynamics and challenges faced by the selected countries. The report concludes by emphasizing the importance of human capital, standard of living, and access to resources in driving GDP per capita growth and calls for policy interventions to address economic inequalities.
Running head: COMPRATIVE ANALYSIS OF PER CAPITA GDP OF TEN NATIONS
Comparative Analysis of per capita GDP of Ten Nations
Name of the Student
Name of the University
Author Note
Comparative Analysis of per capita GDP of Ten Nations
Name of the Student
Name of the University
Author Note
Paraphrase This Document
Need a fresh take? Get an instant paraphrase of this document with our AI Paraphraser
1COMPRATIVE ANALYSIS OF PER CAPITA GDP OF TEN NATIONS
Abstract
The objective of this paper is to do a comparative analysis of per capita GDP of ten nations
including five rich countries and rest of the five categories are categorised as poor countries. This
study strives to identify the different influencing factors responsible for the per capita output
growth of the individual country. Finally, the findings of the paper attempts to incorporate
reliable data source to assist the purpose related to this study.

2COMPRATIVE ANALYSIS OF PER CAPITA GDP OF TEN NATIONS
Table of Contents
Introduction......................................................................................................................................3
Conclusion.......................................................................................................................................8
References........................................................................................................................................8
⊘ This is a preview!⊘
Do you want full access?
Subscribe today to unlock all pages.
Trusted by 1+ million students worldwide
3COMPRATIVE ANALYSIS OF PER CAPITA GDP OF TEN NATIONS
Introduction
GDP per capita accounts for the country’s output per person. This derives from the
division of the country’s gross domestic product by the entire population. This is considered as a
significant determinant in the case of measuring the standard of living for a nation. Meanwhile,
this measurement analyses the economic condition reflecting the economic growth of a country.
This is taken as a ubiquitous growth identifier across the world due to the simple calculation
method. The country is termed as a rich or poor on the basis of its GDP per capita. The per capita
GDP of the rich countries is relatively higher than the poor countries. The objective of this paper
is to do a comparative analysis of the per capita GDP of ten different nations including five poor
and five rich countries. These five rich countries are Australia, US, Sweden, South Africa and
Zimbabwe, whereas, the other five relatively poor nations include Nigeria, Ethiopia, Niger,
Burundi and Liberia.
Discussion
The findings of this paper completely support the fact that the GDP per capita is better in
the richer countries in relation to the poor countries. To analyse these findings the economic
background of some previous years like 1960, 1990 and 2015 needs to be discussed. During the
1960s, the countries were mostly dependent on the domestic goods and services. The affluent
countries were capable to produce enough to meet the local demand as well as the international
demand. Therefore, these countries generated huge revenue from the overseas business. On the
other hand, poor countries were majorly dependent on the imported goods from the foreign states
owing to lack of local resources. Labour were not enough skilled. Hence, these countries had to
bear the enormous amount of trade deficit. Following the 1990s, the introduction of the concept
Paraphrase This Document
Need a fresh take? Get an instant paraphrase of this document with our AI Paraphraser
4COMPRATIVE ANALYSIS OF PER CAPITA GDP OF TEN NATIONS
like open economy changed the global economic structure. The poor countries were able to
access goods from the developed countries owing to lower tariff rate on goods. However, the
incidence of brain drain was the major concern for the poor countries. A large number of skilled
labour was moved to the rich countries in order to get a sizable earnings. This resulted in the
detrimental impact on the economic development of the developing countries. The small and
medium sized companies were forced to shut down owing to incompetent quality of factors
related to the production process. Further, the producers were unable to maintain the quality of
the products as per the international standard. Therefore, the export did not get enhanced in
comparison to the import for the poor countries. In contrast, the rich countries enhanced the
development in the terms of skill development, product improvement as well as the leveraging
the overseas business. This resulted in the emerging growth inequality between the poor and rich
nations. In order to mitigate the growing inequality between poor and rich countries, some
international standards were introduced during the 2000s. The international standard focused to
provide equal growth opportunity to all nations. In this way, poor countries were able to enlarge
the export sector at the international level. Meanwhile, the introduction of automation technology
has reduced the employment growth at a significant level for the both the rich and poor countries
since 2015. As a result of that, the workforce of the poor countries was under the vulnerable
condition. This resulted in the deterioration in the GDP growth rate of the countries. As per the
study is concerned, five consecutive years, such that, 2013 to 2018 can be determined as a
considerate data base. As a consequence of rising oil price, political issues and poor employment
growth the per capita GDP has faced a downturn progress for both the rich and poor countries.
This evokes a serious concern for the global economy. The poor countries’ economic
performances majorly depend on the economic activities of the rich countries. The slower growth
5COMPRATIVE ANALYSIS OF PER CAPITA GDP OF TEN NATIONS
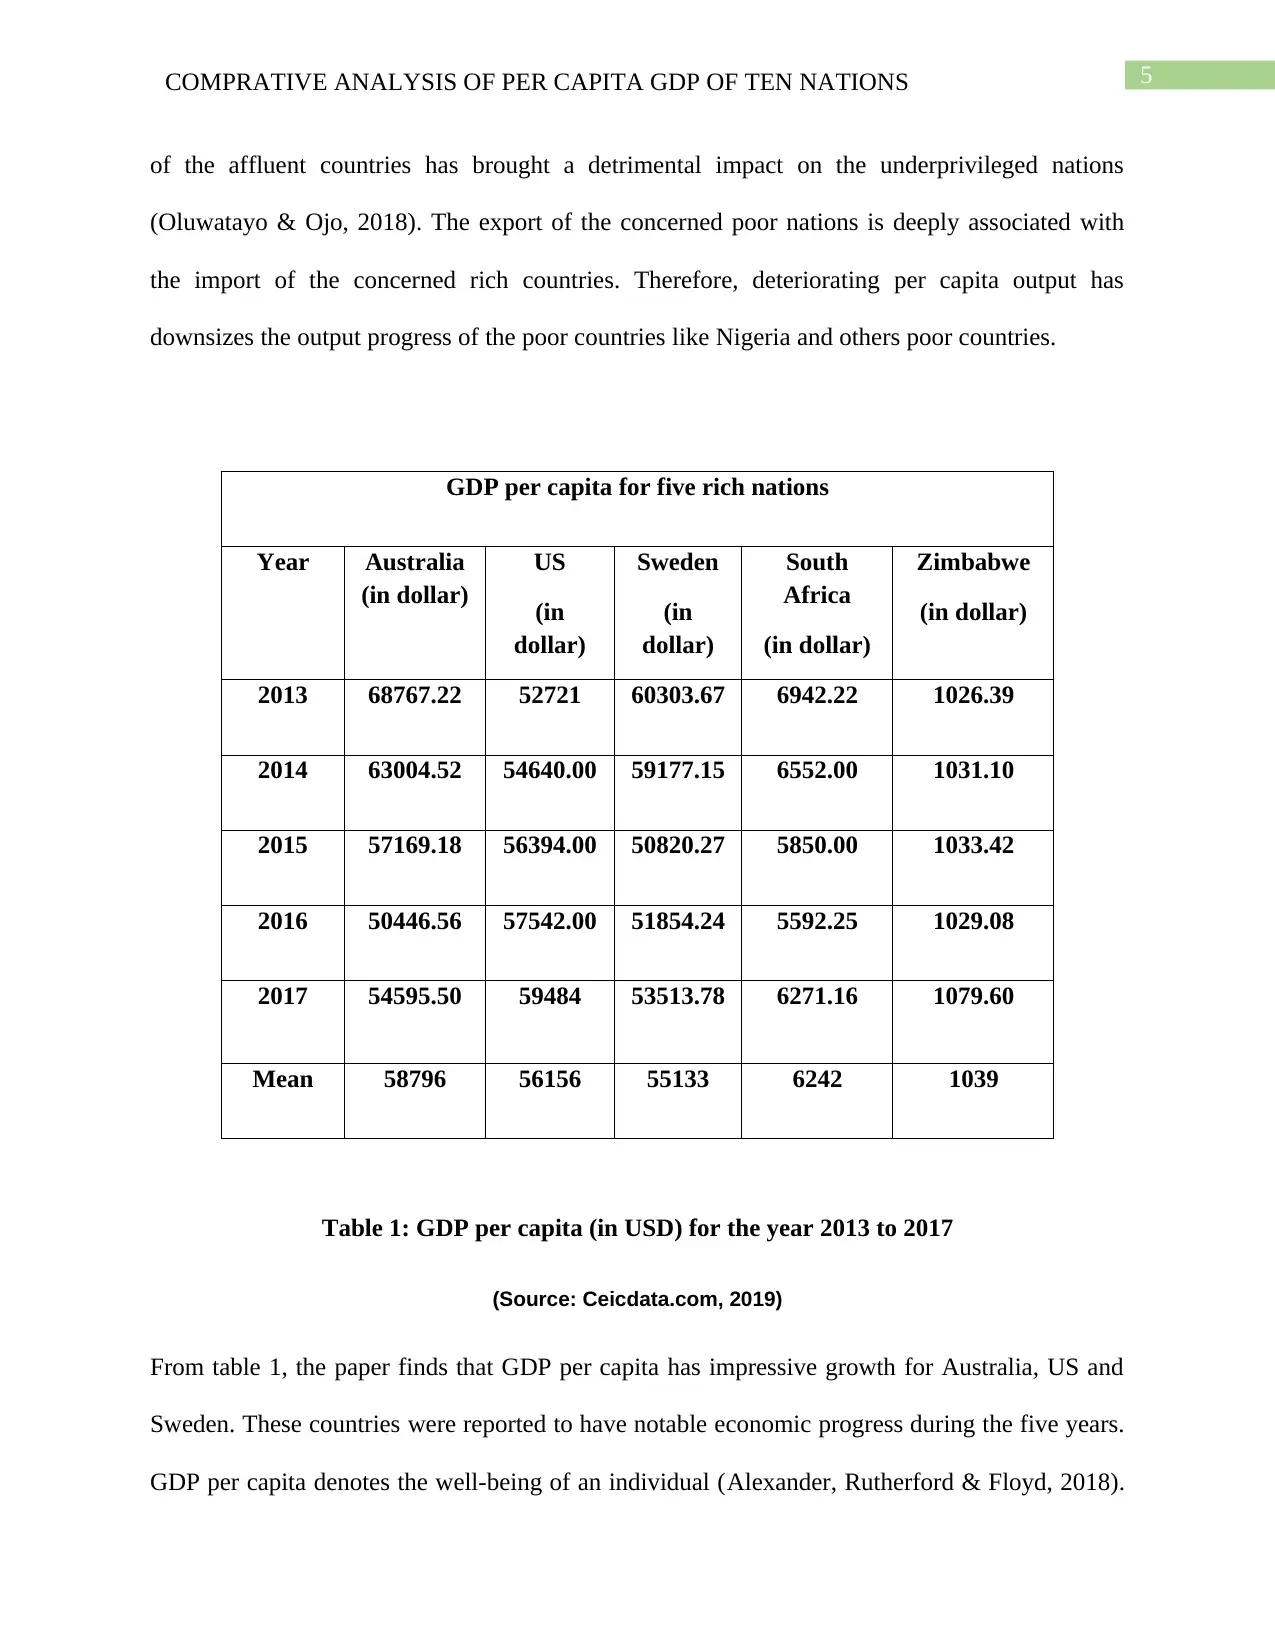
of the affluent countries has brought a detrimental impact on the underprivileged nations
(Oluwatayo & Ojo, 2018). The export of the concerned poor nations is deeply associated with
the import of the concerned rich countries. Therefore, deteriorating per capita output has
downsizes the output progress of the poor countries like Nigeria and others poor countries.
GDP per capita for five rich nations
Year Australia
(in dollar)
US
(in
dollar)
Sweden
(in
dollar)
South
Africa
(in dollar)
Zimbabwe
(in dollar)
2013 68767.22 52721 60303.67 6942.22 1026.39
2014 63004.52 54640.00 59177.15 6552.00 1031.10
2015 57169.18 56394.00 50820.27 5850.00 1033.42
2016 50446.56 57542.00 51854.24 5592.25 1029.08
2017 54595.50 59484 53513.78 6271.16 1079.60
Mean 58796 56156 55133 6242 1039
Table 1: GDP per capita (in USD) for the year 2013 to 2017
(Source: Ceicdata.com, 2019)
From table 1, the paper finds that GDP per capita has impressive growth for Australia, US and
Sweden. These countries were reported to have notable economic progress during the five years.
GDP per capita denotes the well-being of an individual (Alexander, Rutherford & Floyd, 2018).
⊘ This is a preview!⊘
Do you want full access?
Subscribe today to unlock all pages.
Trusted by 1+ million students worldwide
6COMPRATIVE ANALYSIS OF PER CAPITA GDP OF TEN NATIONS
Literacy rate, physical capital, human capital and standard of living are the key determinants.
The stagnant output growth in the Zimbabwe and South Africa is considered as a result of
emerging political issue, trade barriers, and lack of human skill. Altogether, this results in the
enhancement of the unemployment growth in the countries. The policy makers must introduce
development related policies to escalate the growth rate of the economy.
2013 2014 2015 2016 2017
0
10000
20000
30000
40000
50000
60000
70000
80000
GDP per capita trend infive rich nations
Australia US Sweden South Africa Zimbabwe
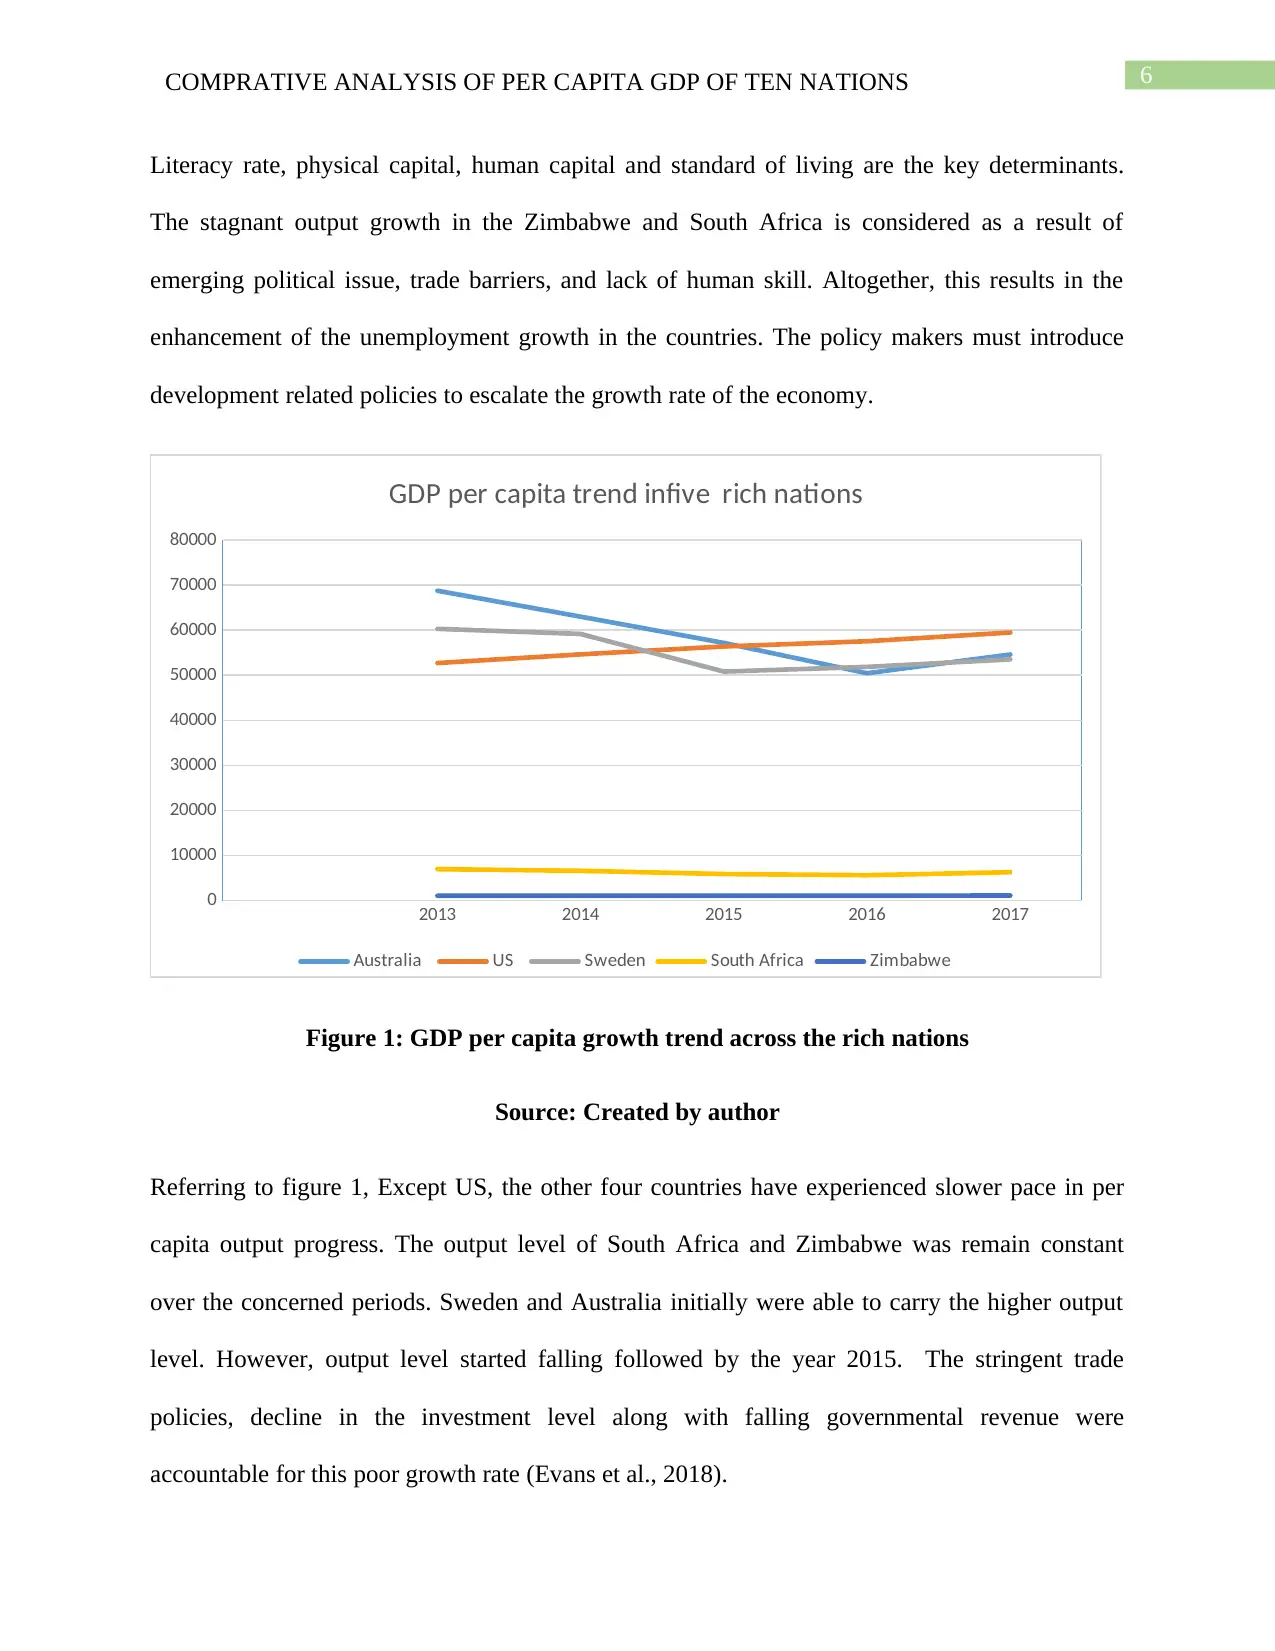
Figure 1: GDP per capita growth trend across the rich nations
Source: Created by author
Referring to figure 1, Except US, the other four countries have experienced slower pace in per
capita output progress. The output level of South Africa and Zimbabwe was remain constant
over the concerned periods. Sweden and Australia initially were able to carry the higher output
level. However, output level started falling followed by the year 2015. The stringent trade
policies, decline in the investment level along with falling governmental revenue were
accountable for this poor growth rate (Evans et al., 2018).
Literacy rate, physical capital, human capital and standard of living are the key determinants.
The stagnant output growth in the Zimbabwe and South Africa is considered as a result of
emerging political issue, trade barriers, and lack of human skill. Altogether, this results in the
enhancement of the unemployment growth in the countries. The policy makers must introduce
development related policies to escalate the growth rate of the economy.
2013 2014 2015 2016 2017
0
10000
20000
30000
40000
50000
60000
70000
80000
GDP per capita trend infive rich nations
Australia US Sweden South Africa Zimbabwe
Figure 1: GDP per capita growth trend across the rich nations
Source: Created by author
Referring to figure 1, Except US, the other four countries have experienced slower pace in per
capita output progress. The output level of South Africa and Zimbabwe was remain constant
over the concerned periods. Sweden and Australia initially were able to carry the higher output
level. However, output level started falling followed by the year 2015. The stringent trade
policies, decline in the investment level along with falling governmental revenue were
accountable for this poor growth rate (Evans et al., 2018).
Paraphrase This Document
Need a fresh take? Get an instant paraphrase of this document with our AI Paraphraser
7COMPRATIVE ANALYSIS OF PER CAPITA GDP OF TEN NATIONS
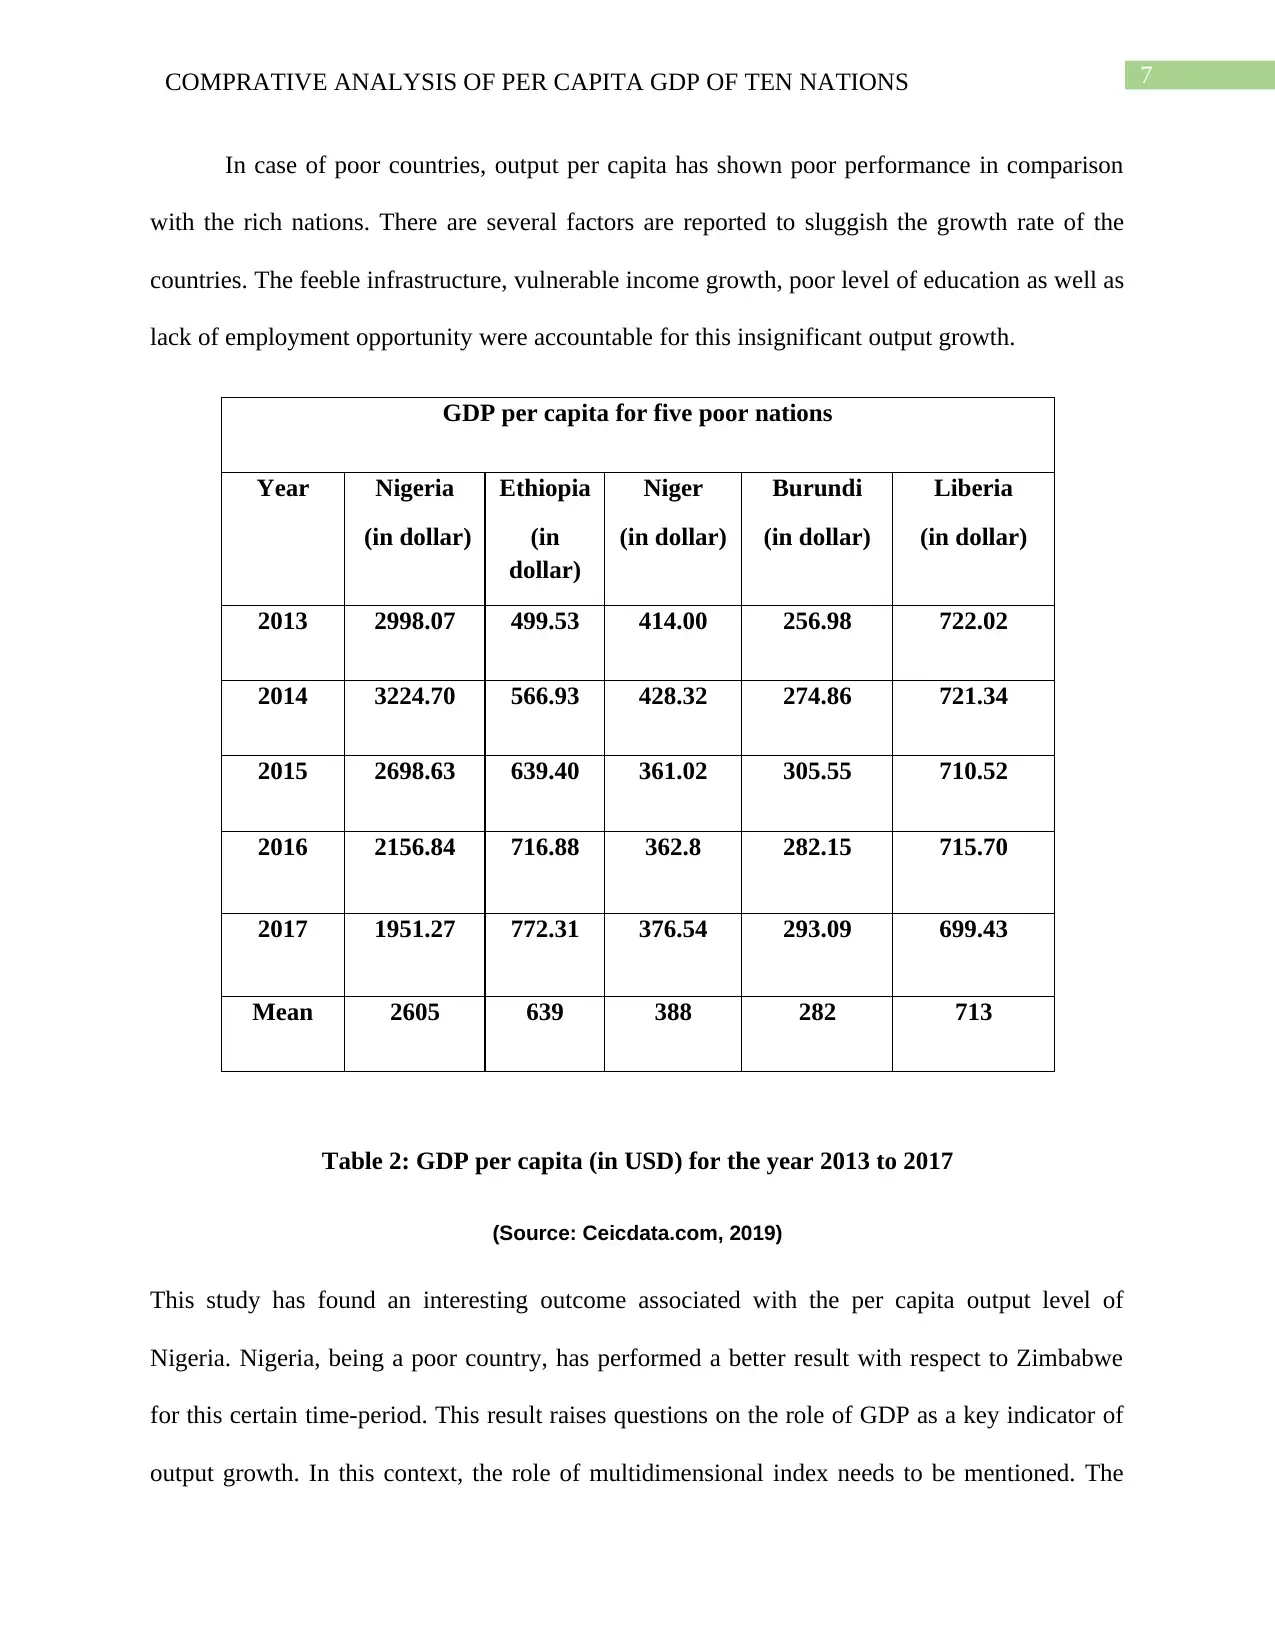
In case of poor countries, output per capita has shown poor performance in comparison
with the rich nations. There are several factors are reported to sluggish the growth rate of the
countries. The feeble infrastructure, vulnerable income growth, poor level of education as well as
lack of employment opportunity were accountable for this insignificant output growth.
GDP per capita for five poor nations
Year Nigeria
(in dollar)
Ethiopia
(in
dollar)
Niger
(in dollar)
Burundi
(in dollar)
Liberia
(in dollar)
2013 2998.07 499.53 414.00 256.98 722.02
2014 3224.70 566.93 428.32 274.86 721.34
2015 2698.63 639.40 361.02 305.55 710.52
2016 2156.84 716.88 362.8 282.15 715.70
2017 1951.27 772.31 376.54 293.09 699.43
Mean 2605 639 388 282 713
Table 2: GDP per capita (in USD) for the year 2013 to 2017
(Source: Ceicdata.com, 2019)
This study has found an interesting outcome associated with the per capita output level of
Nigeria. Nigeria, being a poor country, has performed a better result with respect to Zimbabwe
for this certain time-period. This result raises questions on the role of GDP as a key indicator of
output growth. In this context, the role of multidimensional index needs to be mentioned. The
8COMPRATIVE ANALYSIS OF PER CAPITA GDP OF TEN NATIONS
growth in output hardly measures the country’s prosperity. Welfare of a nation depends on
different types of parameters (Ogundari & Awokuse, 2018). Level of education, life expectancy
and child birth rate are the core parameters of the development measurement. Further, equal
access to the economic and natural resources measure the nation’s capability towards the
progress.
2013 2014 2015 2016 2017
0
500
1000
1500
2000
2500
3000
3500
GDP per capita for five poor nations
Nigeria Ethiopia Niger Burundi Liberia
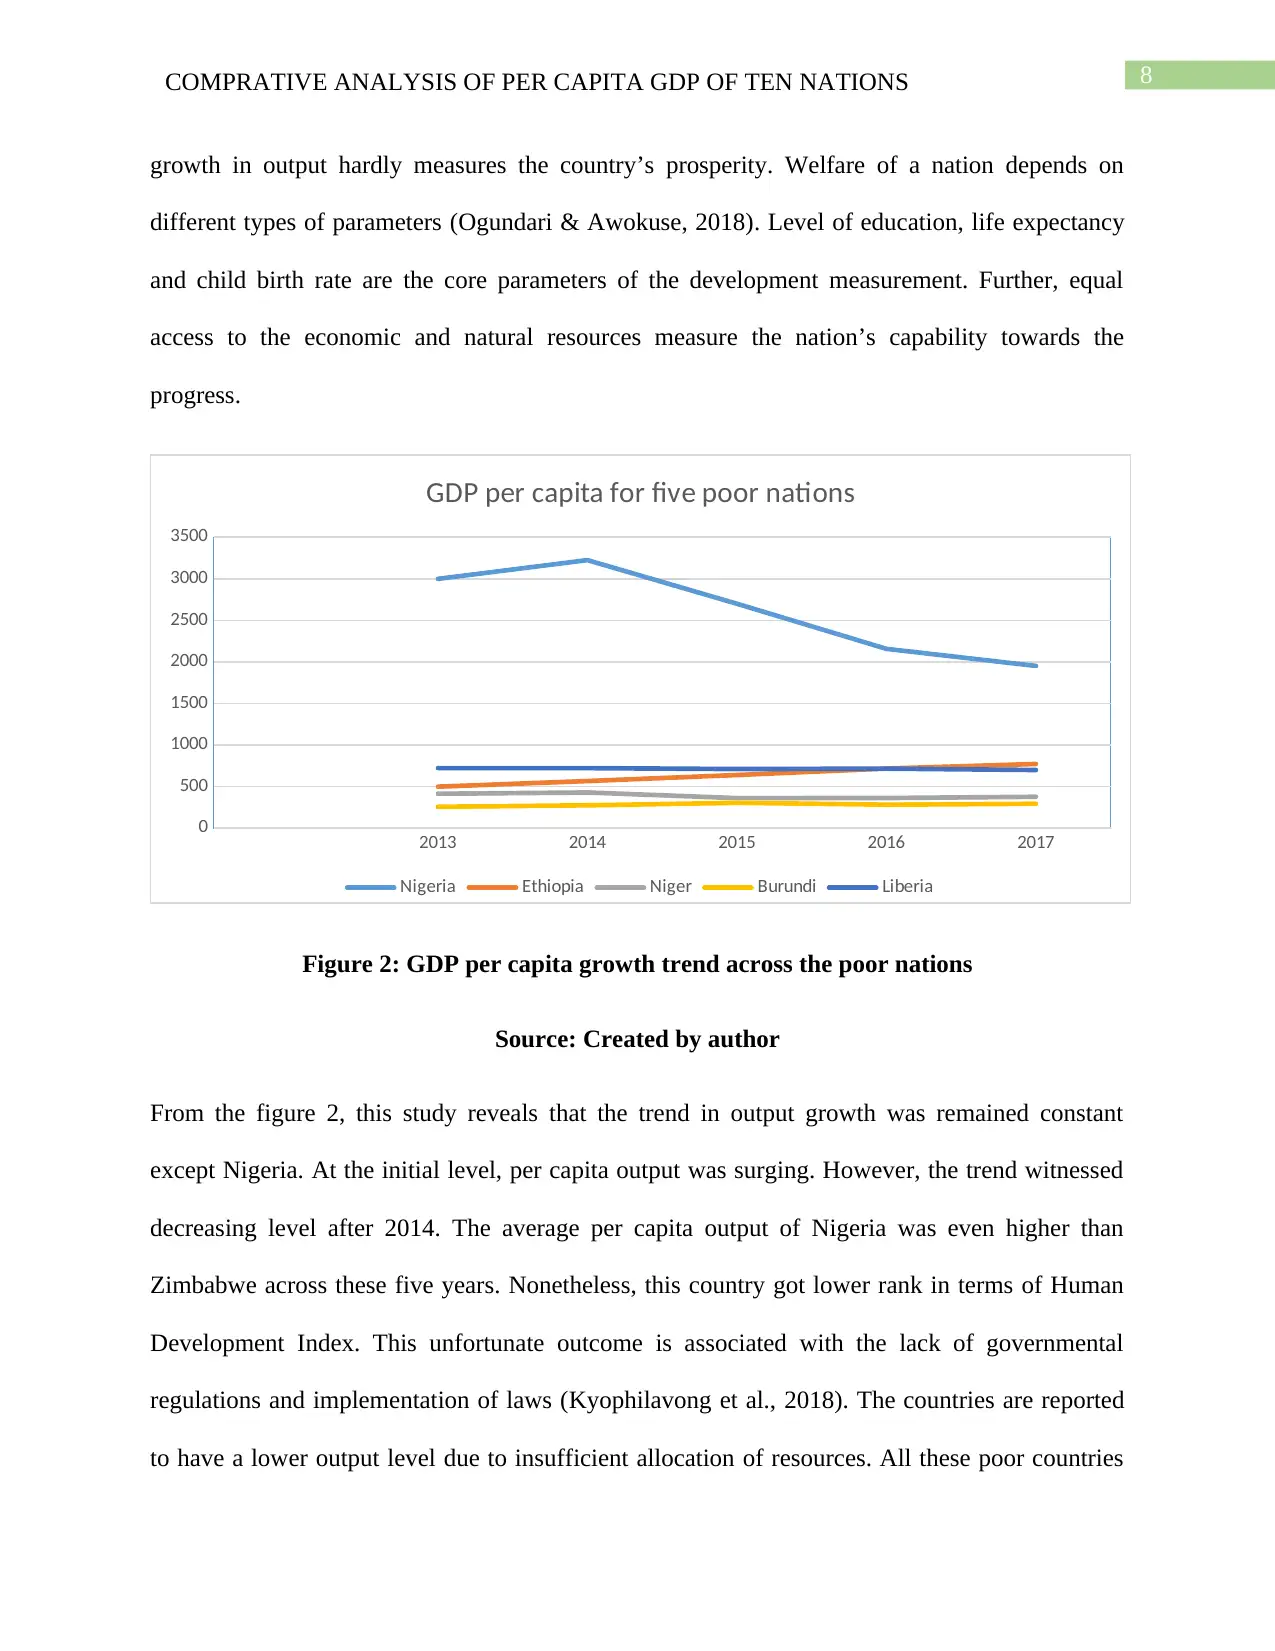
Figure 2: GDP per capita growth trend across the poor nations
Source: Created by author
From the figure 2, this study reveals that the trend in output growth was remained constant
except Nigeria. At the initial level, per capita output was surging. However, the trend witnessed
decreasing level after 2014. The average per capita output of Nigeria was even higher than
Zimbabwe across these five years. Nonetheless, this country got lower rank in terms of Human
Development Index. This unfortunate outcome is associated with the lack of governmental
regulations and implementation of laws (Kyophilavong et al., 2018). The countries are reported
to have a lower output level due to insufficient allocation of resources. All these poor countries
growth in output hardly measures the country’s prosperity. Welfare of a nation depends on
different types of parameters (Ogundari & Awokuse, 2018). Level of education, life expectancy
and child birth rate are the core parameters of the development measurement. Further, equal
access to the economic and natural resources measure the nation’s capability towards the
progress.
2013 2014 2015 2016 2017
0
500
1000
1500
2000
2500
3000
3500
GDP per capita for five poor nations
Nigeria Ethiopia Niger Burundi Liberia
Figure 2: GDP per capita growth trend across the poor nations
Source: Created by author
From the figure 2, this study reveals that the trend in output growth was remained constant
except Nigeria. At the initial level, per capita output was surging. However, the trend witnessed
decreasing level after 2014. The average per capita output of Nigeria was even higher than
Zimbabwe across these five years. Nonetheless, this country got lower rank in terms of Human
Development Index. This unfortunate outcome is associated with the lack of governmental
regulations and implementation of laws (Kyophilavong et al., 2018). The countries are reported
to have a lower output level due to insufficient allocation of resources. All these poor countries
⊘ This is a preview!⊘
Do you want full access?
Subscribe today to unlock all pages.
Trusted by 1+ million students worldwide
9COMPRATIVE ANALYSIS OF PER CAPITA GDP OF TEN NATIONS
are addressed to face income inequality within the country. Therefore, income inequality is a
rising concern for all these poor countries (Christensen, Gillingham & Nordhaus, 2018). The
equal distribution of wealth and income is a desirable output for every economy. Instead of
income equality, the economy never be able to escalate the speed of development procedure.
Conclusion
In a nutshell, the higher value of GDP per capita is not only associated with the total
output level of the country also depends on the level of human capital, standard of living and
access to the nation’s output level. All the rich countries mentioned in this paper hold a
significant top position in terms of the multidimensional development index. These affluent
countries show higher birth rate of the children as well as decreasing mortality rate. In contrast,
poor countries are registered with lower life expectancy rate and higher infant mortality rate. The
policy makers should undertake some effective measurements for poor countries in order to
achieve the per capita GDP growth rate like the rich nations.
Paraphrase This Document
Need a fresh take? Get an instant paraphrase of this document with our AI Paraphraser
10COMPRATIVE ANALYSIS OF PER CAPITA GDP OF TEN NATIONS
References
Alexander, S., Rutherford, J., & Floyd, J. (2018). A critique of the Australian national outlook
decoupling strategy: a ‘limits to growth’perspective. Ecological economics, 145(C), 10-
17.
Christensen, P., Gillingham, K., & Nordhaus, W. (2018). Uncertainty in forecasts of long-run
economic growth. Proceedings of the National Academy of Sciences, 115(21), 5409-
5414.
Ethiopia | ET: GDP: per Capita | Economic Indicators. (2019). Ceicdata.com. Retrieved 10
September 2019, from https://www.ceicdata.com/en/ethiopia/gross-domestic-product-
nominal/et-gdp-per-capita
Evans, O., Adeniji, S., Nwaogwugwu, I., Kelikume, I., Dakare, O., & Oke, O. (2018). The
relative effect of monetary and fiscal policy on economic development in Africa: a GMM
approach to the St. Louis equation. Business and Economic Quarterly, 2, 3-23.
Kyophilavong, P., Ogawa, K., Kim, B., & Nouansavanh, K. (2018). Does Education Promote
Economic Growth in Lao PDR?: Evidence From Cointegration And Granger Causality
Approaches. The Journal of Developing Areas, 52(2), 1-11.
Mukoka, S. (2018). An econometric assessment of the impact of inflation on economic growth:
A case study of Zimbabwe economy. Economics, 7(1), 17-22.
Ogundari, K., & Awokuse, T. (2018). Human capital contribution to economic growth in Sub-
Saharan Africa: Does health status matter more than education?. Economic Analysis and
Policy, 58, 131-140.
11COMPRATIVE ANALYSIS OF PER CAPITA GDP OF TEN NATIONS
Oluwatayo, I. B., & Ojo, A. O. (2018). Walking through a tightrope: The challenge of economic
growth and poverty in Africa. The Journal of Developing Areas, 52(1), 59-69.
Oluwatayo, I. B., & Ojo, A. O. (2018). Walking through a tightrope: The challenge of economic
growth and poverty in Africa. The Journal of Developing Areas, 52(1), 59-69.
⊘ This is a preview!⊘
Do you want full access?
Subscribe today to unlock all pages.
Trusted by 1+ million students worldwide
1 out of 12
Related Documents


Your All-in-One AI-Powered Toolkit for Academic Success.
+13062052269
info@desklib.com
Available 24*7 on WhatsApp / Email
![[object Object]](/_next/static/media/star-bottom.7253800d.svg)
Unlock your academic potential
Copyright © 2020–2026 A2Z Services. All Rights Reserved. Developed and managed by ZUCOL.