Performance Analysis of Commercial Bank of Dubai: A Financial Report
VerifiedAdded on 2023/01/23
|13
|3279
|60
Report
AI Summary
This report presents a performance analysis of the Commercial Bank of Dubai (CBD), evaluating its financial health through various performance measurement tools, primarily ratio analysis. The analysis includes an overview of the bank's balance sheets and income statements over a five-year period, focusing on key financial metrics such as Return on Equity (ROE), Return on Assets (ROA), net interest margin, and non-interest margin. The study breaks down ROE using the DuPont method and assesses the bank's profitability based on interest and non-interest income sources. The report examines trends in assets, liabilities, and equity, including changes in cash and cash equivalents, investments, and share capital. It also explores the bank's performance in terms of loan loss provisions and non-performing loans (NPLs), offering insights into the bank's risk profile and overall financial performance. The findings highlight the bank's reliance on non-interest income and its effectiveness in managing loan repayments.
Running head: PERFORMANCE ANALYSIS OF COMMERCIAL BANK OF DUBAI
Performance Analysis Of Commercial Bank Of Dubai
Name of the student:
Name of the University:
Author’s name:
Performance Analysis Of Commercial Bank Of Dubai
Name of the student:
Name of the University:
Author’s name:
Paraphrase This Document
Need a fresh take? Get an instant paraphrase of this document with our AI Paraphraser
1
PERFORMANCE ANALYSIS OF COMMERCIAL BANK OF DUBAI
Executive summary
The study sheds light on the performance evaluation for the Commercial Bank of Dubai. This
has been done through identifying different performance measurement tools. However, here
the ratio analysis has been used as the performance measurement tool for the bank. An over
view of their financial statement such as balance sheet and income statement has been
provided. To evaluate the profitability for the bank the ROE, ROA, non interest margin ratio
and net interest margin ratio, PLL. ALL and NPL has been calculated. Further for the better
evaluation of the performance through employing equity share, the return on equity has been
analysed through using DuPont method. The losses and the earning from the interest and non-
interest activities have been judged through which the bank’s performance and the growth
prospective have been identified.
2
PERFORMANCE ANALYSIS OF COMMERCIAL BANK OF DUBAI
Table of Contents
Introduction................................................................................................................................3
Balance sheet and income statement overview..........................................................................3
Performance analysis.................................................................................................................5
Break down of ROE...................................................................................................................7
Conclusion..................................................................................................................................8
Appendices.................................................................................................................................9
⊘ This is a preview!⊘
Do you want full access?
Subscribe today to unlock all pages.
Trusted by 1+ million students worldwide
3
PERFORMANCE ANALYSIS OF COMMERCIAL BANK OF DUBAI
Introduction
Evaluation of the financial information has been the tool of performance analysis.
This has been recognised that the performance analysis has been done through using various
analytical tools. This undertakes the financial information from the financial statements that
the company is having. For the purpose company’s balance sheet and any other financial
statements are being evaluated by the researchers and growth prospective has been analysed.
Company’s performance analysis provides a competitive advantage over the company’s
performance as this facilitates the company with having opportunity to capture loopholes and
rectify their errors, while at the same time this also improves their performance. However
with the banking industry the performance analysis refers to the evaluation of their customer
satisfaction activities and the sale of the financial products or services. Therefore, for the
better understanding of the performance evaluation the study undertakes a performance
analysis for the Commercial bank of Dubai. The study provides an over view of the balance
sheet and income statement of the bank for the five years. The study uses the analytical tool
such as ratio analysis and identifies the mean and SD of the financial information. Further the
study provides a breakdown of ROE. The study develops an over view on the profitability of
the bank and provides an opinion to the performance of the mentioned bank.
Balance sheet and income statement overview
Balance sheet:
The balance sheet provides an idea over the company’s position in the market. This
provides an idea over the value of the company. The balance sheet of the company shows an
increase in the total assets of 3.48% compared to the value at 2011 and the liquidity portion
has also increased which means the bank has been increased with the investment opportunity.
On the other hand the liability portion has also increased by 2.26%/ this refers that the bank
has generated more loans and increased the debt portion into their account (Bobryshev et al.,
Paraphrase This Document
Need a fresh take? Get an instant paraphrase of this document with our AI Paraphraser
4
PERFORMANCE ANALYSIS OF COMMERCIAL BANK OF DUBAI
2014). In the next year the assets portion has again increased however the due from bank or
the O/S has decreased by 9% in the year 2013 which means that the bank has reduced with
the collection from the customers. In the same year the property and equipment has shown a
reduction in the balance sheet compared to the previous year. This has been decreased by the
25.66% which means that the company has realised a reduction in the fixed assets portion
which has also reduced the company/bank’s valuation into the market. However with the
increase in the cash and cash equivalent balance would attract more customers as the
company has shown an increase into their liquidity position and ability to pay off the
dividend/interest (Hail, Tahoun & Wang, 2014). In the year 2014 the liquidity has decreased
as the company has realised a reduction into the cash and cash equivalent portion by 11.12%.
However, the total assets have increased by 5.48% in the same year due to increase in other
current assets. The total liability has increase in the year 2014 due to the extensive increase in
the O/S loan and Customers’ deposits and Islamic customers’ deposits. However the total
liability has increased by 4.95%. In the year 2015 the total liability has increased along with
the assets. The total assets have increased by 23.43%. However, the Cumulative changes in
fair value in the equity portion have decreased and due to this the balance sheet has shown a
negative value at 6294. In the year 2015 the Investment in associate has shown a reduction as
this has reduced by 3.02%. In the same year the capital reserve has shown a similar value in
both the 2015 and 2014 year due to which the cash dividend has also shown similar value.
This has been recognised in the year 2016 the share capital investment has been kept same as
the year 2015 however the total assets has increased by 11% and the total liability has
increased by almost at a same percentage of 11.61% which means the company either
reduced with the capability to meet the debt or could not increase the value of the company as
the liability has increased in the same rate or more than assets (Boeckx, Dossche &
Peersman, 2014).
5
PERFORMANCE ANALYSIS OF COMMERCIAL BANK OF DUBAI
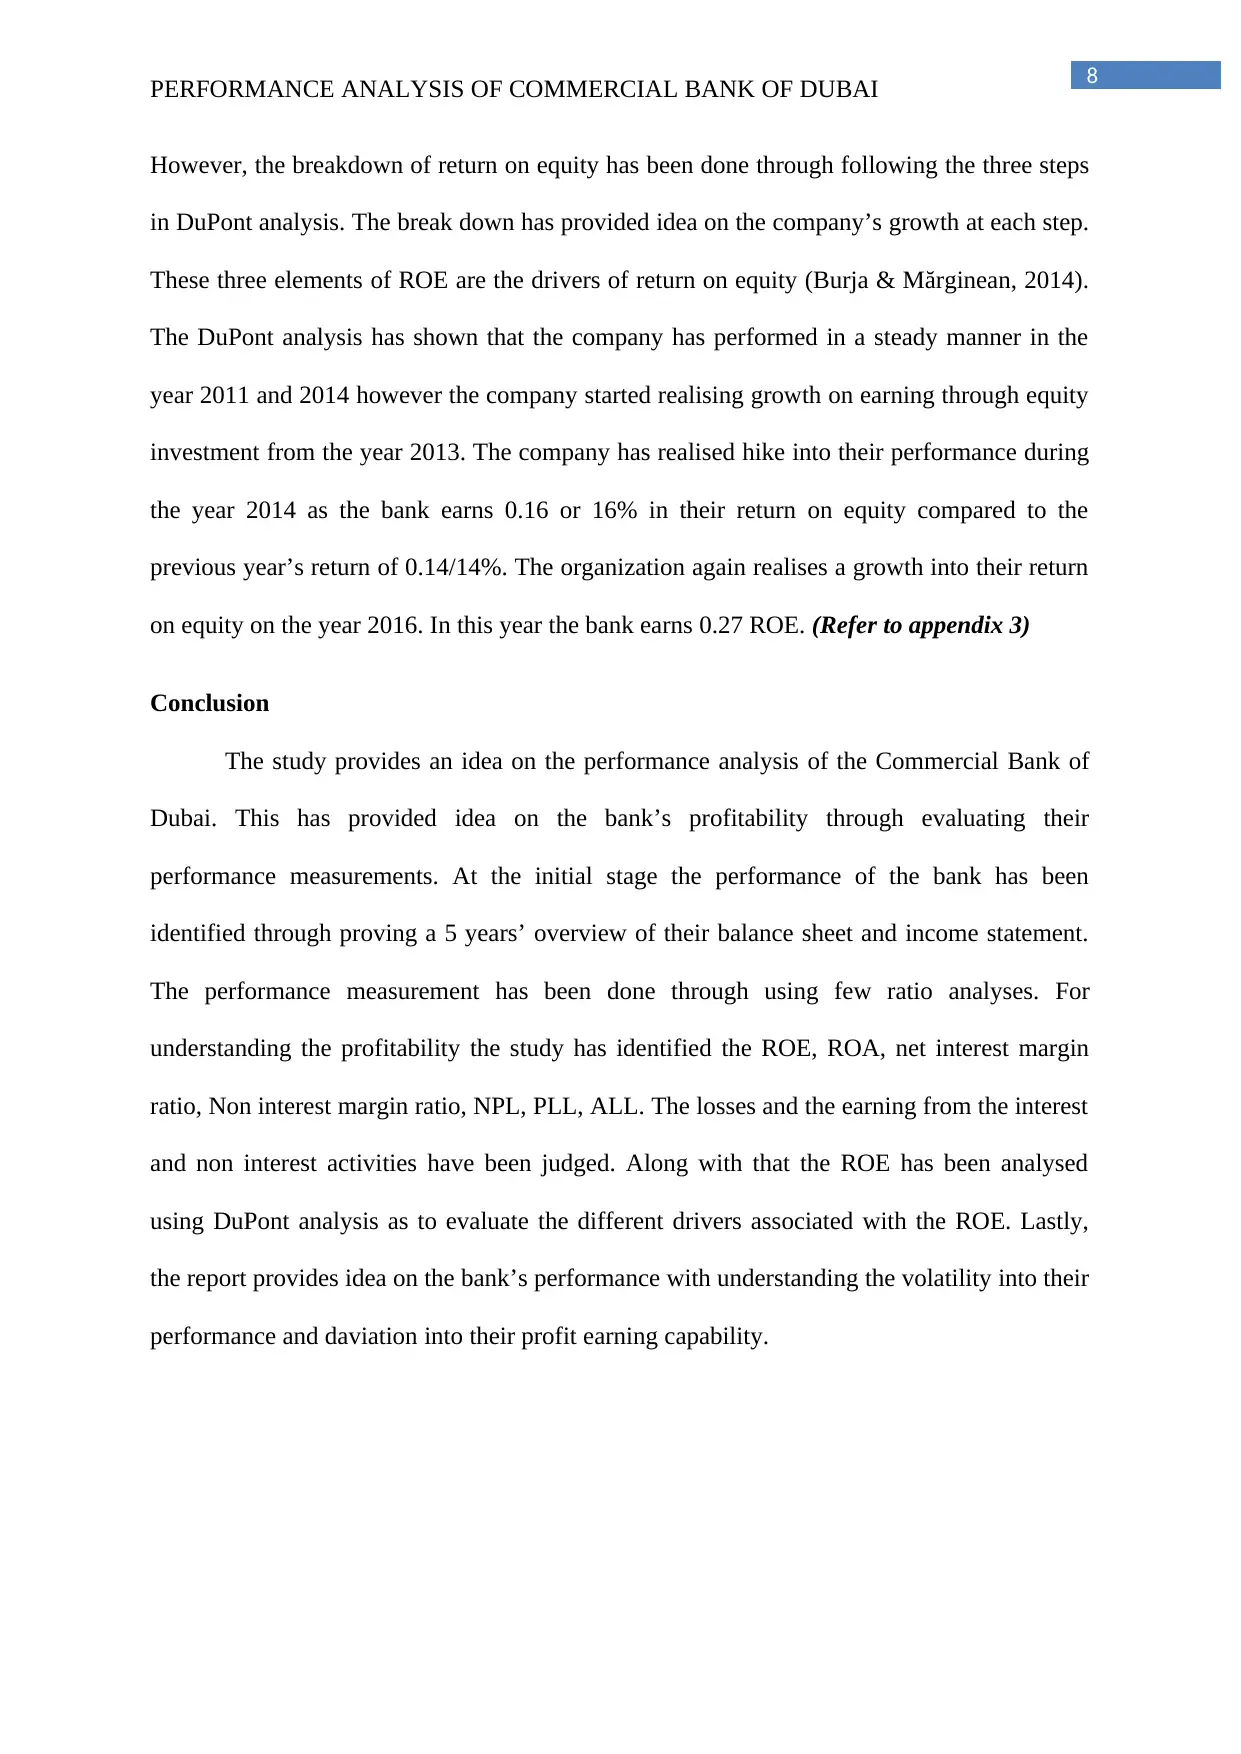
Income statement:
The income statement reflects the company’s or an organization’s profitability. This
reflects a company’s profit after a certain period of time (Sydler, Haefliger & Pruksa, 2014).
This has been recognised that during the 2011 the bank has realised a net profit for the year
$822100. This has increased by 0.18% compared to the previous year. This means that the
company has earned more through reducing the operating expenses. In the year 2012 the net
profit has shown a reduction into their performance, however the reduction has been noticed
in the operating income segment as the operating income realises a reduction of 5.77% in the
year 2012 compare to 2011. This means that the bank has earned more from the nonoperation
sources such as recoveries. In the year 2013 the income from fee and commission has
increased this resulted in increase in net profit for the bank (Robinson et al., 2015). The
earning assets in the year have increased by 9.41%. This has reduced the NPL for the bank.
In the year 2014 the net profit has increased by 19% as the bank has increased their revenue
and also reduced the operating expenses. This has been recognised that the operating income
has increased by 10.20%. This means that with the increase in sales, the operating income has
also increased. In the year 2015 the net profit has reduced as the operating expenses has
increased by 13.83% (Khadafi, Heikal & Ummah, 2014). The interest expenses have also
increased by 32.32% in the same year which has reduced the profitability for the bank. (Refer
to the appendix 1)
Performance analysis
The bank has shown a lower standard deviation into their performance when the
return on equity is concerned. With the lower standard deviation this can be understood that
the bank has shown a less fluctuation into their performance (Bland, 2014). Along with that
the mean provided an average return of 0.038. The return on assets shows a decline in return
which means that the return from employing the assets has declined with their performance
PERFORMANCE ANALYSIS OF COMMERCIAL BANK OF DUBAI
Income statement:
The income statement reflects the company’s or an organization’s profitability. This
reflects a company’s profit after a certain period of time (Sydler, Haefliger & Pruksa, 2014).
This has been recognised that during the 2011 the bank has realised a net profit for the year
$822100. This has increased by 0.18% compared to the previous year. This means that the
company has earned more through reducing the operating expenses. In the year 2012 the net
profit has shown a reduction into their performance, however the reduction has been noticed
in the operating income segment as the operating income realises a reduction of 5.77% in the
year 2012 compare to 2011. This means that the bank has earned more from the nonoperation
sources such as recoveries. In the year 2013 the income from fee and commission has
increased this resulted in increase in net profit for the bank (Robinson et al., 2015). The
earning assets in the year have increased by 9.41%. This has reduced the NPL for the bank.
In the year 2014 the net profit has increased by 19% as the bank has increased their revenue
and also reduced the operating expenses. This has been recognised that the operating income
has increased by 10.20%. This means that with the increase in sales, the operating income has
also increased. In the year 2015 the net profit has reduced as the operating expenses has
increased by 13.83% (Khadafi, Heikal & Ummah, 2014). The interest expenses have also
increased by 32.32% in the same year which has reduced the profitability for the bank. (Refer
to the appendix 1)
Performance analysis
The bank has shown a lower standard deviation into their performance when the
return on equity is concerned. With the lower standard deviation this can be understood that
the bank has shown a less fluctuation into their performance (Bland, 2014). Along with that
the mean provided an average return of 0.038. The return on assets shows a decline in return
which means that the return from employing the assets has declined with their performance
⊘ This is a preview!⊘
Do you want full access?
Subscribe today to unlock all pages.
Trusted by 1+ million students worldwide
6
PERFORMANCE ANALYSIS OF COMMERCIAL BANK OF DUBAI
(Rostami, Rostami & Kohansal, 2016). This also means that assets could not earn with their
full capability. However the return on assets has also released a lower deviation into their
performance as the standard deviation has recognised to the lower side at 0.000841 along
with that the mean has provided an average performance for the company at 0.0054. The
profitability has been identified through the net interest margin ratio and the non interest
margin ratio (Marinković & Radović, 2014). The net interest margin ratio has shown a high
performance and earned profit through interest and income from Islamic finance. This has
been recognised that the bank has earned more and high in the year 2011 and 2012 from the
interested and income from Islamic finance. However, the profitability has declined over the
years and the net interest margin ratio has declined to 1.89 in the year 2016 compared to the
8.413 during the year 2011. However, the 2016 performance has shown a growth compared
to their previous year’s performance, as in this year the bank has earned 1.89 compared to the
0.59 in the year 2015. On the other hand the profitability has been maintained through the
earning from the non interest activities (Entrop et al., 2015). This means the bank has shown
a growth in earning from commission and fees as this has shown a growth over the years
starting from 2011 to 2016. The non interest margin ratio realises a value of 2 during the year
2011 and this has grown to 2.30 in the year 2015. However, a little decline has been noticed
as the ratio has shown a value at 2.04 in the year 2016. The profitability has been kept at the
average of 2 as the mean represents the average performance for the company. The standard
deviation also stays below the average earning from non interest items. This means that the
bank earns from their non interest activities such as commission and fees in a steady manner.
The bank has also realised a reduction into the provision for loan loss, this means that
the bank has reduced with their loan loss or bad debt and that is the reason why the bank is
keeping less amount of provision in recent times (Ozili, 2015). This provision for loan loss
has shown a value at 2.07 during the year 2011 which has reduced to 1.55 in the year 2016.
Paraphrase This Document
Need a fresh take? Get an instant paraphrase of this document with our AI Paraphraser
7
PERFORMANCE ANALYSIS OF COMMERCIAL BANK OF DUBAI
This reflects that the bank expects less loss and reason why they are keeping less provision.
On the other hand the NPL measures the bank’s effectiveness in receiving repayment on
loans. With the increasing NPL this shows that the bank is unable to collect the repayments
from their borrowers (Makri, Tsagkanos & Bellas, 2014). This also means that the bank
realises a high risk into the loan landed to their customers as the amount of none performing
loans have increased over the years and may realise loss for their inability to collect the
borrowed money. In general terms, the allowance for loan loss refers to the provision or
reserve for bad debt. This has been kept for the estimated loss recovery. However, with the
decrease in the ALL refers to the reduction in the estimated risk of uncollectable assets. This
means that the bank has kept lower provision through expecting a lower risk or loans and
leases (Cbd.ae, 2019).
From the performance analysis this can be understood that the bank is high in risk and
earns more return through the non interest incomes, which increase the profitability for the
bank. Along with that the bank is less deepens on the interest earning activities to earn the
profit rather depends more in the non interest activities through which the bank earns more
profit (Refer to appendix 2).
Break down of ROE
The return on equity refers to the return on investment through the equity share
employment. The return on equity implies that how the company is earning through
employing equity share capital. The higher return on equity refers to the increase in the
company’s performance. The return on equity ratio provides a perfect judgment over the
company’s capability to generate return on investment. Hence, shareholders tend to analyse
this ratio to understand the company’s profitability (Kijewska, 2016). The higher the return
on equity is the higher the company’s capability to earn from the investment. The high return
on equity refers to the high return on investment of a portfolio or any other underlying asset.
8
PERFORMANCE ANALYSIS OF COMMERCIAL BANK OF DUBAI
However, the breakdown of return on equity has been done through following the three steps
in DuPont analysis. The break down has provided idea on the company’s growth at each step.
These three elements of ROE are the drivers of return on equity (Burja & Mărginean, 2014).
The DuPont analysis has shown that the company has performed in a steady manner in the
year 2011 and 2014 however the company started realising growth on earning through equity
investment from the year 2013. The company has realised hike into their performance during
the year 2014 as the bank earns 0.16 or 16% in their return on equity compared to the
previous year’s return of 0.14/14%. The organization again realises a growth into their return
on equity on the year 2016. In this year the bank earns 0.27 ROE. (Refer to appendix 3)
Conclusion
The study provides an idea on the performance analysis of the Commercial Bank of
Dubai. This has provided idea on the bank’s profitability through evaluating their
performance measurements. At the initial stage the performance of the bank has been
identified through proving a 5 years’ overview of their balance sheet and income statement.
The performance measurement has been done through using few ratio analyses. For
understanding the profitability the study has identified the ROE, ROA, net interest margin
ratio, Non interest margin ratio, NPL, PLL, ALL. The losses and the earning from the interest
and non interest activities have been judged. Along with that the ROE has been analysed
using DuPont analysis as to evaluate the different drivers associated with the ROE. Lastly,
the report provides idea on the bank’s performance with understanding the volatility into their
performance and daviation into their profit earning capability.
⊘ This is a preview!⊘
Do you want full access?
Subscribe today to unlock all pages.
Trusted by 1+ million students worldwide
9
PERFORMANCE ANALYSIS OF COMMERCIAL BANK OF DUBAI
References
Bland, M. (2014). Estimating mean and standard deviation from the sample size, three
quartiles, minimum, and maximum. International Journal of Statistics in Medical
Research, 4(1), 57-64.
Bobryshev, A. N., Uryadova, T. N., Lyubenkova, E. P., Yakovenko, V. S., & Alekseeva, O.
A. (2014). Analytical and management approaches to modeling of the accounting
balance sheet. Life Science Journal, 11(8), 502-506.
Boeckx, J., Dossche, M., & Peersman, G. (2014). Effectiveness and transmission of the
ECB's balance sheet policies.
Burja, V., & Mărginean, R. (2014). The study of factors that may influence the performance
by the Dupont analysis in the furniture industry. Procedia Economics and
Finance, 16, 213-223.
Cbd.ae. (2019). Retrieved from https://www.cbd.ae/corporate/about-cbd/financials-and-
investor-relations/annual-report
Entrop, O., Memmel, C., Ruprecht, B., & Wilkens, M. (2015). Determinants of bank interest
margins: Impact of maturity transformation. Journal of Banking & Finance, 54, 1-19.
Hail, L., Tahoun, A., & Wang, C. (2014). Dividend payouts and information shocks. Journal
of Accounting Research, 52(2), 403-456.
Khadafi, M., Heikal, M., & Ummah, A. (2014). Influence analysis of return on assets (ROA),
return on equity (ROE), net profit margin (NPM), debt to equity ratio (DER), and
current ratio (CR), against corporate profit growth in automotive in Indonesia Stock
Exchange. International Journal of Academic Research in Business and Social
Sciences, 4(12).
Paraphrase This Document
Need a fresh take? Get an instant paraphrase of this document with our AI Paraphraser
10
PERFORMANCE ANALYSIS OF COMMERCIAL BANK OF DUBAI
Kijewska, A. (2016). Determinants of the return on equity ratio (ROE) on the example of
companies from metallurgy and mining sector in Poland. Metalurgija, 55(2), 285-288.
Makri, V., Tsagkanos, A., & Bellas, A. (2014). Determinants of non-performing loans: The
case of Eurozone. Panoeconomicus, 61(2), 193-206.
Marinković, S., & Radović, O. (2014). Bank net interest margin related to risk, ownership
and size: an exploratory study of the Serbian banking industry. Economic research-
Ekonomska istraživanja, 27(1), 134-154.
Ozili, P. K. (2015). Loan loss provisioning, income smoothing, signaling, capital
management and procyclicality: does IFRS matter? Empirical evidence from
Nigeria. Mediterranean Journal of Social Sciences, 6(2), 224-232.
Robinson, T. R., Henry, E., Pirie, W. L., & Broihahn, M. A. (2015). International financial
statement analysis. Hoboken: John Wiley & Sons.
Rostami, S., Rostami, Z., & Kohansal, S. (2016). The effect of corporate governance
components on return on assets and stock return of companies listed in Tehran stock
exchange. Procedia Economics and Finance, 36, 137-146.
Sydler, R., Haefliger, S., & Pruksa, R. (2014). Measuring intellectual capital with financial
figures: Can we predict firm profitability?. European Management Journal, 32(2),
244-259.
11
PERFORMANCE ANALYSIS OF COMMERCIAL BANK OF DUBAI
Appendices
Appendix 1:
Figure 1: Income statement
(Source: https://www.cbd.ae/docs/librariesprovider2/default-document-library/annual-report-
2016.pdf?sfvrsn=72af776b_0)
Appendix 2:
PERFORMANCE ANALYSIS OF COMMERCIAL BANK OF DUBAI
Appendices
Appendix 1:
Figure 1: Income statement
(Source: https://www.cbd.ae/docs/librariesprovider2/default-document-library/annual-report-
2016.pdf?sfvrsn=72af776b_0)
Appendix 2:
⊘ This is a preview!⊘
Do you want full access?
Subscribe today to unlock all pages.
Trusted by 1+ million students worldwide
1 out of 13
Related Documents


Your All-in-One AI-Powered Toolkit for Academic Success.
+13062052269
info@desklib.com
Available 24*7 on WhatsApp / Email
![[object Object]](/_next/static/media/star-bottom.7253800d.svg)
Unlock your academic potential
Copyright © 2020–2026 A2Z Services. All Rights Reserved. Developed and managed by ZUCOL.