Report: Performance Improvement and Management in Health & Social Care
VerifiedAdded on 2021/01/03
|19
|5265
|375
Report
AI Summary
This report focuses on performance improvement and management within the health and social care sector, specifically examining Care Tech Holding PLC. It begins by evaluating strategic planning models, including balanced scorecards and gap planning, outlining their advantages and disadvantages. The report then delves into the usefulness of financial ratios for shareholders, providing calculations and interpretations of key ratios such as gross profit margin, operating profit margin, and net profit margin, comparing them to industry averages. Furthermore, it discusses the concept of return on capital employed. The report also includes an evaluation of non-financial and multidimensional performance management models, concluding with a recommendation for gap planning and a summary of the findings, emphasizing the importance of performance monitoring and strategic decision-making within the health and social care environment.

PERFORMANCE IMPROVEMENT
AND MANAGEMENT IN HEALTH
& SOCIAL CARE
AND MANAGEMENT IN HEALTH
& SOCIAL CARE
Paraphrase This Document
Need a fresh take? Get an instant paraphrase of this document with our AI Paraphraser
Table of Contents
INTRODUCTION...........................................................................................................................1
QUESTION 1...................................................................................................................................1
Advantages and disadvantages of strategic planning models.....................................................1
Strategic planning models...........................................................................................................1
1.Balanced scorecard Planning : ................................................................................................1
2.Gap Planning:...........................................................................................................................3
QUESTION 2...................................................................................................................................5
Usefulness of the financial Ratio for the shareholders and explain the financial ratios.............5
B) Interpretation of following ratio.............................................................................................8
C) Residual Income before and after the investment..................................................................9
D) Benefit of Economic Value Added (EVA) concept ............................................................10
QUESTION 3.................................................................................................................................11
Critically evaluation of non-financial and multidimensional performance management model
...................................................................................................................................................11
CONCLUSION..............................................................................................................................14
REFERENCES..............................................................................................................................15
INTRODUCTION
Performance improvement in the health care sector is very necessary, it is the systematic
and continuous action that leads to improvement on health. Care Tech Holding Plc is founded in
1993, having the principal activity of specialist caring and physical disabilities it has the support
services in the whole UK (Kearney, 2018). This report elaborates the advantages and
disadvantages of strategic planning models according to the care sector in England. Two models
which the report illustrate are balanced score card planning and Gap planning. This report
explains the various ratios and also did the comparison with the industry average and explains
the usefulness of this ratios.
QUESTION 1
Advantages and disadvantages of strategic planning models
Memorandum
To: accounting head
CC: Mr. John
From: Karen Moore
Date: May 09, 2019
Subject: best strategic planning model
Respected,
The strategic planning models play a major role in organisation to gain long term success.
And it provides direction to accounting team and describes the method that needs to be
implemented in order to make effective strategic plan (Augustyn, Elshaer and Akamavi, 2019).
Company is facing the issue of improper financial management. It is required to pay attention on
effectiveness of various strategic planning models so that proper decision can be taken by firm
that may support in growth of organisation.
1.Balanced scorecard Planning:
It’s a framework of strategic management and its main objective is to reach high level
organisation goals. It helps to understand the objectives of care tech holding strategically. It
includes key which can give growth to the organisation. The balance scorecard is made with the
help of excel, PowerPoint, google sheets or with the help of any reporting software (Atieh and
et.al., 2016).
⊘ This is a preview!⊘
Do you want full access?
Subscribe today to unlock all pages.
Trusted by 1+ million students worldwide
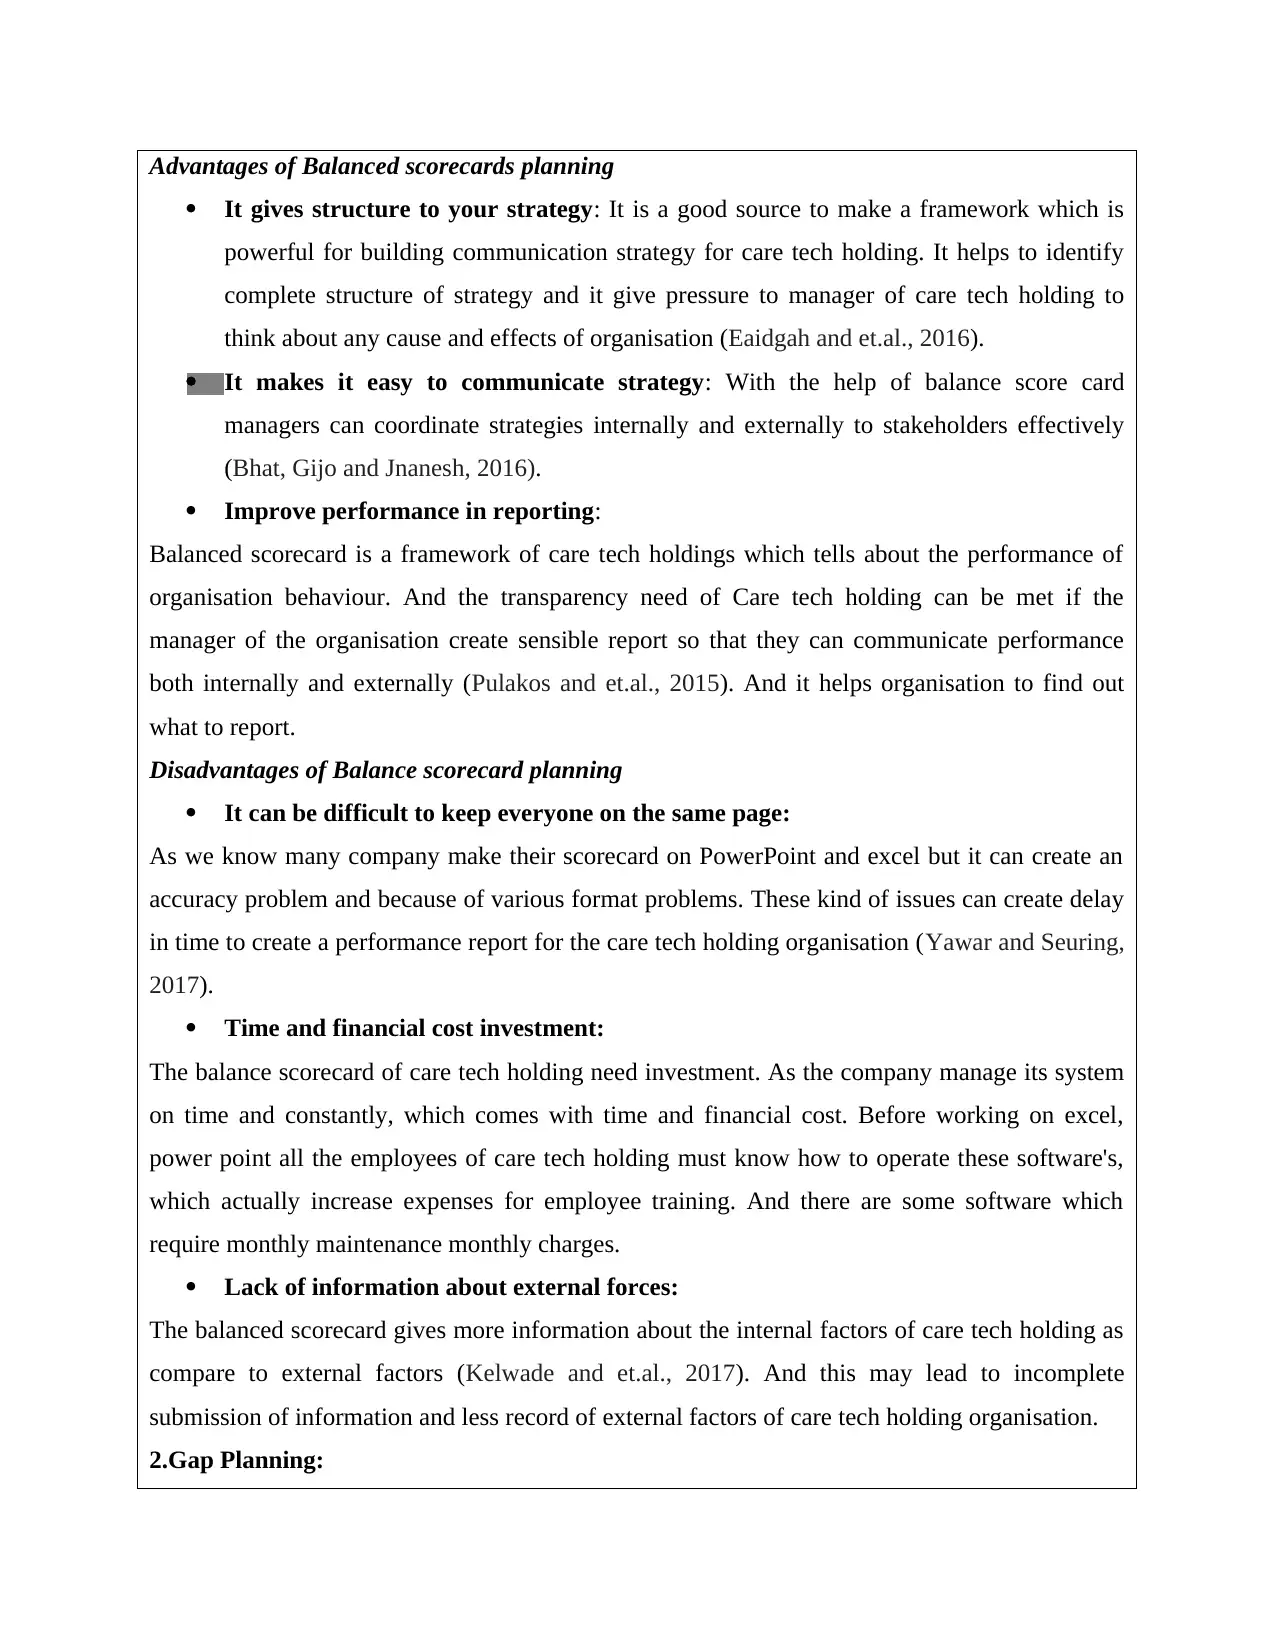
Advantages of Balanced scorecards planning
It gives structure to your strategy: It is a good source to make a framework which is
powerful for building communication strategy for care tech holding. It helps to identify
complete structure of strategy and it give pressure to manager of care tech holding to
think about any cause and effects of organisation (Eaidgah and et.al., 2016).
It makes it easy to communicate strategy: With the help of balance score card
managers can coordinate strategies internally and externally to stakeholders effectively
(Bhat, Gijo and Jnanesh, 2016).
Improve performance in reporting:
Balanced scorecard is a framework of care tech holdings which tells about the performance of
organisation behaviour. And the transparency need of Care tech holding can be met if the
manager of the organisation create sensible report so that they can communicate performance
both internally and externally (Pulakos and et.al., 2015). And it helps organisation to find out
what to report.
Disadvantages of Balance scorecard planning
It can be difficult to keep everyone on the same page:
As we know many company make their scorecard on PowerPoint and excel but it can create an
accuracy problem and because of various format problems. These kind of issues can create delay
in time to create a performance report for the care tech holding organisation (Yawar and Seuring,
2017).
Time and financial cost investment:
The balance scorecard of care tech holding need investment. As the company manage its system
on time and constantly, which comes with time and financial cost. Before working on excel,
power point all the employees of care tech holding must know how to operate these software's,
which actually increase expenses for employee training. And there are some software which
require monthly maintenance monthly charges.
Lack of information about external forces:
The balanced scorecard gives more information about the internal factors of care tech holding as
compare to external factors (Kelwade and et.al., 2017). And this may lead to incomplete
submission of information and less record of external factors of care tech holding organisation.
2.Gap Planning:
Paraphrase This Document
Need a fresh take? Get an instant paraphrase of this document with our AI Paraphraser
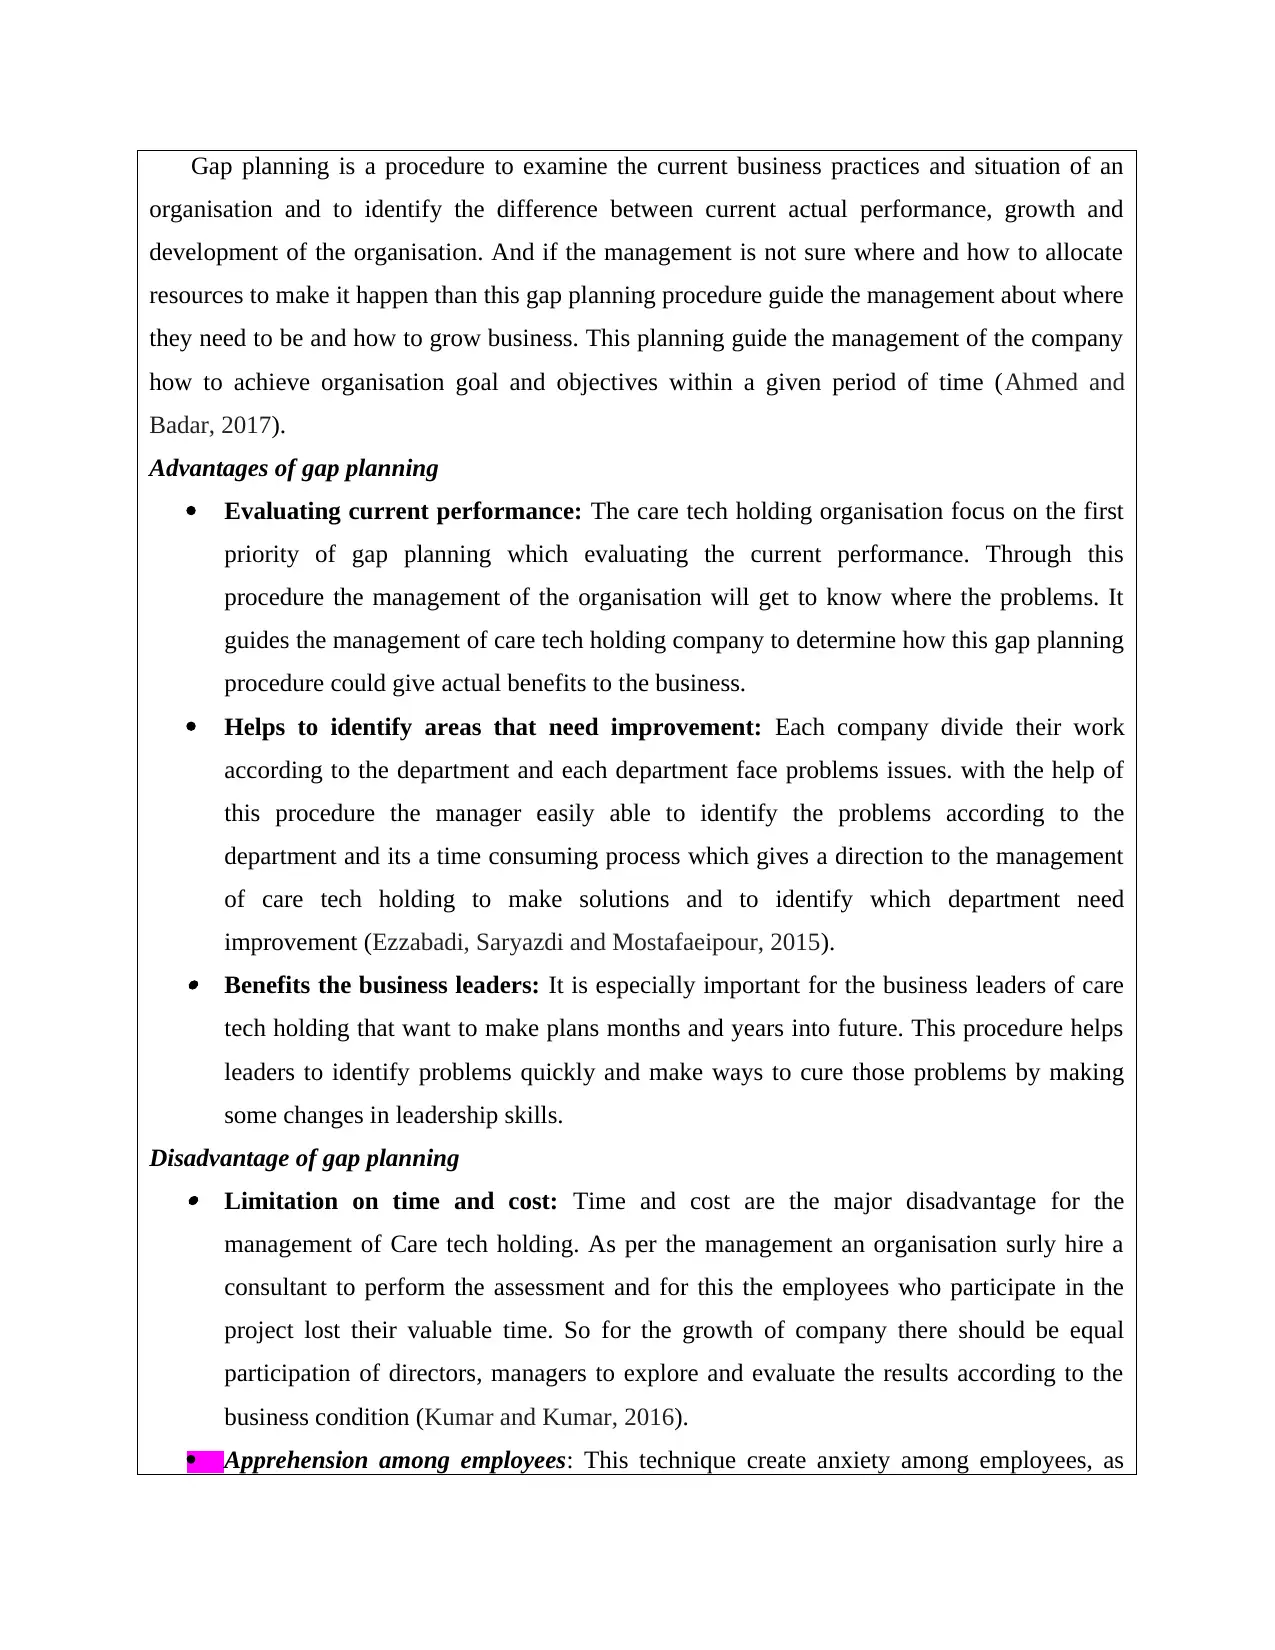
Gap planning is a procedure to examine the current business practices and situation of an
organisation and to identify the difference between current actual performance, growth and
development of the organisation. And if the management is not sure where and how to allocate
resources to make it happen than this gap planning procedure guide the management about where
they need to be and how to grow business. This planning guide the management of the company
how to achieve organisation goal and objectives within a given period of time (Ahmed and
Badar, 2017).
Advantages of gap planning
Evaluating current performance: The care tech holding organisation focus on the first
priority of gap planning which evaluating the current performance. Through this
procedure the management of the organisation will get to know where the problems. It
guides the management of care tech holding company to determine how this gap planning
procedure could give actual benefits to the business.
Helps to identify areas that need improvement: Each company divide their work
according to the department and each department face problems issues. with the help of
this procedure the manager easily able to identify the problems according to the
department and its a time consuming process which gives a direction to the management
of care tech holding to make solutions and to identify which department need
improvement (Ezzabadi, Saryazdi and Mostafaeipour, 2015). Benefits the business leaders: It is especially important for the business leaders of care
tech holding that want to make plans months and years into future. This procedure helps
leaders to identify problems quickly and make ways to cure those problems by making
some changes in leadership skills.
Disadvantage of gap planning Limitation on time and cost: Time and cost are the major disadvantage for the
management of Care tech holding. As per the management an organisation surly hire a
consultant to perform the assessment and for this the employees who participate in the
project lost their valuable time. So for the growth of company there should be equal
participation of directors, managers to explore and evaluate the results according to the
business condition (Kumar and Kumar, 2016).
Apprehension among employees: This technique create anxiety among employees, as
people feel insecure and this affects their moral as well.
Summary
Balanced scorecards planning
Gap planning
After doing research on these both models, it has come to the results and found that if the
care tech holding company wants to enhance their business to the high level then it should be
recommend them to get benefits from gap planning model because it can help the management
of care tech holding company to make reports which current condition and desired future state of
the organisation and personal goal. With the help of gap planning the care tech holding company
clearly identify where its stands in existing market and how much improvement company needs.
And it creates better plans which address the gap between the current state and desired state of
care tech company. They must use this model because every company should be more focused
on the current state of business and their desired future targets (McNab and et.al., 2018). If they
focus on their current situation they will never face any problems in future as they are making
fast decision in present condition only. The gap planning is justifying that this tool can raise the
performance level of organisation and they get know where they want to get to, and where are
they now by comparing their present performance with the past performance and make plans
which helps them to get their desire future goals. Hence the result of this may support the
maintenance of the current process of care tech holding sector in England.
Thanks & Regards
Karen Moore
QUESTION 2
a. Usefulness of the financial Ratio for the shareholders and explain the financial ratios.
Usefulness of financial ratio analysis for the shareholders
Financial ratios are those which used to find out the relative strength of companies by
doing the simple calculations on income statement, cash flows and balance sheets. Financial ratio
measures the operational efficiency, liquidity, stability and profitability of the company. It is
very helpful for the shareholders so that they can make the wise decisions before investing in the
company.
⊘ This is a preview!⊘
Do you want full access?
Subscribe today to unlock all pages.
Trusted by 1+ million students worldwide
Ratios gives the standardised technique which can compare the companies from its
industries. Ratio puts all the companies on the relatively equal playing field in the hands of
analyst. Shareholders judge the performance of the company like size, sales, volume or market
share, so that they can compare the financial statement of two companies of same industries.
Analysis of ratio shows how the company is good in making the profit, in business funding or
growing through sales rather than debt. Ratio helps in developing the relation between two
financial statements. Assisting the ratio helps Care Tech Holdings PLC in decision making
(Kearney, 2018).
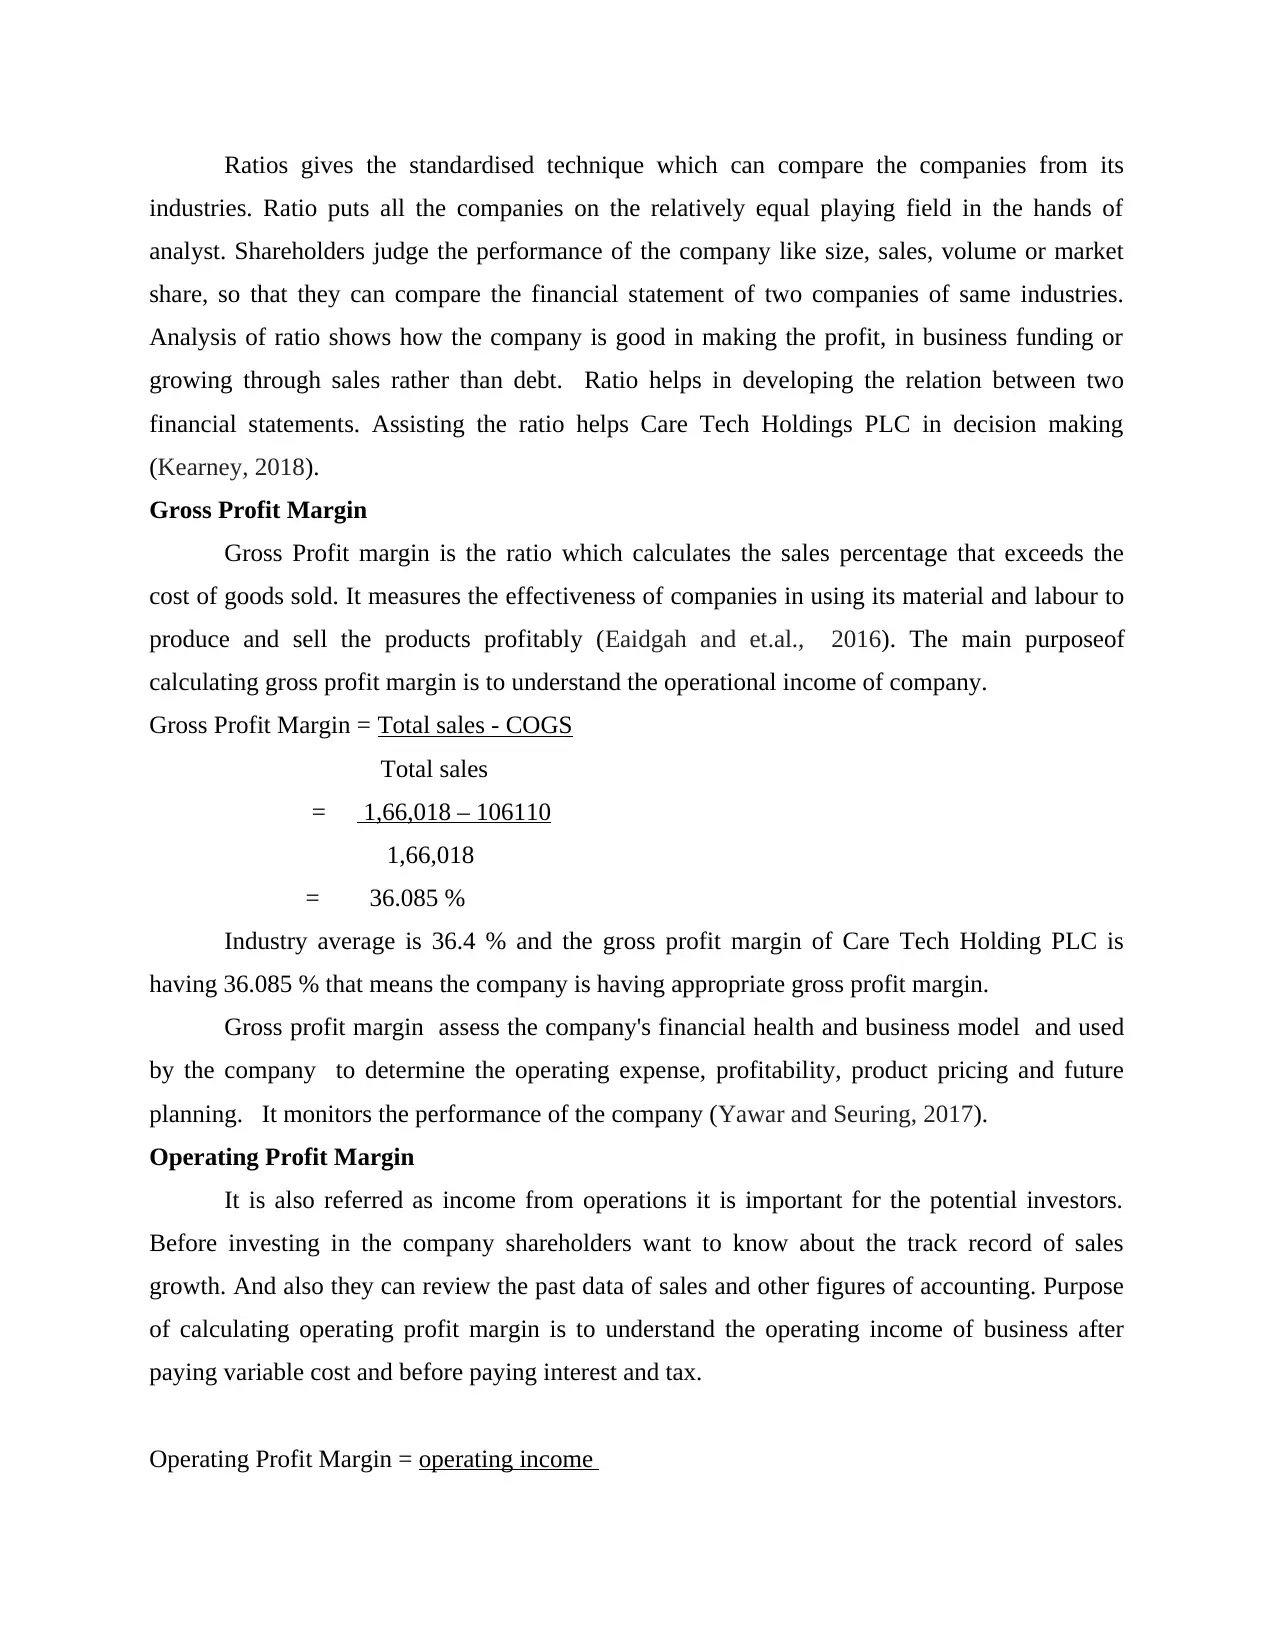
Gross Profit Margin
Gross Profit margin is the ratio which calculates the sales percentage that exceeds the
cost of goods sold. It measures the effectiveness of companies in using its material and labour to
produce and sell the products profitably (Eaidgah and et.al., 2016). The main purposeof
calculating gross profit margin is to understand the operational income of company.
Gross Profit Margin = Total sales - COGS
Total sales
= 1,66,018 – 106110
1,66,018
= 36.085 %
Industry average is 36.4 % and the gross profit margin of Care Tech Holding PLC is
having 36.085 % that means the company is having appropriate gross profit margin.
Gross profit margin assess the company's financial health and business model and used
by the company to determine the operating expense, profitability, product pricing and future
planning. It monitors the performance of the company (Yawar and Seuring, 2017).
Operating Profit Margin
It is also referred as income from operations it is important for the potential investors.
Before investing in the company shareholders want to know about the track record of sales
growth. And also they can review the past data of sales and other figures of accounting. Purpose
of calculating operating profit margin is to understand the operating income of business after
paying variable cost and before paying interest and tax.
Operating Profit Margin = operating income
industries. Ratio puts all the companies on the relatively equal playing field in the hands of
analyst. Shareholders judge the performance of the company like size, sales, volume or market
share, so that they can compare the financial statement of two companies of same industries.
Analysis of ratio shows how the company is good in making the profit, in business funding or
growing through sales rather than debt. Ratio helps in developing the relation between two
financial statements. Assisting the ratio helps Care Tech Holdings PLC in decision making
(Kearney, 2018).
Gross Profit Margin
Gross Profit margin is the ratio which calculates the sales percentage that exceeds the
cost of goods sold. It measures the effectiveness of companies in using its material and labour to
produce and sell the products profitably (Eaidgah and et.al., 2016). The main purposeof
calculating gross profit margin is to understand the operational income of company.
Gross Profit Margin = Total sales - COGS
Total sales
= 1,66,018 – 106110
1,66,018
= 36.085 %
Industry average is 36.4 % and the gross profit margin of Care Tech Holding PLC is
having 36.085 % that means the company is having appropriate gross profit margin.
Gross profit margin assess the company's financial health and business model and used
by the company to determine the operating expense, profitability, product pricing and future
planning. It monitors the performance of the company (Yawar and Seuring, 2017).
Operating Profit Margin
It is also referred as income from operations it is important for the potential investors.
Before investing in the company shareholders want to know about the track record of sales
growth. And also they can review the past data of sales and other figures of accounting. Purpose
of calculating operating profit margin is to understand the operating income of business after
paying variable cost and before paying interest and tax.
Operating Profit Margin = operating income
Paraphrase This Document
Need a fresh take? Get an instant paraphrase of this document with our AI Paraphraser
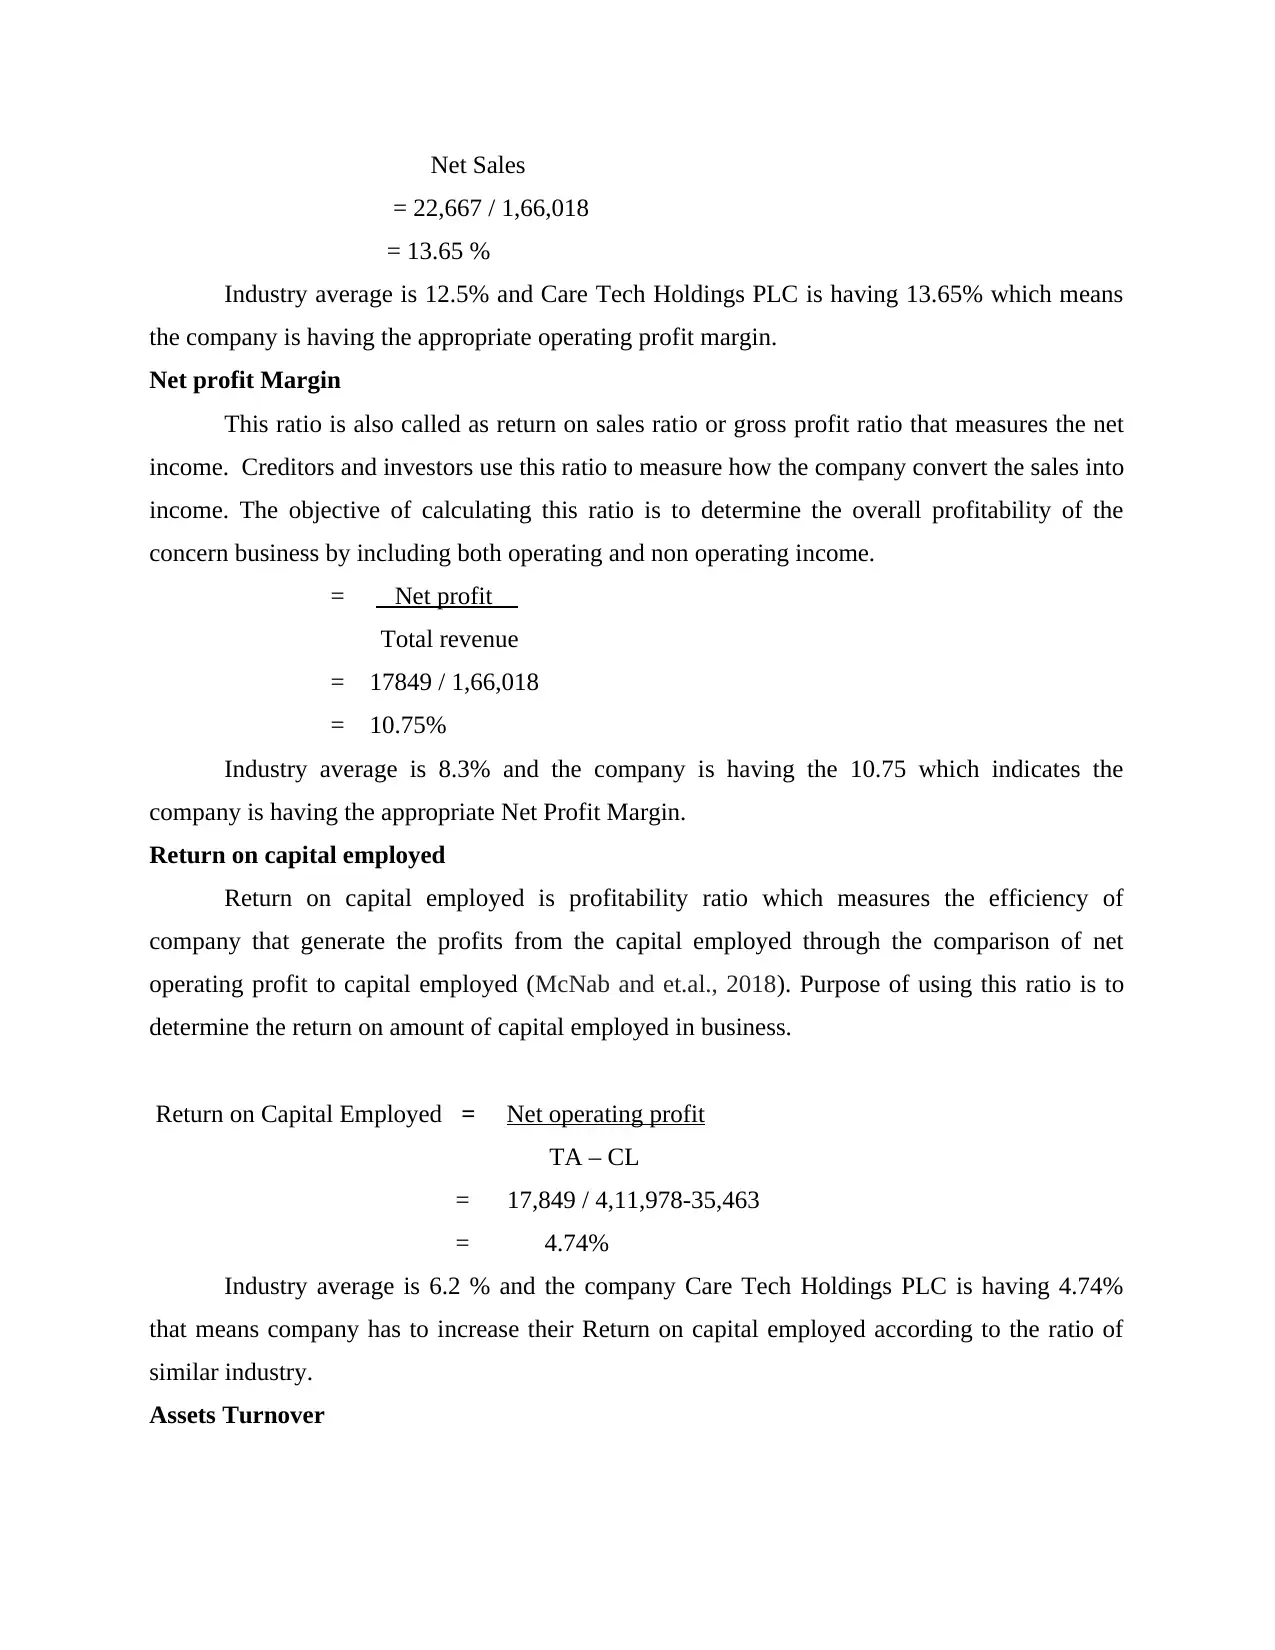
Net Sales
= 22,667 / 1,66,018
= 13.65 %
Industry average is 12.5% and Care Tech Holdings PLC is having 13.65% which means
the company is having the appropriate operating profit margin.
Net profit Margin
This ratio is also called as return on sales ratio or gross profit ratio that measures the net
income. Creditors and investors use this ratio to measure how the company convert the sales into
income. The objective of calculating this ratio is to determine the overall profitability of the
concern business by including both operating and non operating income.
= Net profit
Total revenue
= 17849 / 1,66,018
= 10.75%
Industry average is 8.3% and the company is having the 10.75 which indicates the
company is having the appropriate Net Profit Margin.
Return on capital employed
Return on capital employed is profitability ratio which measures the efficiency of
company that generate the profits from the capital employed through the comparison of net
operating profit to capital employed (McNab and et.al., 2018). Purpose of using this ratio is to
determine the return on amount of capital employed in business.
Return on Capital Employed = Net operating profit
TA – CL
= 17,849 / 4,11,978-35,463
= 4.74%
Industry average is 6.2 % and the company Care Tech Holdings PLC is having 4.74%
that means company has to increase their Return on capital employed according to the ratio of
similar industry.
Assets Turnover
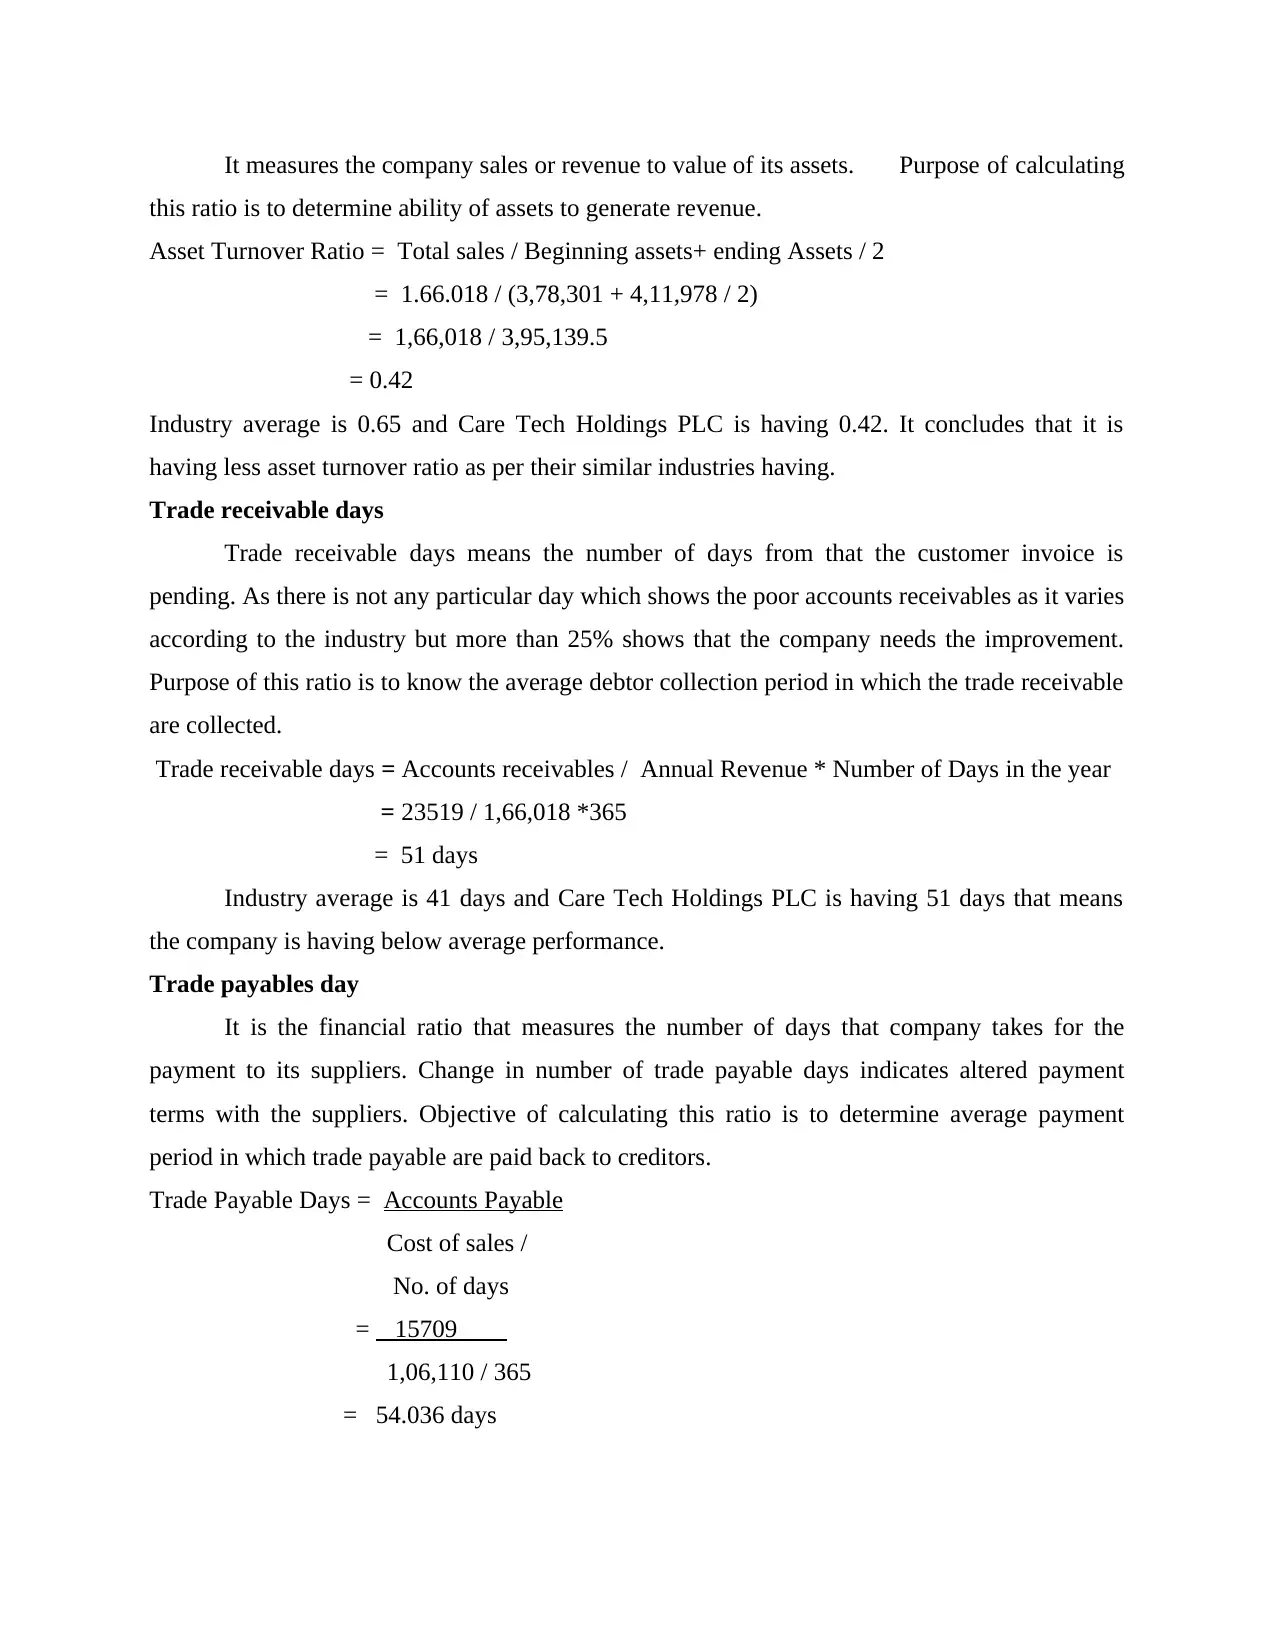
It measures the company sales or revenue to value of its assets. Purpose of calculating
this ratio is to determine ability of assets to generate revenue.
Asset Turnover Ratio = Total sales / Beginning assets+ ending Assets / 2
= 1.66.018 / (3,78,301 + 4,11,978 / 2)
= 1,66,018 / 3,95,139.5
= 0.42
Industry average is 0.65 and Care Tech Holdings PLC is having 0.42. It concludes that it is
having less asset turnover ratio as per their similar industries having.
Trade receivable days
Trade receivable days means the number of days from that the customer invoice is
pending. As there is not any particular day which shows the poor accounts receivables as it varies
according to the industry but more than 25% shows that the company needs the improvement.
Purpose of this ratio is to know the average debtor collection period in which the trade receivable
are collected.
Trade receivable days = Accounts receivables / Annual Revenue * Number of Days in the year
= 23519 / 1,66,018 *365
= 51 days
Industry average is 41 days and Care Tech Holdings PLC is having 51 days that means
the company is having below average performance.
Trade payables day
It is the financial ratio that measures the number of days that company takes for the
payment to its suppliers. Change in number of trade payable days indicates altered payment
terms with the suppliers. Objective of calculating this ratio is to determine average payment
period in which trade payable are paid back to creditors.
Trade Payable Days = Accounts Payable
Cost of sales /
No. of days
= 15709
1,06,110 / 365
= 54.036 days
⊘ This is a preview!⊘
Do you want full access?
Subscribe today to unlock all pages.
Trusted by 1+ million students worldwide
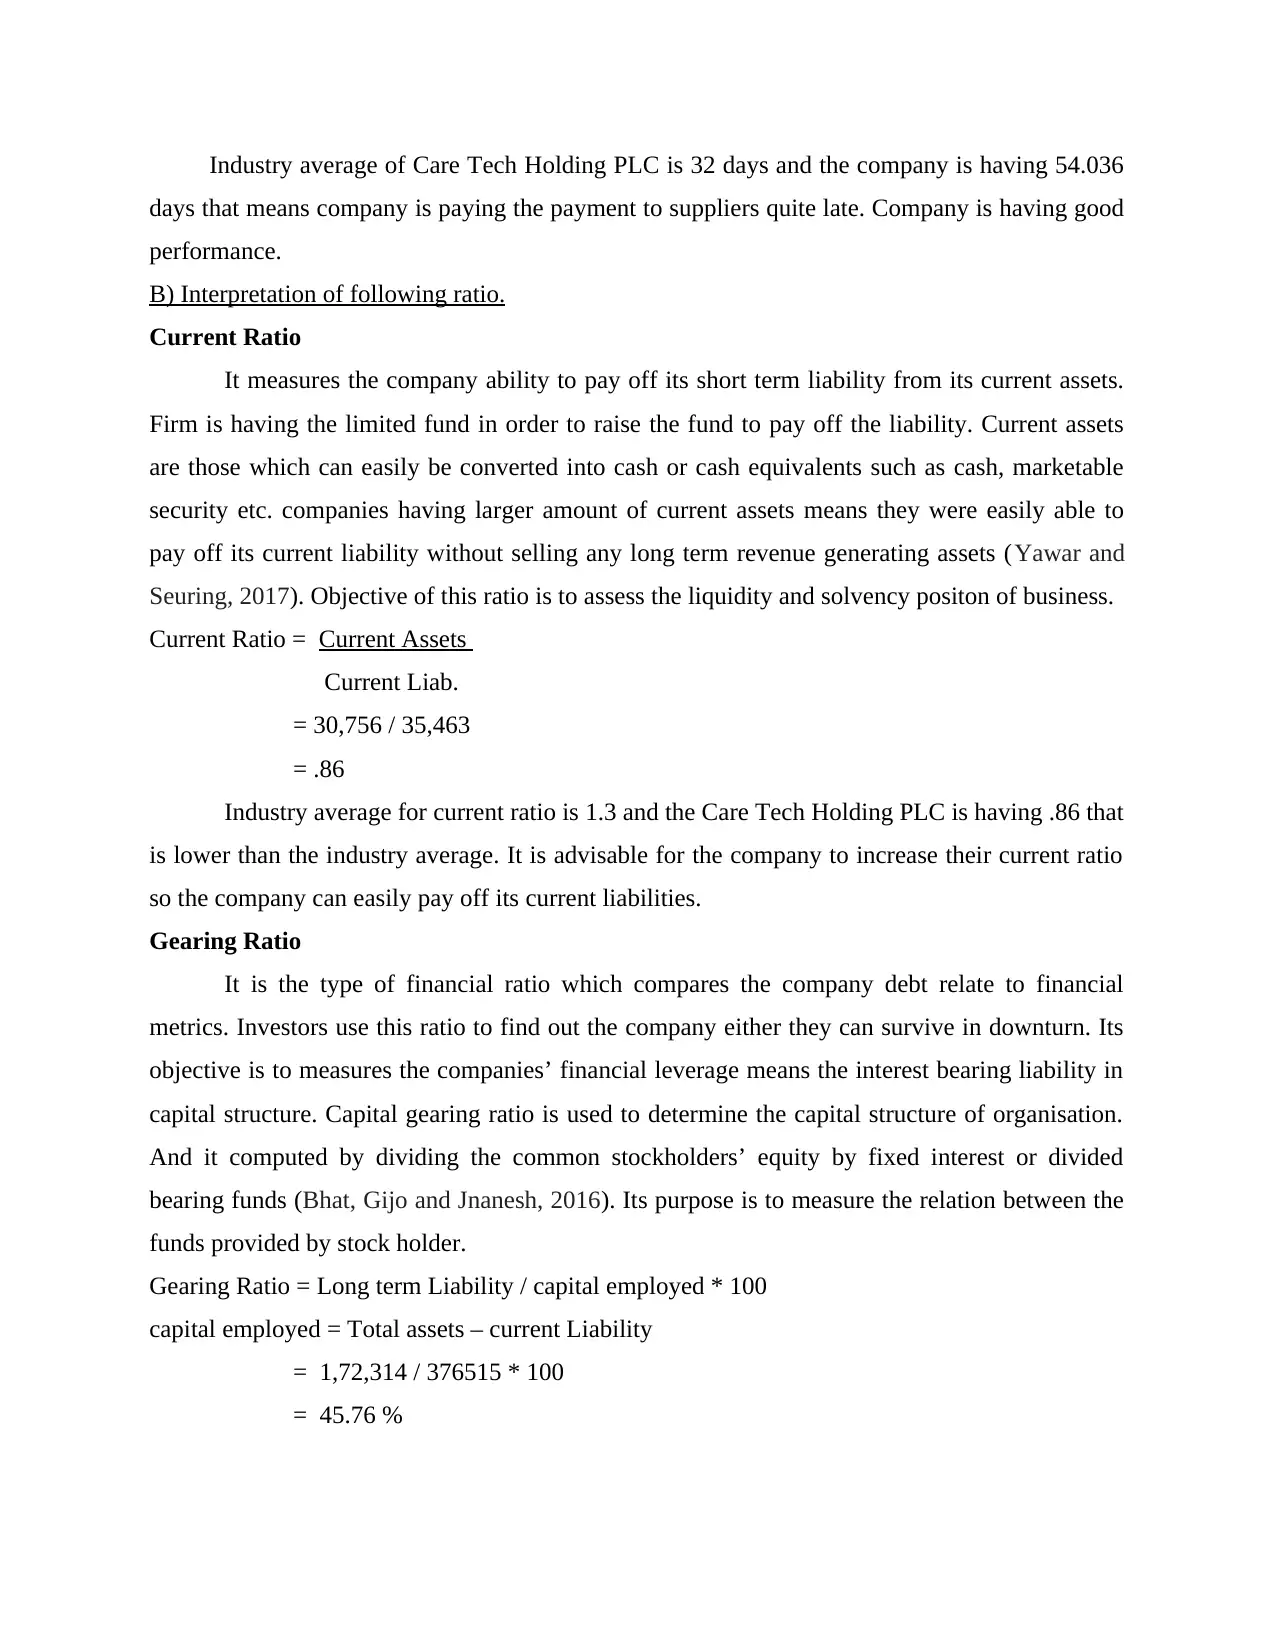
Industry average of Care Tech Holding PLC is 32 days and the company is having 54.036
days that means company is paying the payment to suppliers quite late. Company is having good
performance.
B) Interpretation of following ratio.
Current Ratio
It measures the company ability to pay off its short term liability from its current assets.
Firm is having the limited fund in order to raise the fund to pay off the liability. Current assets
are those which can easily be converted into cash or cash equivalents such as cash, marketable
security etc. companies having larger amount of current assets means they were easily able to
pay off its current liability without selling any long term revenue generating assets (Yawar and
Seuring, 2017). Objective of this ratio is to assess the liquidity and solvency positon of business.
Current Ratio = Current Assets
Current Liab.
= 30,756 / 35,463
= .86
Industry average for current ratio is 1.3 and the Care Tech Holding PLC is having .86 that
is lower than the industry average. It is advisable for the company to increase their current ratio
so the company can easily pay off its current liabilities.
Gearing Ratio
It is the type of financial ratio which compares the company debt relate to financial
metrics. Investors use this ratio to find out the company either they can survive in downturn. Its
objective is to measures the companies’ financial leverage means the interest bearing liability in
capital structure. Capital gearing ratio is used to determine the capital structure of organisation.
And it computed by dividing the common stockholders’ equity by fixed interest or divided
bearing funds (Bhat, Gijo and Jnanesh, 2016). Its purpose is to measure the relation between the
funds provided by stock holder.
Gearing Ratio = Long term Liability / capital employed * 100
capital employed = Total assets – current Liability
= 1,72,314 / 376515 * 100
= 45.76 %
Paraphrase This Document
Need a fresh take? Get an instant paraphrase of this document with our AI Paraphraser
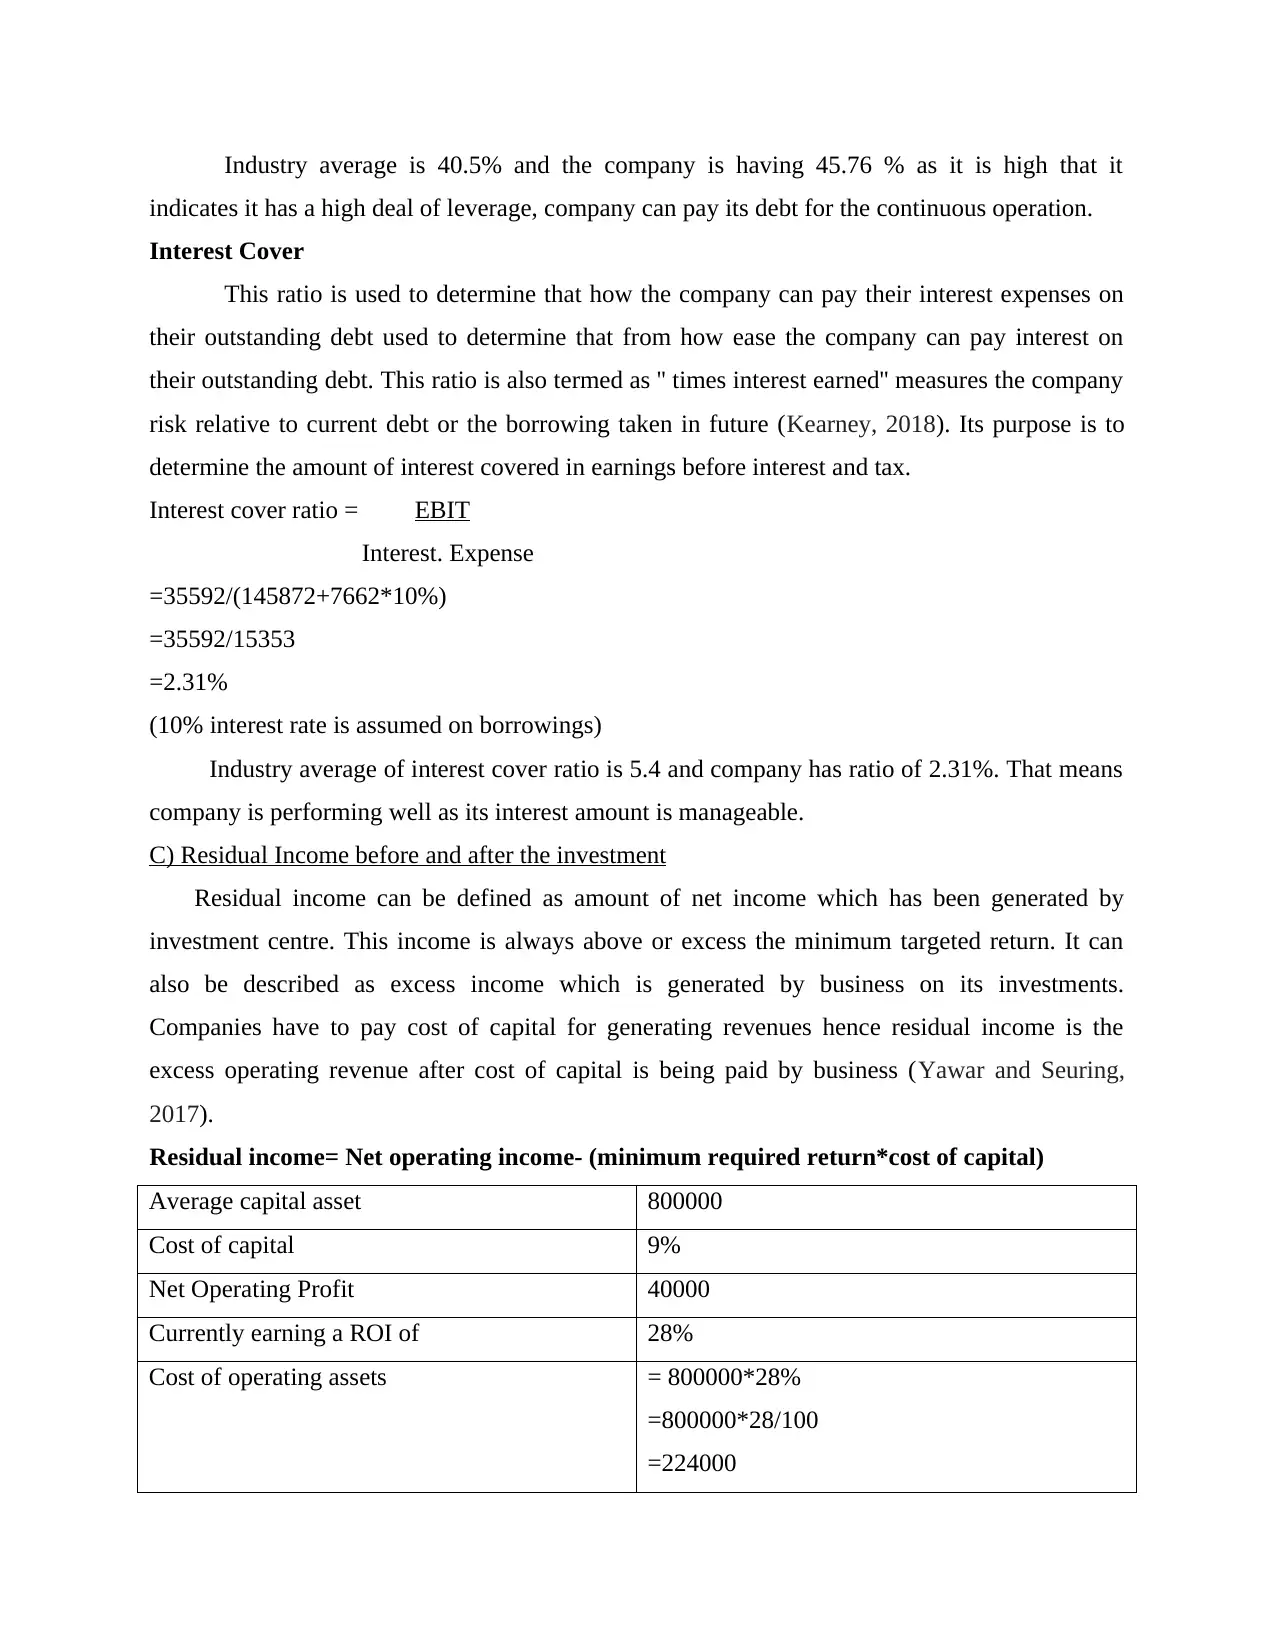
Industry average is 40.5% and the company is having 45.76 % as it is high that it
indicates it has a high deal of leverage, company can pay its debt for the continuous operation.
Interest Cover
This ratio is used to determine that how the company can pay their interest expenses on
their outstanding debt used to determine that from how ease the company can pay interest on
their outstanding debt. This ratio is also termed as '' times interest earned'' measures the company
risk relative to current debt or the borrowing taken in future (Kearney, 2018). Its purpose is to
determine the amount of interest covered in earnings before interest and tax.
Interest cover ratio = EBIT
Interest. Expense
=35592/(145872+7662*10%)
=35592/15353
=2.31%
(10% interest rate is assumed on borrowings)
Industry average of interest cover ratio is 5.4 and company has ratio of 2.31%. That means
company is performing well as its interest amount is manageable.
C) Residual Income before and after the investment
Residual income can be defined as amount of net income which has been generated by
investment centre. This income is always above or excess the minimum targeted return. It can
also be described as excess income which is generated by business on its investments.
Companies have to pay cost of capital for generating revenues hence residual income is the
excess operating revenue after cost of capital is being paid by business (Yawar and Seuring,
2017).
Residual income= Net operating income- (minimum required return*cost of capital)
Average capital asset 800000
Cost of capital 9%
Net Operating Profit 40000
Currently earning a ROI of 28%
Cost of operating assets = 800000*28%
=800000*28/100
=224000
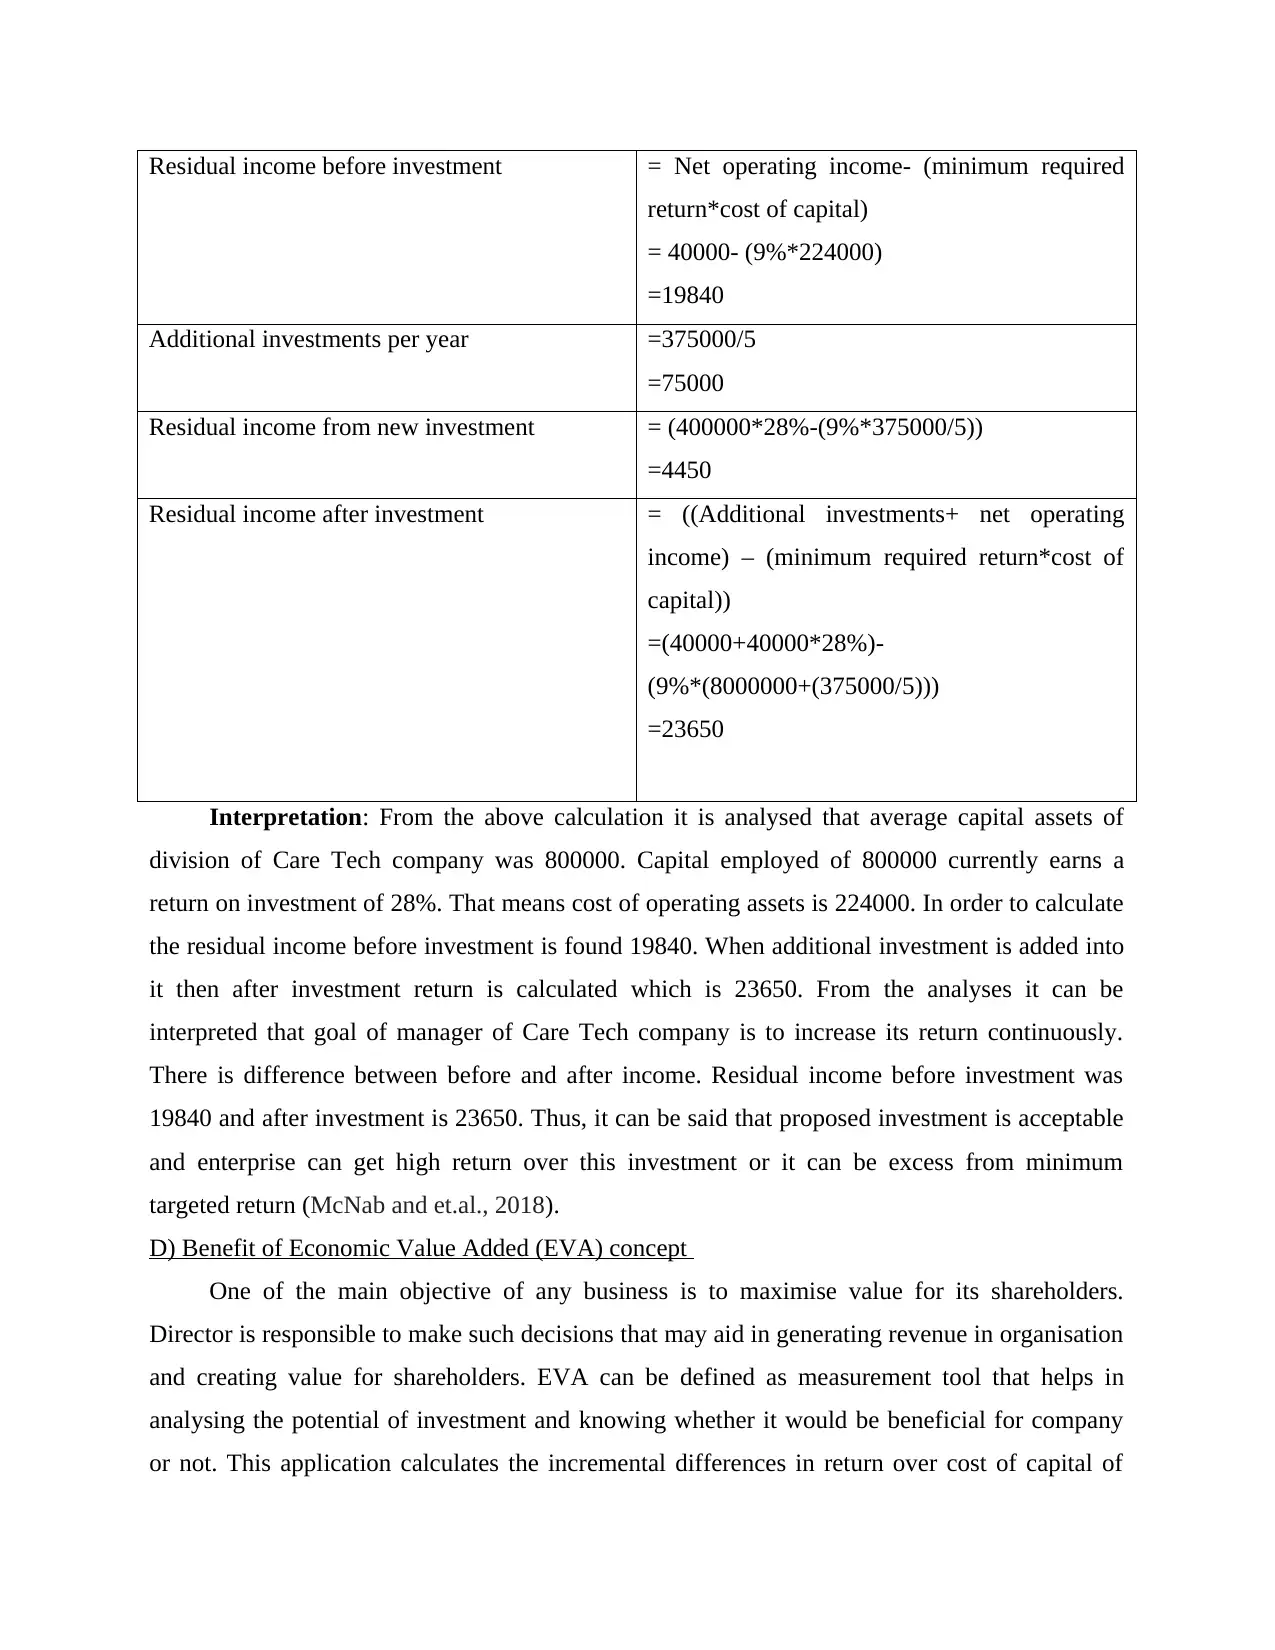
Residual income before investment = Net operating income- (minimum required
return*cost of capital)
= 40000- (9%*224000)
=19840
Additional investments per year =375000/5
=75000
Residual income from new investment = (400000*28%-(9%*375000/5))
=4450
Residual income after investment = ((Additional investments+ net operating
income) – (minimum required return*cost of
capital))
=(40000+40000*28%)-
(9%*(8000000+(375000/5)))
=23650
Interpretation: From the above calculation it is analysed that average capital assets of
division of Care Tech company was 800000. Capital employed of 800000 currently earns a
return on investment of 28%. That means cost of operating assets is 224000. In order to calculate
the residual income before investment is found 19840. When additional investment is added into
it then after investment return is calculated which is 23650. From the analyses it can be
interpreted that goal of manager of Care Tech company is to increase its return continuously.
There is difference between before and after income. Residual income before investment was
19840 and after investment is 23650. Thus, it can be said that proposed investment is acceptable
and enterprise can get high return over this investment or it can be excess from minimum
targeted return (McNab and et.al., 2018).
D) Benefit of Economic Value Added (EVA) concept
One of the main objective of any business is to maximise value for its shareholders.
Director is responsible to make such decisions that may aid in generating revenue in organisation
and creating value for shareholders. EVA can be defined as measurement tool that helps in
analysing the potential of investment and knowing whether it would be beneficial for company
or not. This application calculates the incremental differences in return over cost of capital of
⊘ This is a preview!⊘
Do you want full access?
Subscribe today to unlock all pages.
Trusted by 1+ million students worldwide
1 out of 19
Related Documents


Your All-in-One AI-Powered Toolkit for Academic Success.
+13062052269
info@desklib.com
Available 24*7 on WhatsApp / Email
![[object Object]](/_next/static/media/star-bottom.7253800d.svg)
Unlock your academic potential
Copyright © 2020–2026 A2Z Services. All Rights Reserved. Developed and managed by ZUCOL.