Financial Performance Analysis: CVP, Breakeven, and High-Low Method
VerifiedAdded on 2020/04/29
|23
|4425
|193
Report
AI Summary
This report provides a comprehensive analysis of Cost-Volume-Profit (CVP) analysis, focusing on breakeven points and cost estimation using the high-low method. It begins with an introduction to the objectives, which include analyzing Economist's and Accountant's break even charts, CVP, fixed costs, and the breakeven point of a company. The report differentiates between Economist's and Accountant's break even charts, outlining their fundamental differences and applications. It then delves into the assumptions of CVP analysis, emphasizing the importance of categorizing costs, the impact of volume, and the significance of the breakeven point in units and dollars. The report also includes a detailed analysis using the High-Low method to calculate the breakeven point and margin of safety for a company, including fixed and variable costs, and the limitations of the High-Low method. Finally, the report concludes with a summary of the findings, highlighting the company's financial position based on the margin of safety and breakeven point.
Performance Management 1
Performance Management
Performance Management
Paraphrase This Document
Need a fresh take? Get an instant paraphrase of this document with our AI Paraphraser
Performance Management 2
Table of Contents
Introduction......................................................................................................................................3
Economist’s and Accountant’s break even charts...........................................................................3
Analysis of CVP..............................................................................................................................4
BreakevenPoint and High low method of the company................................................................7
Comparison of the two proposals..................................................................................................11
Recommendations..........................................................................................................................14
Conclusion.....................................................................................................................................18
References......................................................................................................................................19
Appendix........................................................................................................................................21
Performance Management 3
Introduction
This report mainly serves two objectives. This report will help in making an analysis of The
Economist's break even charts and The Accountant's break even charts. Accountant's break even
charts and Economist's break even charts are different from each other but they have same
fundamentals. An Analysis of CVP is also undertaken in this report. An analysis on Fixed cost
does not change with the volume of the output which incurs in the scale of production as fixed by
the management of the organization is also carried out in order to making the analysis that what
is meant by period of time and relevant range. An analysis on Breakeven Point and Margin of
Safety of the company based on its present cost structure for the second half year of 2016, and
of the High-Low method of cost estimation is also carried out. Further a comparison between
two proposals is carried out in order to evaluate the best proposal after comparing all the aspects.
Economist’s and Accountant’s break even charts
The Economist's break even charts
The way of economist’s break even chart has its own advantages for making an analysis of costs
and break even charts. This method involves calculation of costs, profit and volume over
different range of activities. When shown in graph, revenue shows curvilinear trend (Schlicht,
2012).
Organization can increase its sale by making a reduction in its selling price and thus total
revenue do not make an increase simultaneously with the output and thus revenue shows
curvilinear trend. On the other side, variable costs make an increase at the time of low sales and
low production made by the organization and this happens because of increase in the cost of
operations. It is said that once if the business maintains its efficiency in operations, the costs
increases very slowly and thus becomes less steeply and make an increase in linear graph. But, if
⊘ This is a preview!⊘
Do you want full access?
Subscribe today to unlock all pages.
Trusted by 1+ million students worldwide
Performance Management 4
the production activity is carried beyond the capacity of the plant than it will lead towards
problem of breakdown and costs make an increase and thus it can be analyzed that the business
will have two breakeven points (Osterwalder and Pigneur, 2010).
The Accountant's break even charts
The other method is accountant’s way of making an analysis on costs and revenue and stated that
they have a relationship between them which is linear. It can be analyzed that both the
Accountant's break even charts and Economist's break even charts are different from each other
but they have same fundamentals. The major difference in the accountant’s way is that it put its
focus on prediction of relationship of cost-volume-profit (CVP) in the relevant range where
business is bringing constant returns to scale (Coase, 2012) . This can be stated that both the
methods use costs and revenue in the relevant range.
Analysis of CVP
Assumptions of Analysis of CVP
It can be assumed that all the costs can be categorized into fixed and variable costs. Fixed costs
are the costs that are constant and do not vary with the product ion made by the organization and
the rent of the factory is one of the example. Variable cost can be termed as those cots which are
directly related with the production and changes in proportionate with the output and if the firm
produces more than the variable cost of the firm will increase. Wages of workers is one of the
examples of variable costs. It can also be assumed that the factors which affect revenue and costs
are termed as volume (Foster and Rosenzweig, 2010). CVP is considered important for making
an analysis of CVP. Break even is a calculation to determine the volume of sales at which the
firm will be not making any profits and even not making any losses.
Paraphrase This Document
Need a fresh take? Get an instant paraphrase of this document with our AI Paraphraser
Performance Management 5
In analyzing CVP, an influential function is to analyze the breakeven point in units for the
organization (Nicholson and Snyder, 2014). You can compute the breakeven point in dollars by
multiply the sales price for your manufactured goods by the breakeven point in units.
Fixed cost does not change with the volume of the output which incurs in the scale of production
as fixed by the management of the organization. In case if behavior of cost is linked to sales
income, it shows relationship of cost-volume-profit. In net effect, if change is being made in
volume, variable cost makes variation as per the change incurred in the volume. In this case if
selling price is made fixed, fixed remains fixed and then change in the profits incurred (Moulin,
2014).
Being a manager, one on a continuous basis strives to relate these elements in order to make the
maximum profit. Apart from profit projection, the concept of Cost-Volume-Profit (CVP) is
relevant to virtually all decision-making areas mainly in the short run. The relationship among
cost, revenue and profit at different levels can be highlighted in graphs such as breakeven charts,
profit volume graphs, and different other graphs (Cafferky, 2010).
Profit depends on various factors like manufacturing cost and the volume of the sales. These both
the factors are linked with each other. The volume of costs relies upon the market forces and
volume of production which are related to the costs mainly. The management of the organization
does not possess any control over the market. In order to achieve certain level of effectiveness, it
has to use control and management of expenditure, mainly variable cost (Weiss, 2010). This is
because fixed cost cannot be controlled in the organization. But then, cost is based on the
following factors:
Volume of production
Product mix
Performance Management 6
Internal efficiency and the productivity of the factors of production
Methods of production and technology
Batch Size
Plant Size
Thus it can be analyzed that the cost-volume-profit analysis furnishes the complete scenario of
the profit structure. This will help the management to make a differentiation among the effect of
sales, changes in volume and also the changes made to the price of the product. .In other words,
CVP is a tool of management accounting which helps in showing the relationship between sale
volume, cost and profit (Boland, 2014). CVP analysis also helps in answering various analytical
questions which can prove profitable to the organization.
Advantages of CVP analysis
The Managing Director is now aware of various importance of CVP analysis. CVP is quite
useful in making analysis of breakeven point for the firm. CVP is also helpful in making charts
regarding breakeven point in order to make an identification of the profitability of the
organization (Rader, 2014). The relationships between profit, volume and revenue can be
depicted on the charts. CVP analysis will be helpful in budget planning and thus helpful ion
taking decisions regarding pricing, mix of sales and different product mix. CVP analysis is also
important technique for sensitivity analysis. CVP is very effective in calculation of profits and
sales under different situations. The managing director can use the CVP analysis in order to
determine profits and sales when the unit prices of the products being changed. This will help
the managing director to determine the best alternative for the profitability of the organization.
This will also help in profit planning for the organization (Elsner et. al., 2014) CVP is also
⊘ This is a preview!⊘
Do you want full access?
Subscribe today to unlock all pages.
Trusted by 1+ million students worldwide
Performance Management 7
helpful in making an identification of the profitable products for the organization which can
enhance the profitability of the organization.
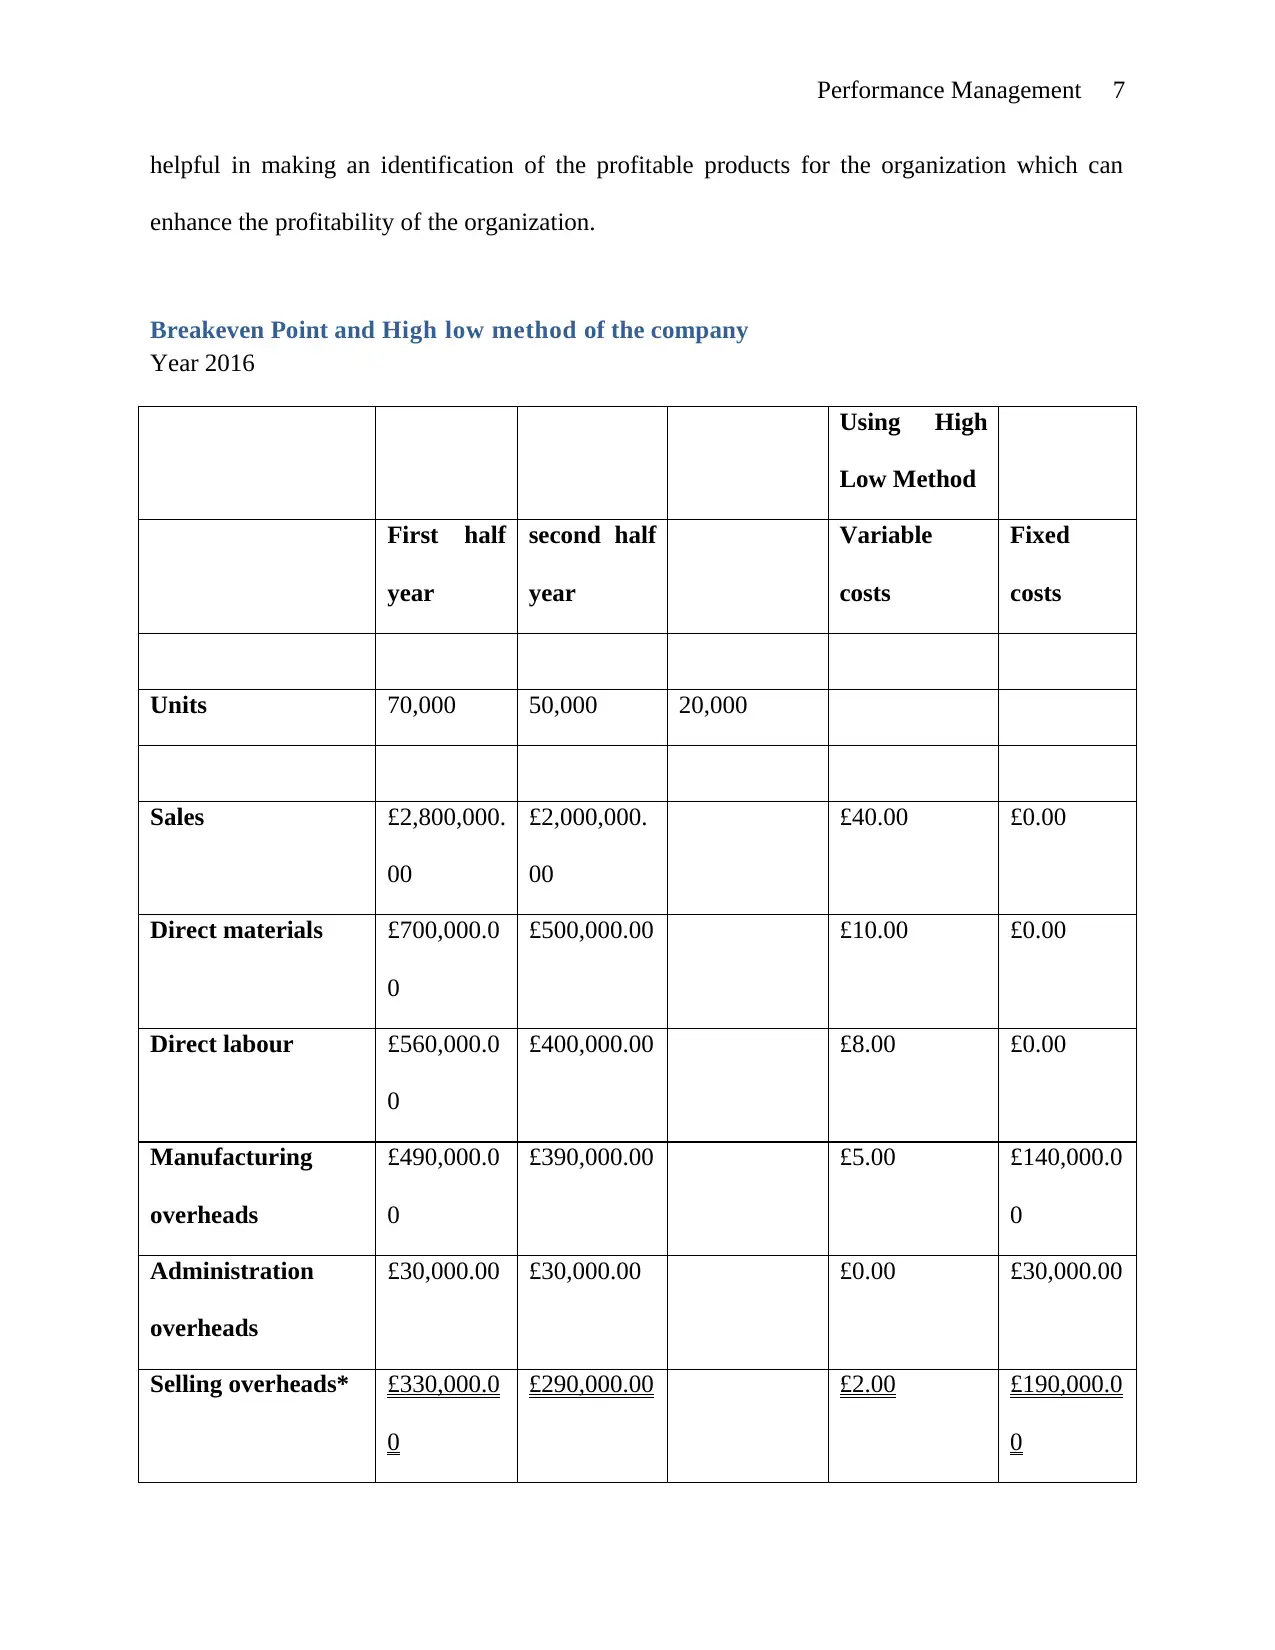
Breakeven Point and High low method of the company
Year 2016
Using High
Low Method
First half
year
second half
year
Variable
costs
Fixed
costs
Units 70,000 50,000 20,000
Sales £2,800,000.
00
£2,000,000.
00
£40.00 £0.00
Direct materials £700,000.0
0
£500,000.00 £10.00 £0.00
Direct labour £560,000.0
0
£400,000.00 £8.00 £0.00
Manufacturing
overheads
£490,000.0
0
£390,000.00 £5.00 £140,000.0
0
Administration
overheads
£30,000.00 £30,000.00 £0.00 £30,000.00
Selling overheads* £330,000.0
0
£290,000.00 £2.00 £190,000.0
0
helpful in making an identification of the profitable products for the organization which can
enhance the profitability of the organization.
Breakeven Point and High low method of the company
Year 2016
Using High
Low Method
First half
year
second half
year
Variable
costs
Fixed
costs
Units 70,000 50,000 20,000
Sales £2,800,000.
00
£2,000,000.
00
£40.00 £0.00
Direct materials £700,000.0
0
£500,000.00 £10.00 £0.00
Direct labour £560,000.0
0
£400,000.00 £8.00 £0.00
Manufacturing
overheads
£490,000.0
0
£390,000.00 £5.00 £140,000.0
0
Administration
overheads
£30,000.00 £30,000.00 £0.00 £30,000.00
Selling overheads* £330,000.0
0
£290,000.00 £2.00 £190,000.0
0
Paraphrase This Document
Need a fresh take? Get an instant paraphrase of this document with our AI Paraphraser
Total Revenue Curve
Total Cost Curve
BEP 1
BEP 1
Economic Profit Zone
Economic Loss Zone
Output in Units
Sales &
Cost
Performance Management 8
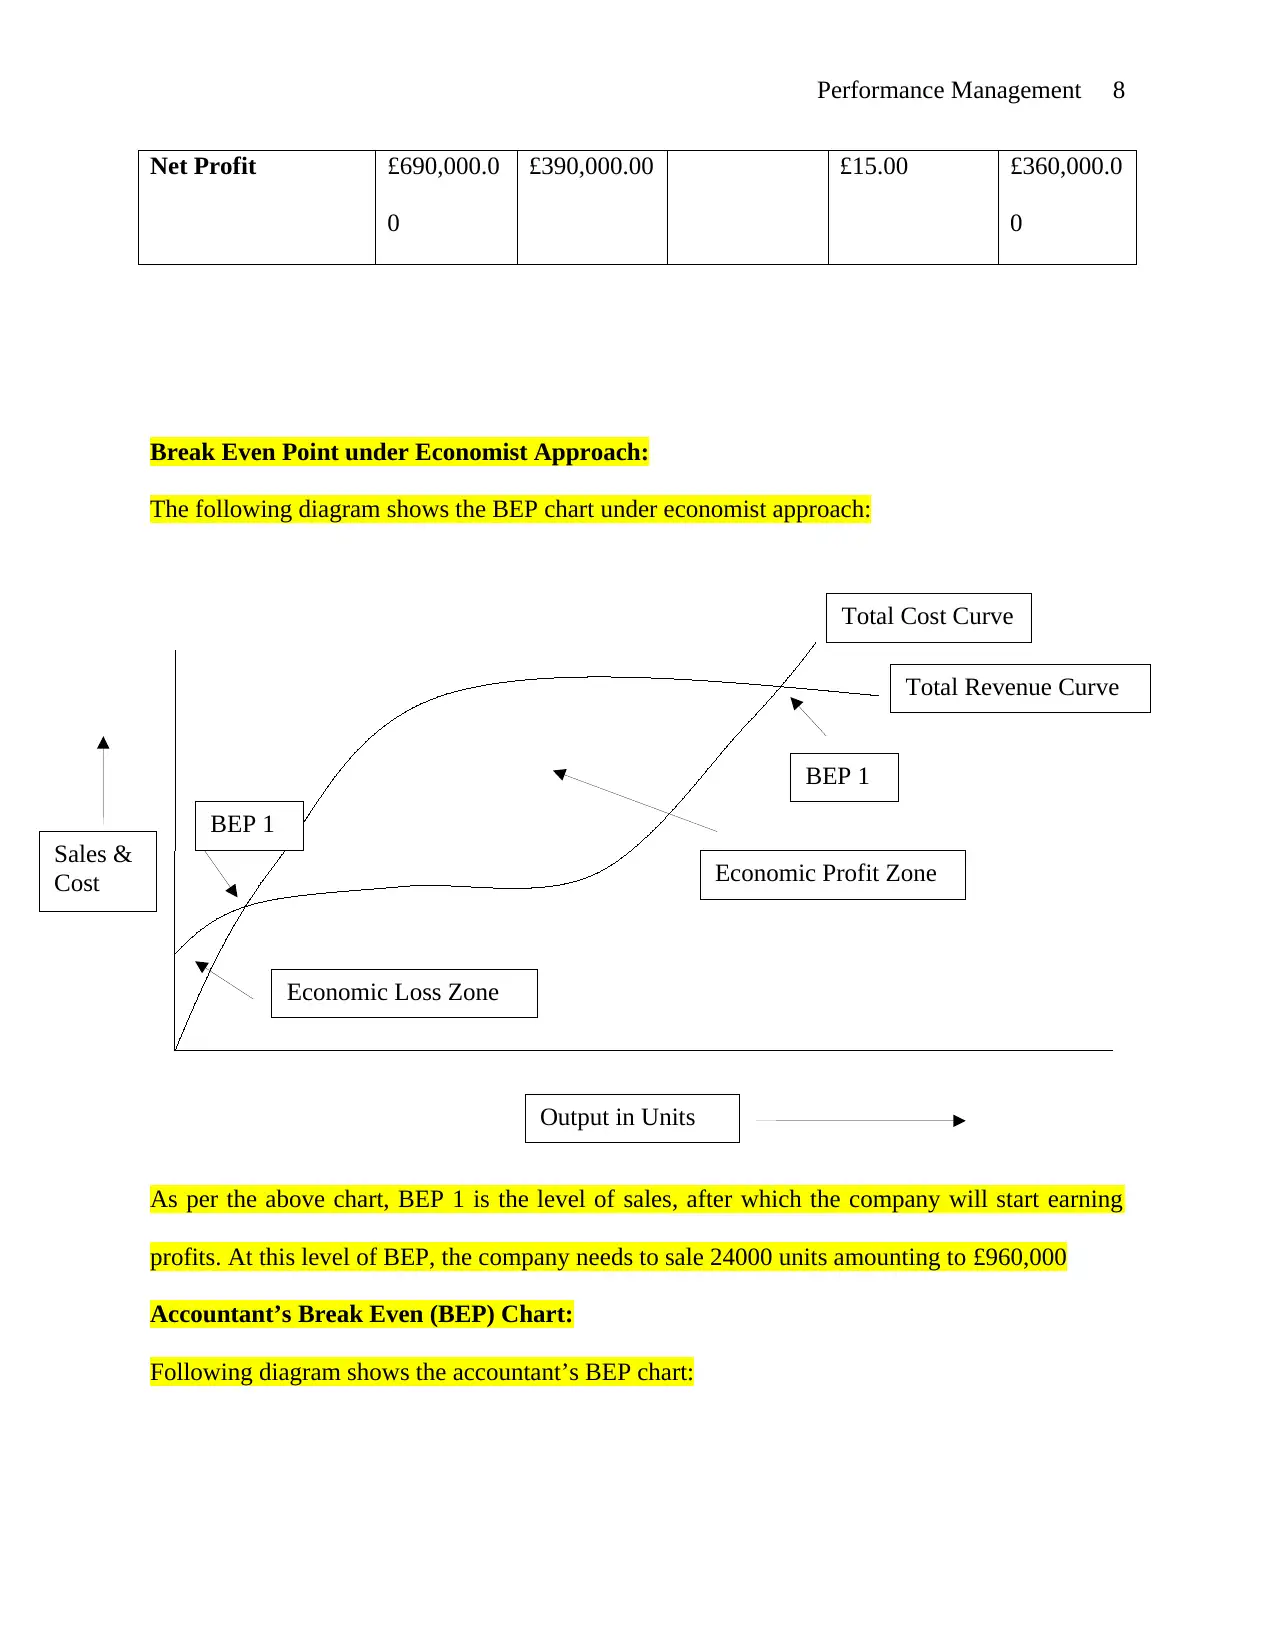
Net Profit £690,000.0
0
£390,000.00 £15.00 £360,000.0
0
Break Even Point under Economist Approach:
The following diagram shows the BEP chart under economist approach:
As per the above chart, BEP 1 is the level of sales, after which the company will start earning
profits. At this level of BEP, the company needs to sale 24000 units amounting to £960,000
Accountant’s Break Even (BEP) Chart:
Following diagram shows the accountant’s BEP chart:
Total Cost Curve
BEP 1
BEP 1
Economic Profit Zone
Economic Loss Zone
Output in Units
Sales &
Cost
Performance Management 8
Net Profit £690,000.0
0
£390,000.00 £15.00 £360,000.0
0
Break Even Point under Economist Approach:
The following diagram shows the BEP chart under economist approach:
As per the above chart, BEP 1 is the level of sales, after which the company will start earning
profits. At this level of BEP, the company needs to sale 24000 units amounting to £960,000
Accountant’s Break Even (BEP) Chart:
Following diagram shows the accountant’s BEP chart:
Output (in Units)
Cost and Revenue
Break Even Point
24000 Units
BEP sales £960,000
Margin of Safety
Performance Management 9
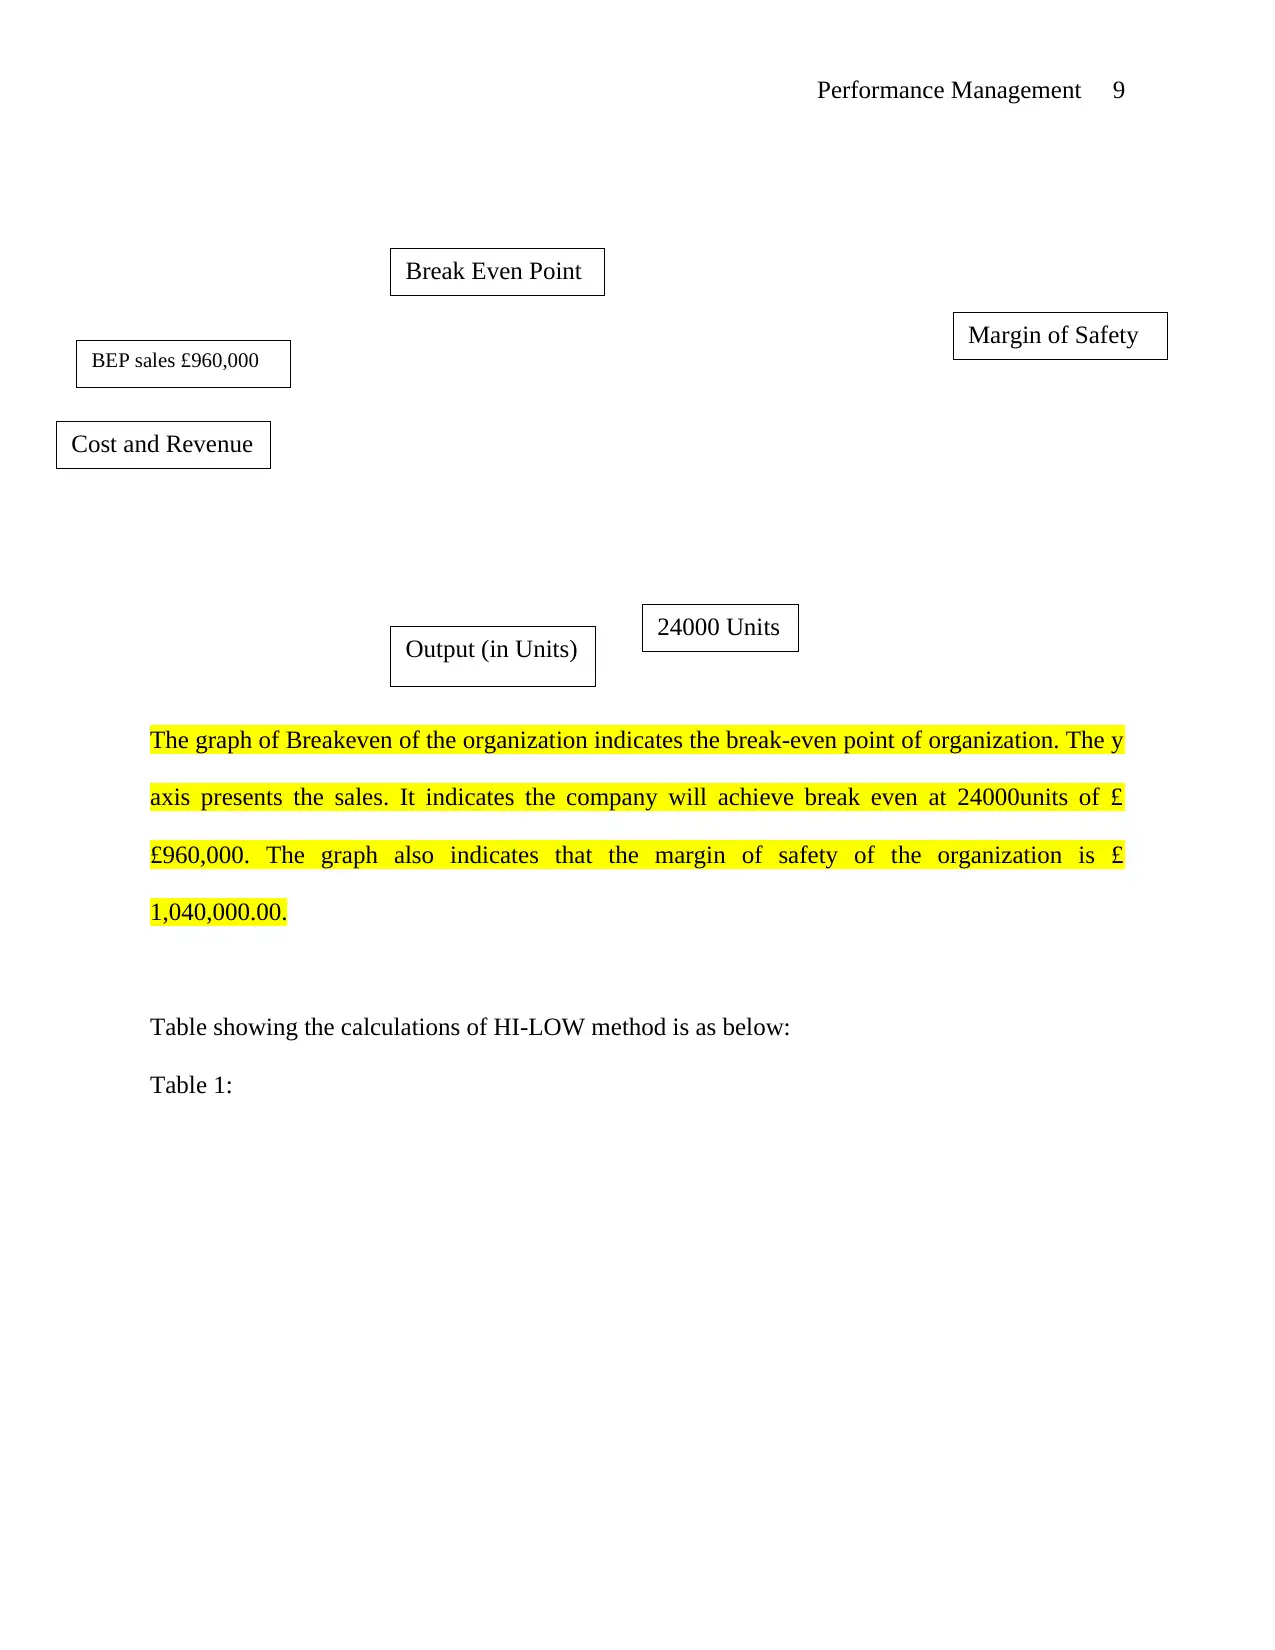
The graph of Breakeven of the organization indicates the break-even point of organization. The y
axis presents the sales. It indicates the company will achieve break even at 24000units of £
£960,000. The graph also indicates that the margin of safety of the organization is £
1,040,000.00.
Table showing the calculations of HI-LOW method is as below:
Table 1:
Cost and Revenue
Break Even Point
24000 Units
BEP sales £960,000
Margin of Safety
Performance Management 9
The graph of Breakeven of the organization indicates the break-even point of organization. The y
axis presents the sales. It indicates the company will achieve break even at 24000units of £
£960,000. The graph also indicates that the margin of safety of the organization is £
1,040,000.00.
Table showing the calculations of HI-LOW method is as below:
Table 1:
⊘ This is a preview!⊘
Do you want full access?
Subscribe today to unlock all pages.
Trusted by 1+ million students worldwide
Performance Management 10
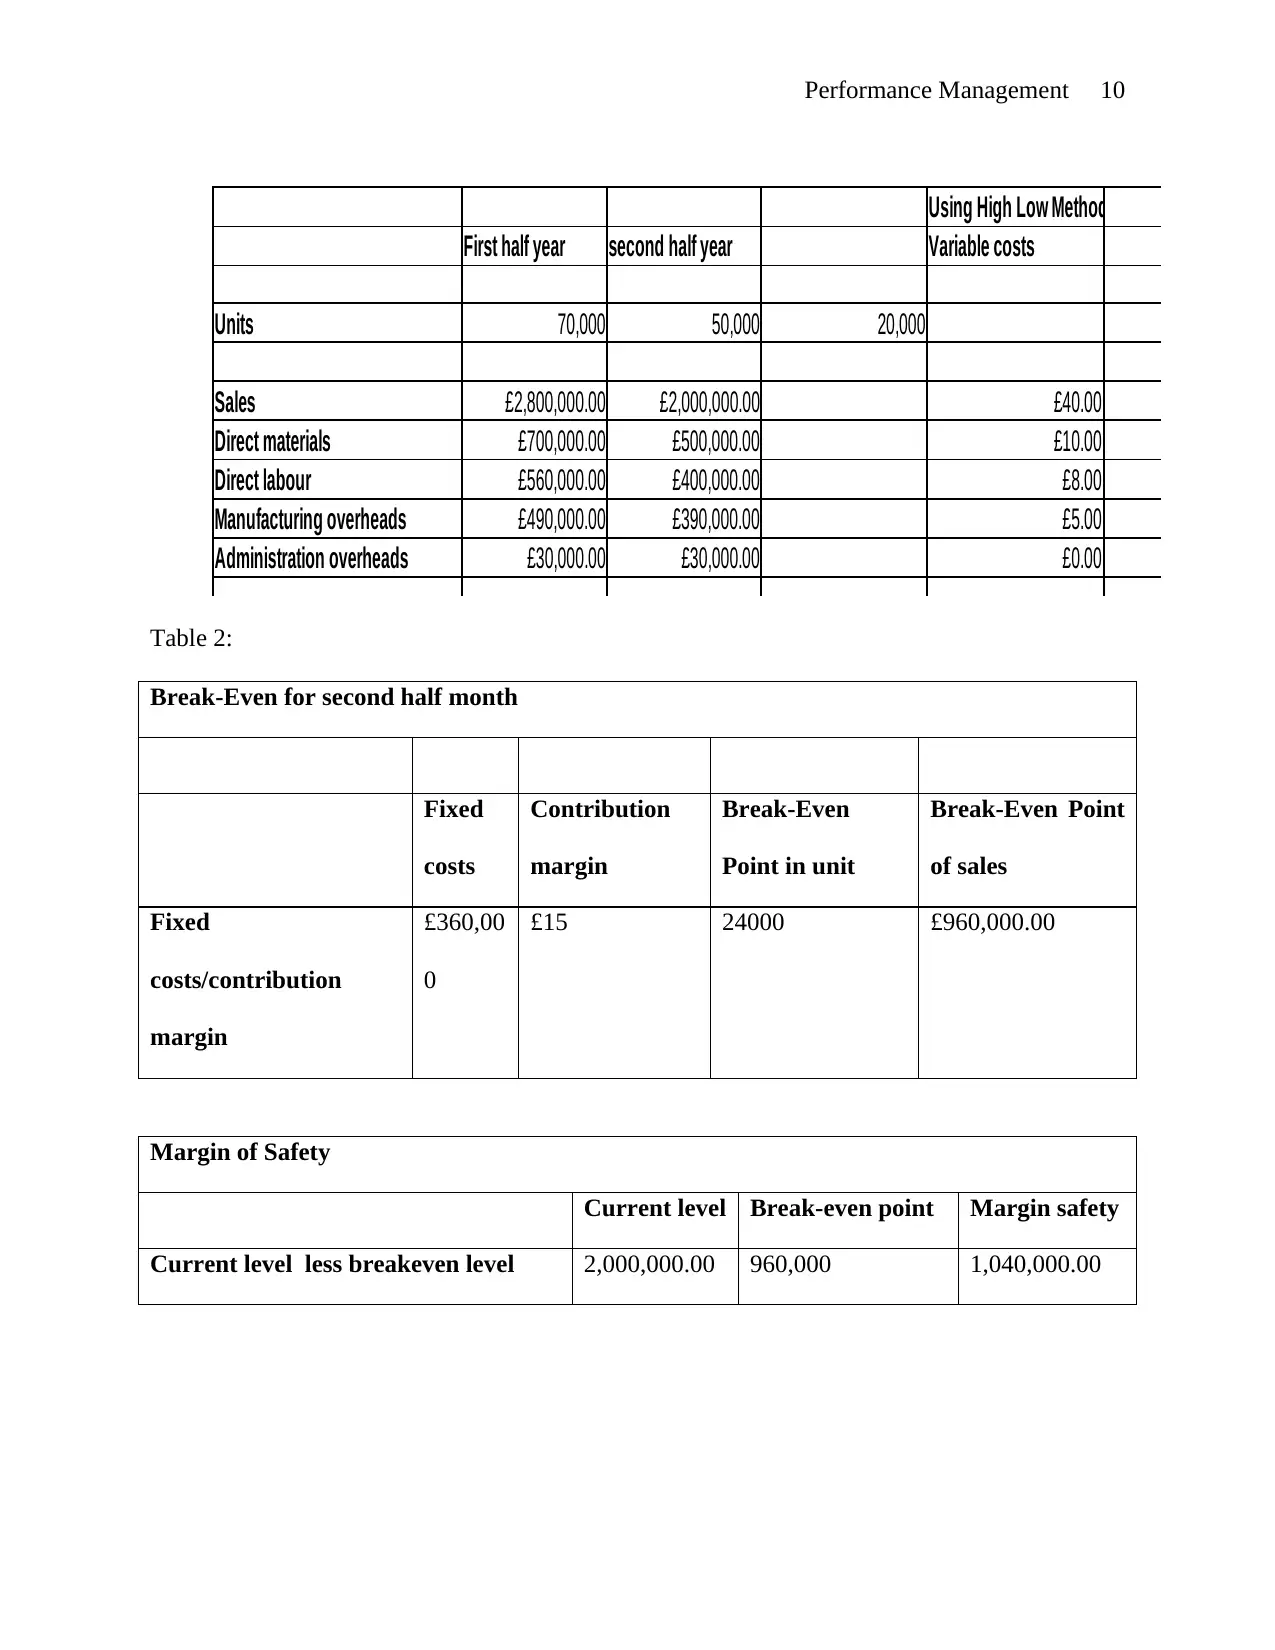
Using High Low Method
First half year second half year Variable costs
Units 70,000 50,000 20,000
Sales £2,800,000.00 £2,000,000.00 £40.00
Direct materials £700,000.00 £500,000.00 £10.00
Direct labour £560,000.00 £400,000.00 £8.00
Manufacturing overheads £490,000.00 £390,000.00 £5.00
Administration overheads £30,000.00 £30,000.00 £0.00
Table 2:
Break-Even for second half month
Fixed
costs
Contribution
margin
Break-Even
Point in unit
Break-Even Point
of sales
Fixed
costs/contribution
margin
£360,00
0
£15 24000 £960,000.00
Margin of Safety
Current level Break-even point Margin safety
Current level less breakeven level 2,000,000.00 960,000 1,040,000.00
Paraphrase This Document
Need a fresh take? Get an instant paraphrase of this document with our AI Paraphraser
Performance Management 11
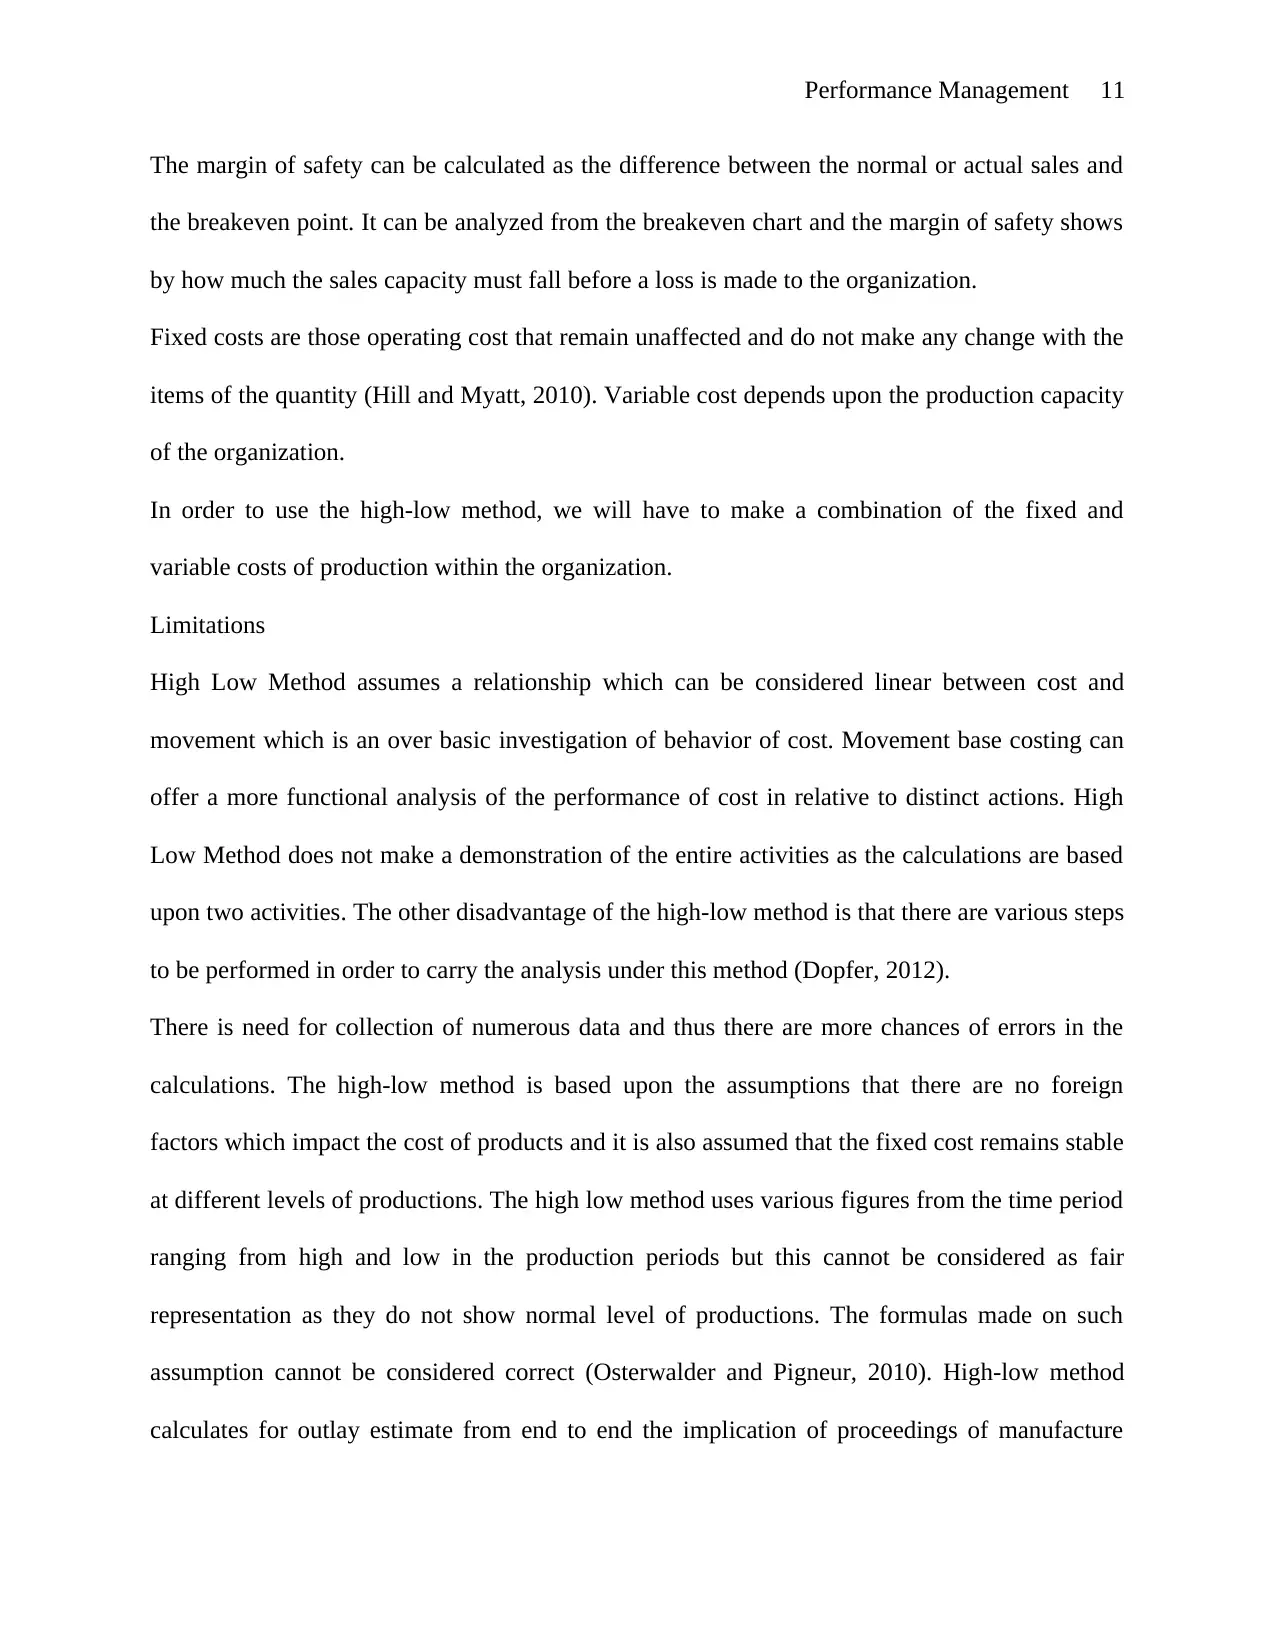
The margin of safety can be calculated as the difference between the normal or actual sales and
the breakeven point. It can be analyzed from the breakeven chart and the margin of safety shows
by how much the sales capacity must fall before a loss is made to the organization.
Fixed costs are those operating cost that remain unaffected and do not make any change with the
items of the quantity (Hill and Myatt, 2010). Variable cost depends upon the production capacity
of the organization.
In order to use the high-low method, we will have to make a combination of the fixed and
variable costs of production within the organization.
Limitations
High Low Method assumes a relationship which can be considered linear between cost and
movement which is an over basic investigation of behavior of cost. Movement base costing can
offer a more functional analysis of the performance of cost in relative to distinct actions. High
Low Method does not make a demonstration of the entire activities as the calculations are based
upon two activities. The other disadvantage of the high-low method is that there are various steps
to be performed in order to carry the analysis under this method (Dopfer, 2012).
There is need for collection of numerous data and thus there are more chances of errors in the
calculations. The high-low method is based upon the assumptions that there are no foreign
factors which impact the cost of products and it is also assumed that the fixed cost remains stable
at different levels of productions. The high low method uses various figures from the time period
ranging from high and low in the production periods but this cannot be considered as fair
representation as they do not show normal level of productions. The formulas made on such
assumption cannot be considered correct (Osterwalder and Pigneur, 2010). High-low method
calculates for outlay estimate from end to end the implication of proceedings of manufacture
Performance Management 12
levels from past periods in the business. This makes the limited scope of applicability of the
method to business with prior account and thus this creates discrimination.
Linear regression analysis will overcome the limitation of the present method by making an
incorporation of all the activities and thus this method is more reliable. Linear regression can be
considered as an alternative for this method (Black et. al., 2012).
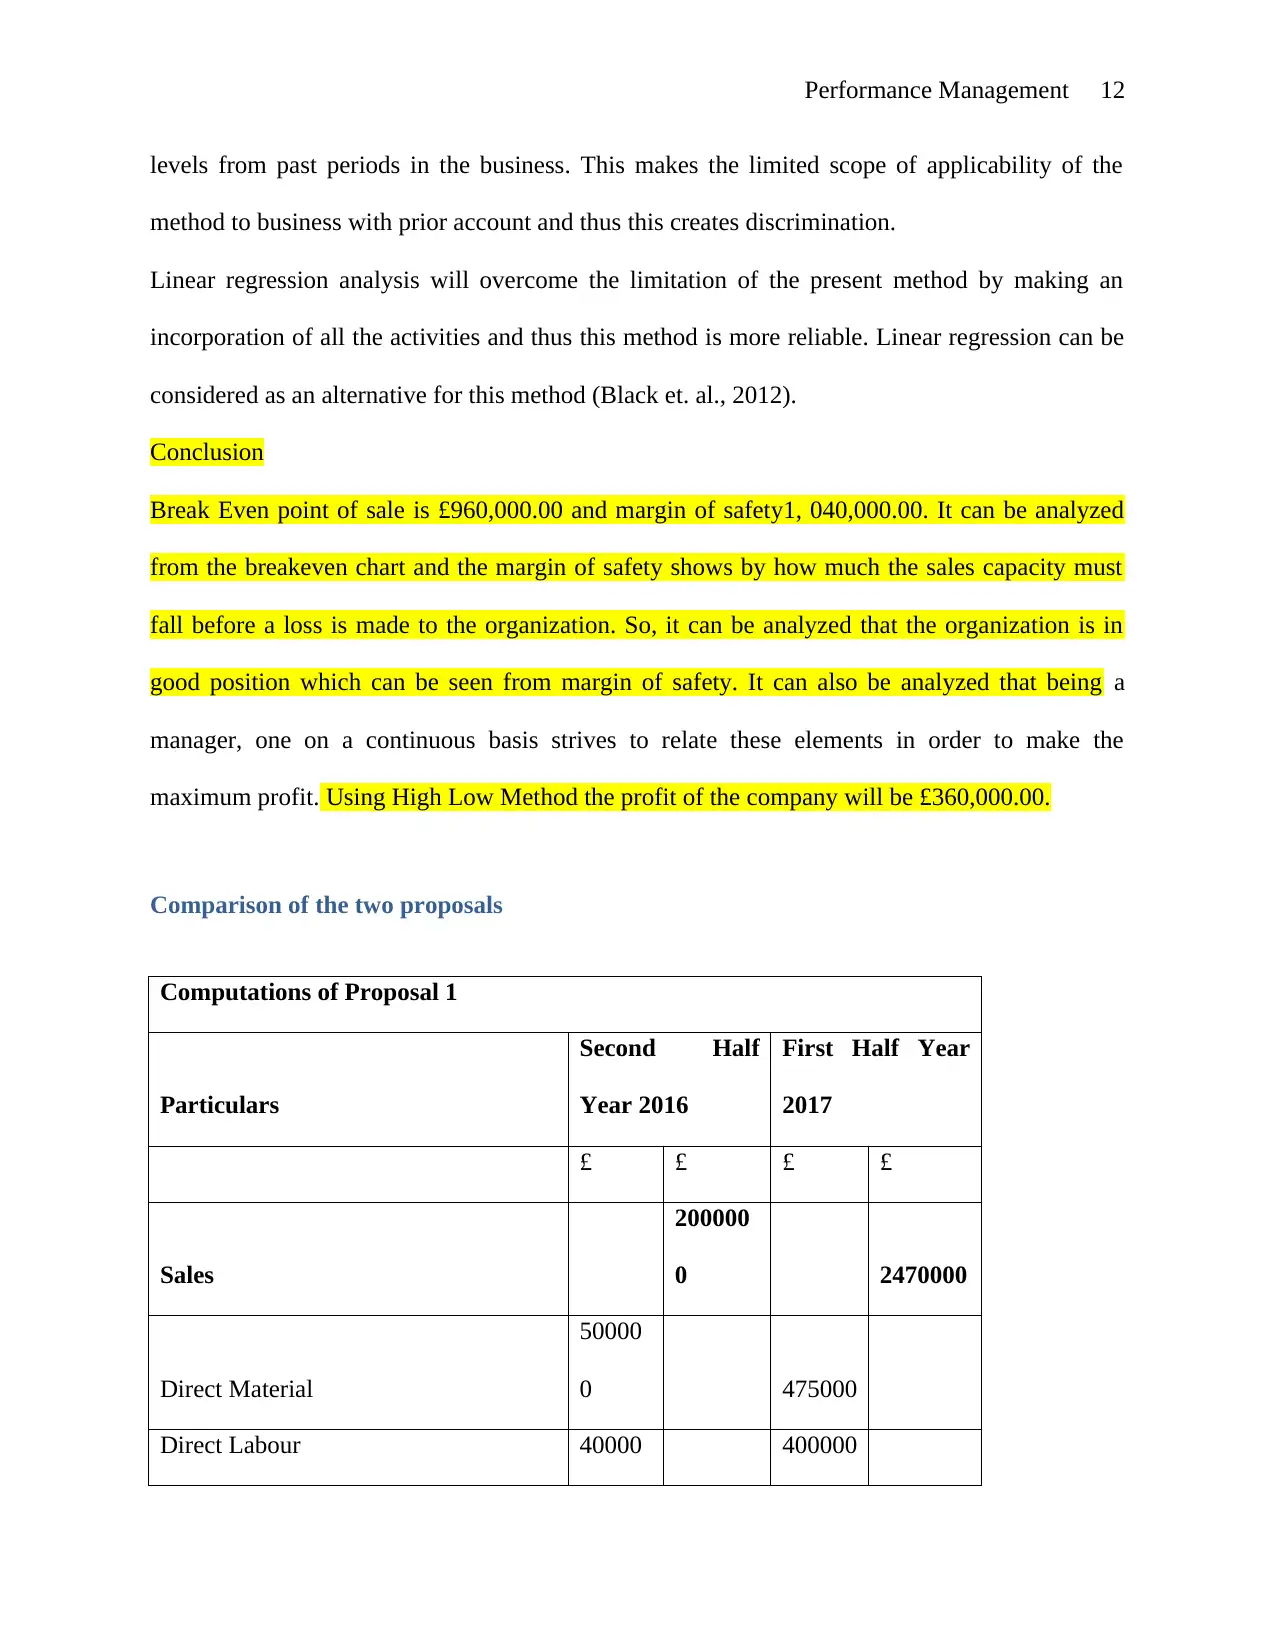
Conclusion
Break Even point of sale is £960,000.00 and margin of safety1, 040,000.00. It can be analyzed
from the breakeven chart and the margin of safety shows by how much the sales capacity must
fall before a loss is made to the organization. So, it can be analyzed that the organization is in
good position which can be seen from margin of safety. It can also be analyzed that being a
manager, one on a continuous basis strives to relate these elements in order to make the
maximum profit. Using High Low Method the profit of the company will be £360,000.00.
Comparison of the two proposals
Computations of Proposal 1
Particulars
Second Half
Year 2016
First Half Year
2017
£ £ £ £
Sales
200000
0 2470000
Direct Material
50000
0 475000
Direct Labour 40000 400000
levels from past periods in the business. This makes the limited scope of applicability of the
method to business with prior account and thus this creates discrimination.
Linear regression analysis will overcome the limitation of the present method by making an
incorporation of all the activities and thus this method is more reliable. Linear regression can be
considered as an alternative for this method (Black et. al., 2012).
Conclusion
Break Even point of sale is £960,000.00 and margin of safety1, 040,000.00. It can be analyzed
from the breakeven chart and the margin of safety shows by how much the sales capacity must
fall before a loss is made to the organization. So, it can be analyzed that the organization is in
good position which can be seen from margin of safety. It can also be analyzed that being a
manager, one on a continuous basis strives to relate these elements in order to make the
maximum profit. Using High Low Method the profit of the company will be £360,000.00.
Comparison of the two proposals
Computations of Proposal 1
Particulars
Second Half
Year 2016
First Half Year
2017
£ £ £ £
Sales
200000
0 2470000
Direct Material
50000
0 475000
Direct Labour 40000 400000
⊘ This is a preview!⊘
Do you want full access?
Subscribe today to unlock all pages.
Trusted by 1+ million students worldwide
1 out of 23
Related Documents


Your All-in-One AI-Powered Toolkit for Academic Success.
+13062052269
info@desklib.com
Available 24*7 on WhatsApp / Email
![[object Object]](/_next/static/media/star-bottom.7253800d.svg)
Unlock your academic potential
Copyright © 2020–2026 A2Z Services. All Rights Reserved. Developed and managed by ZUCOL.