Performance Management Report: Employee Satisfaction Analysis
VerifiedAdded on 2022/09/26
|13
|4034
|18
Report
AI Summary
This report analyzes the relationship between workplace factors and employee job satisfaction within a call center environment. The study investigates how factors such as gender, age, average call handling time, stress levels, supervisor support, and perceptions of justice (distributional and procedural) influence employee satisfaction. The research employs descriptive statistics, ANOVA, regression, and correlation analysis to examine these relationships, revealing insights into gender inequality, age demographics, and the impact of various workplace elements on employee satisfaction levels. The report provides a detailed overview of the methodology, results, and discussion, culminating in actionable recommendations for the organization to improve employee satisfaction and overall performance, including addressing gender imbalances, managing stress, and enhancing supervisor support.
Performance management
1
<University>
Performance management
<Author>
31 August 2024
<Professor’s name>
<Program of Study>
1
<University>
Performance management
<Author>
31 August 2024
<Professor’s name>
<Program of Study>
Paraphrase This Document
Need a fresh take? Get an instant paraphrase of this document with our AI Paraphraser
Performance management
2
Executive summary
There is increase in employee dissatisfaction at workplace. Therefore, there is need to
investigate how workplace factors influences job satisfaction. The main objective is to
determine the relationship between workplace factors and employee job satisfaction.
According to the results, there is gender inequality in the workplace with more male
employees than female employees. In addition, the organization prefers male employees than
female employees. The majority of the employees are aged between 25-29 years followed by
employees aged 30-34 years. In addition, the organization prefers young employees aged
below 35 years unlike to old generations. This may be contributed by the fact that these age
groups are very energetic and take their roles at workplace more seriously to enhance
organizational performance in general.
Furthermore, there is a wide variation in the dataset as far as the average handling time for
calls is concerned. This is evidenced in the minimum and maximum values of the average
handling time for calls accounting for 190.1 and 545 respectively. Only, 18% of the
employees are very satisfied with their work while most of the employees 64% of the
employees are moderately satisfied. Unfortunately, only 17% of the employees are not
satisfied at all and this affects their performance within the organization.
There is a need for the organization to address gender inequality issues at the workplace by
giving both the male and female employees equal opportunities when it comes to
employment. In addition, young people tend to be dissatisfied at workplace due to their
anxiety to rise in ranks, therefore, the organization should consider employing old people
who have experienced and only willing to work as they wait for their retirement age.
Furthermore, there is a need to address employee and organizational related factors that
contribute to job dissatisfaction. These factors include the average handling time for calls,
stress, supervisor support, distributional justice, and procedural justice. For instance, there is
need to establish a psychosocial support center within the organization to handle stress-
related issues among employees.
Performance management
3
Table of Contents
Executive summary....................................................................................................................2
Background Information............................................................................................................2
Methodology..............................................................................................................................3
Results........................................................................................................................................4
Discussion..................................................................................................................................6
Recommendations......................................................................................................................8
Conclusion..................................................................................................................................8
References................................................................................................................................10
⊘ This is a preview!⊘
Do you want full access?
Subscribe today to unlock all pages.
Trusted by 1+ million students worldwide
Performance management
4
Background Information
Usually, the work environment plays an important role in employee job satisfaction, (Platis,
Reklitis, and Zimeras, 2015). In addition, different factors such as age, gender, experience,
remuneration services in one way or the other affect employee performance.
For example, research has shown that employees working in tight environment with strict
supervision and no supervisor support are likely to be unproductive because they tend to be
dissatisfied at workplace, (O'Leary, and Hunt, 2016). Moreover, people tend to regroup
themselves at the workplace and these groups perform differently in any given workplace.
As a result, workplace environment is a determinant of employee satisfaction, (Lăzăroiu,
2015). Therefore, all the organizations should see to it that their employees have a conducive
working environment where they feel a sense of belonging, receive supervisor support and
have a well-balanced work life.
There is increase in employee dissatisfaction at workplace. These challenges are believed to
emerge from the managers, employee co-workers, gender, and nature of the job which at
times can be too demanding. Therefore, there is need to investigate how workplace factors
affect job satisfaction among employees within the organization.
Research objectives of the study include to determine the relationship between workplace
factors and employee job satisfaction. The study is basically on employee job satisfaction and
workplace-related factors. Moreover, the study is limited to the fact that there is unreliability
of the respondents who in one way or the other gave incorrect information like age due to
fear of fault-finding, (Nardi, 2018). However, the study participants were assured of their
privacy and confidentiality and that the research was basically for academic purposes.
In every organization, all the employees are assigned specific roles and responsibilities where
the employer expects them to be productive, (DeCenzo, Robbins, and Verhulst, 2016).
However, some employees have not demonstrated their productivity in the workplace, and
this influences their job performance in general.
The work environment is a key factor in the success of the organization. Research has shown
that the organization with conducive work environment performs better compared to the
organization without conducive work environment, (Raziq, and Maulabakhsh, 2015). In
addition, some organization has taken responsibility to improve professional development
course of its employees and this enhances job satisfaction.
Methodology
By definition, a research design refers to the action plan that a researcher put in place to solve
the problem identified, (Mertler, 2019). It includes various parts ranging from but not limited
to the design, target population, sampling technique, data collection instruments, analysis
plan, and ethical issues in research. Some researchers have considered a research design to
mean the structures with the study in general upon which the study is being conducted and is
likely to be extended as well, (Yin, 2017). Therefore, for the achievement of the research
objectives, research design is a key priority to be identified, (McCusker, and Gunaydin,
2015). For example, this task, descriptive study design has been used to establish solutions as
far as employee satisfaction and variable of interest is concerned. The design is relevant in
the sense that it provides numerical findings on other categorical variables which is easy to
understand and interpret, (Kumar, 2019).
Paraphrase This Document
Need a fresh take? Get an instant paraphrase of this document with our AI Paraphraser
Performance management
5
In research, a population is defined as the total subjects of interest to be reached with specific
information under inquiry, (Ary, Jacobs, Irvine, and Walker, 2018). For example, (Drake,
Rancilio, and Stafford, 2017) defined a population as the entire subjects that the research is
targeting in order to obtain relevant information that can fulfill the objectives of the research.
Basically, the sample size in research has been defined as a subset of a population that the
researcher picks to obtain specific information, (Tillé, and Matei, 2016). This sample size is
normally viewed to be representative enough so that the sample statistics obtained from the
sample can be generalized to other populations. In addition, some researchers defined sample
size as the target unit that a researcher is specifically interested in to elicit required dataset,
(Lazar, Feng, and Hochheiser, 2017). Therefore, it is nearly impossible to collect data from
the entire population due to its expensiveness and time-consuming. Hence, sample size
determination is key in research, (Opie, 2019).
Sampling technique occurs when the researcher specifically chooses persons to participate in
the research under investigation, (Hancock, and Algozzine, 2016). The chosen sample size is
a representation of the entire population. In this research, a random sampling technique has
been considered since it is simple and not time-consuming, (Tyrer, and Heyman, 2016).
Moreover, this technique gives equal opportunities to the participants thus reducing the
researcher’s biases, (Patten, and Newhart, 2017). Through this technique, the participants will
be given questionnaires to fill based on the time of their availability.
The data used in the analysis is quantitative in nature hence can be edited, explored and
reproduced during the analysis, (Simpson, 2015). In order to present the findings, both
descriptive and inferential statistics have been used. Descriptive statistics include presenting
data in table format, use of frequency distributions, percentages, counts and graphs. On the
other hand, inferential statistics include regression and correlational analysis, (Yuan, et, al,
2019). These inferential statistics have been used to draw and make conclusions concerning
the relationship between job satisfaction and other variables if interest, (Cooper, Hedges, and
Valentine, 2019).
Results
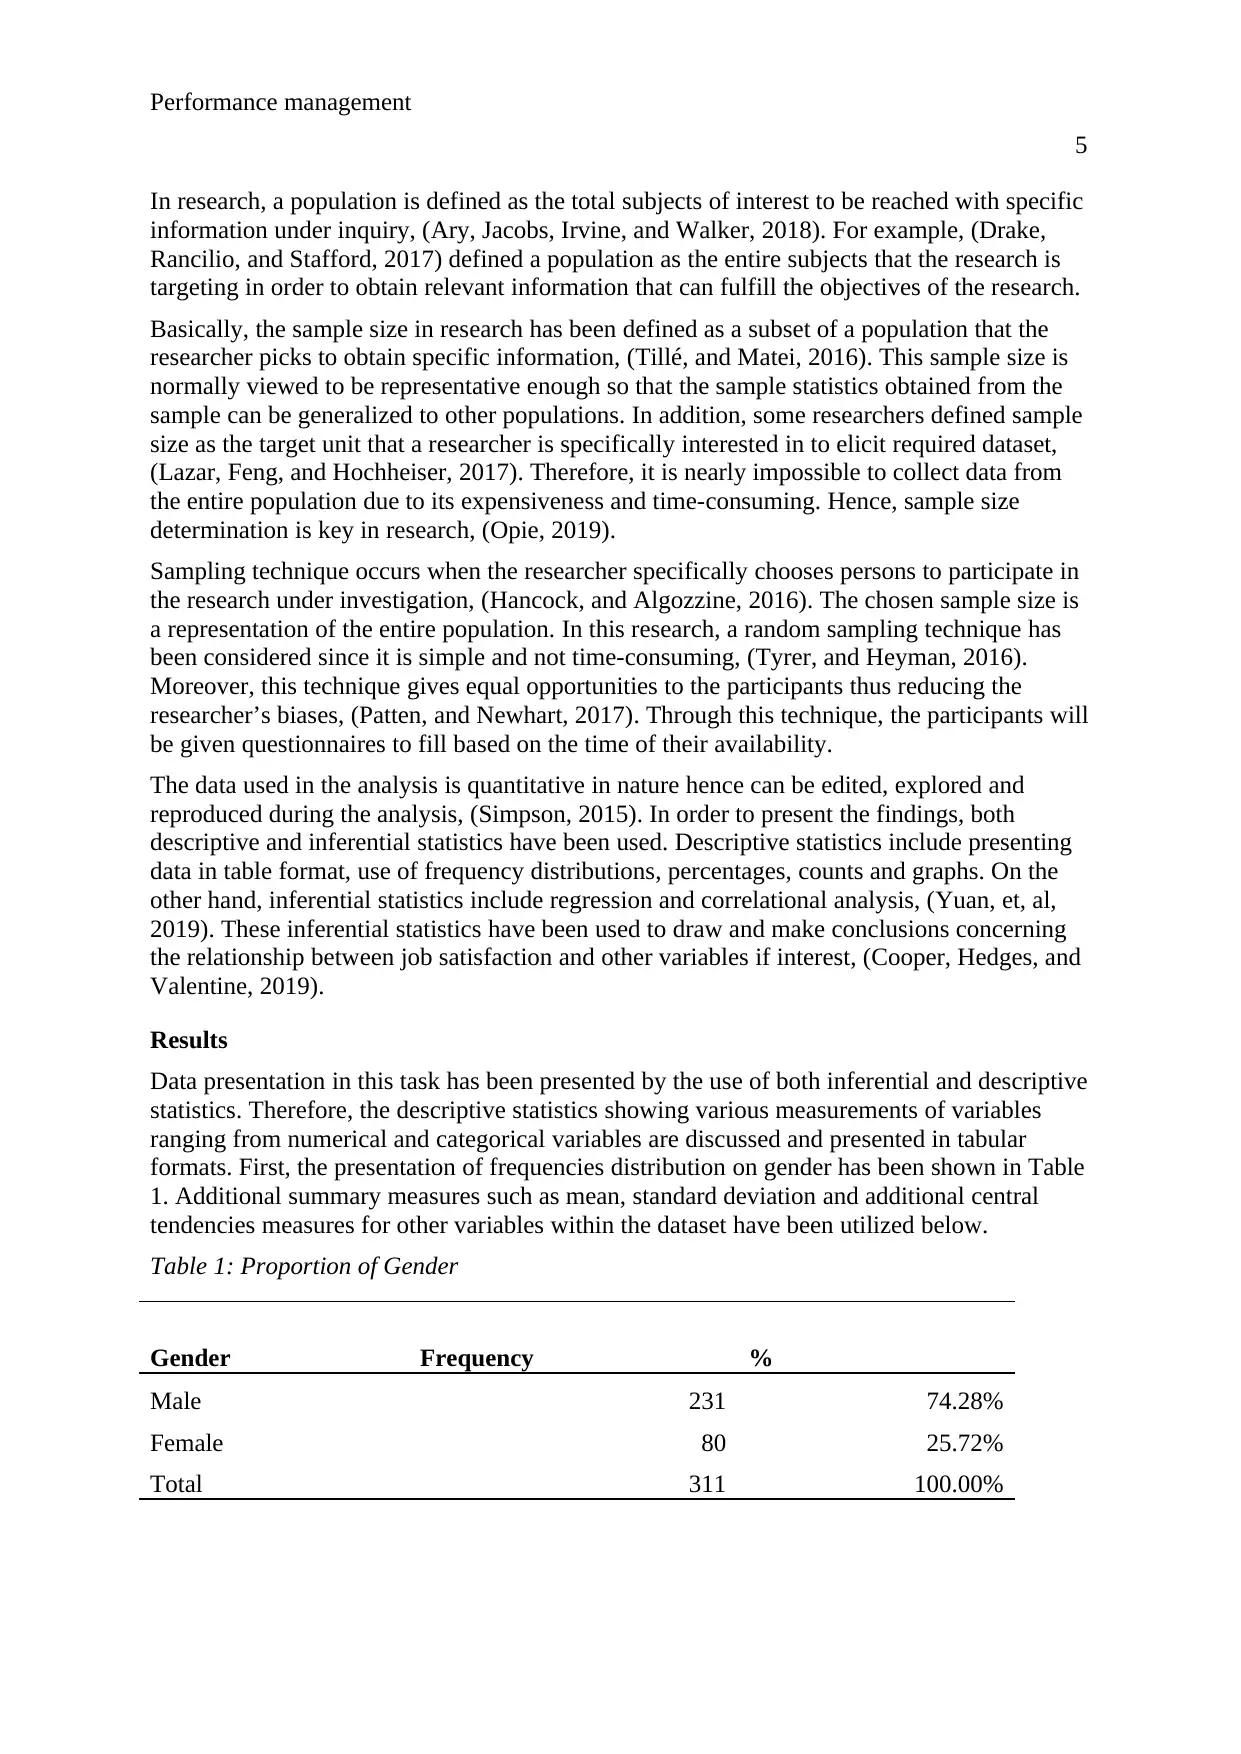
Data presentation in this task has been presented by the use of both inferential and descriptive
statistics. Therefore, the descriptive statistics showing various measurements of variables
ranging from numerical and categorical variables are discussed and presented in tabular
formats. First, the presentation of frequencies distribution on gender has been shown in Table
1. Additional summary measures such as mean, standard deviation and additional central
tendencies measures for other variables within the dataset have been utilized below.
Table 1: Proportion of Gender
Gender Frequency %
Male 231 74.28%
Female 80 25.72%
Total 311 100.00%
5
In research, a population is defined as the total subjects of interest to be reached with specific
information under inquiry, (Ary, Jacobs, Irvine, and Walker, 2018). For example, (Drake,
Rancilio, and Stafford, 2017) defined a population as the entire subjects that the research is
targeting in order to obtain relevant information that can fulfill the objectives of the research.
Basically, the sample size in research has been defined as a subset of a population that the
researcher picks to obtain specific information, (Tillé, and Matei, 2016). This sample size is
normally viewed to be representative enough so that the sample statistics obtained from the
sample can be generalized to other populations. In addition, some researchers defined sample
size as the target unit that a researcher is specifically interested in to elicit required dataset,
(Lazar, Feng, and Hochheiser, 2017). Therefore, it is nearly impossible to collect data from
the entire population due to its expensiveness and time-consuming. Hence, sample size
determination is key in research, (Opie, 2019).
Sampling technique occurs when the researcher specifically chooses persons to participate in
the research under investigation, (Hancock, and Algozzine, 2016). The chosen sample size is
a representation of the entire population. In this research, a random sampling technique has
been considered since it is simple and not time-consuming, (Tyrer, and Heyman, 2016).
Moreover, this technique gives equal opportunities to the participants thus reducing the
researcher’s biases, (Patten, and Newhart, 2017). Through this technique, the participants will
be given questionnaires to fill based on the time of their availability.
The data used in the analysis is quantitative in nature hence can be edited, explored and
reproduced during the analysis, (Simpson, 2015). In order to present the findings, both
descriptive and inferential statistics have been used. Descriptive statistics include presenting
data in table format, use of frequency distributions, percentages, counts and graphs. On the
other hand, inferential statistics include regression and correlational analysis, (Yuan, et, al,
2019). These inferential statistics have been used to draw and make conclusions concerning
the relationship between job satisfaction and other variables if interest, (Cooper, Hedges, and
Valentine, 2019).
Results
Data presentation in this task has been presented by the use of both inferential and descriptive
statistics. Therefore, the descriptive statistics showing various measurements of variables
ranging from numerical and categorical variables are discussed and presented in tabular
formats. First, the presentation of frequencies distribution on gender has been shown in Table
1. Additional summary measures such as mean, standard deviation and additional central
tendencies measures for other variables within the dataset have been utilized below.
Table 1: Proportion of Gender
Gender Frequency %
Male 231 74.28%
Female 80 25.72%
Total 311 100.00%
Performance management
6
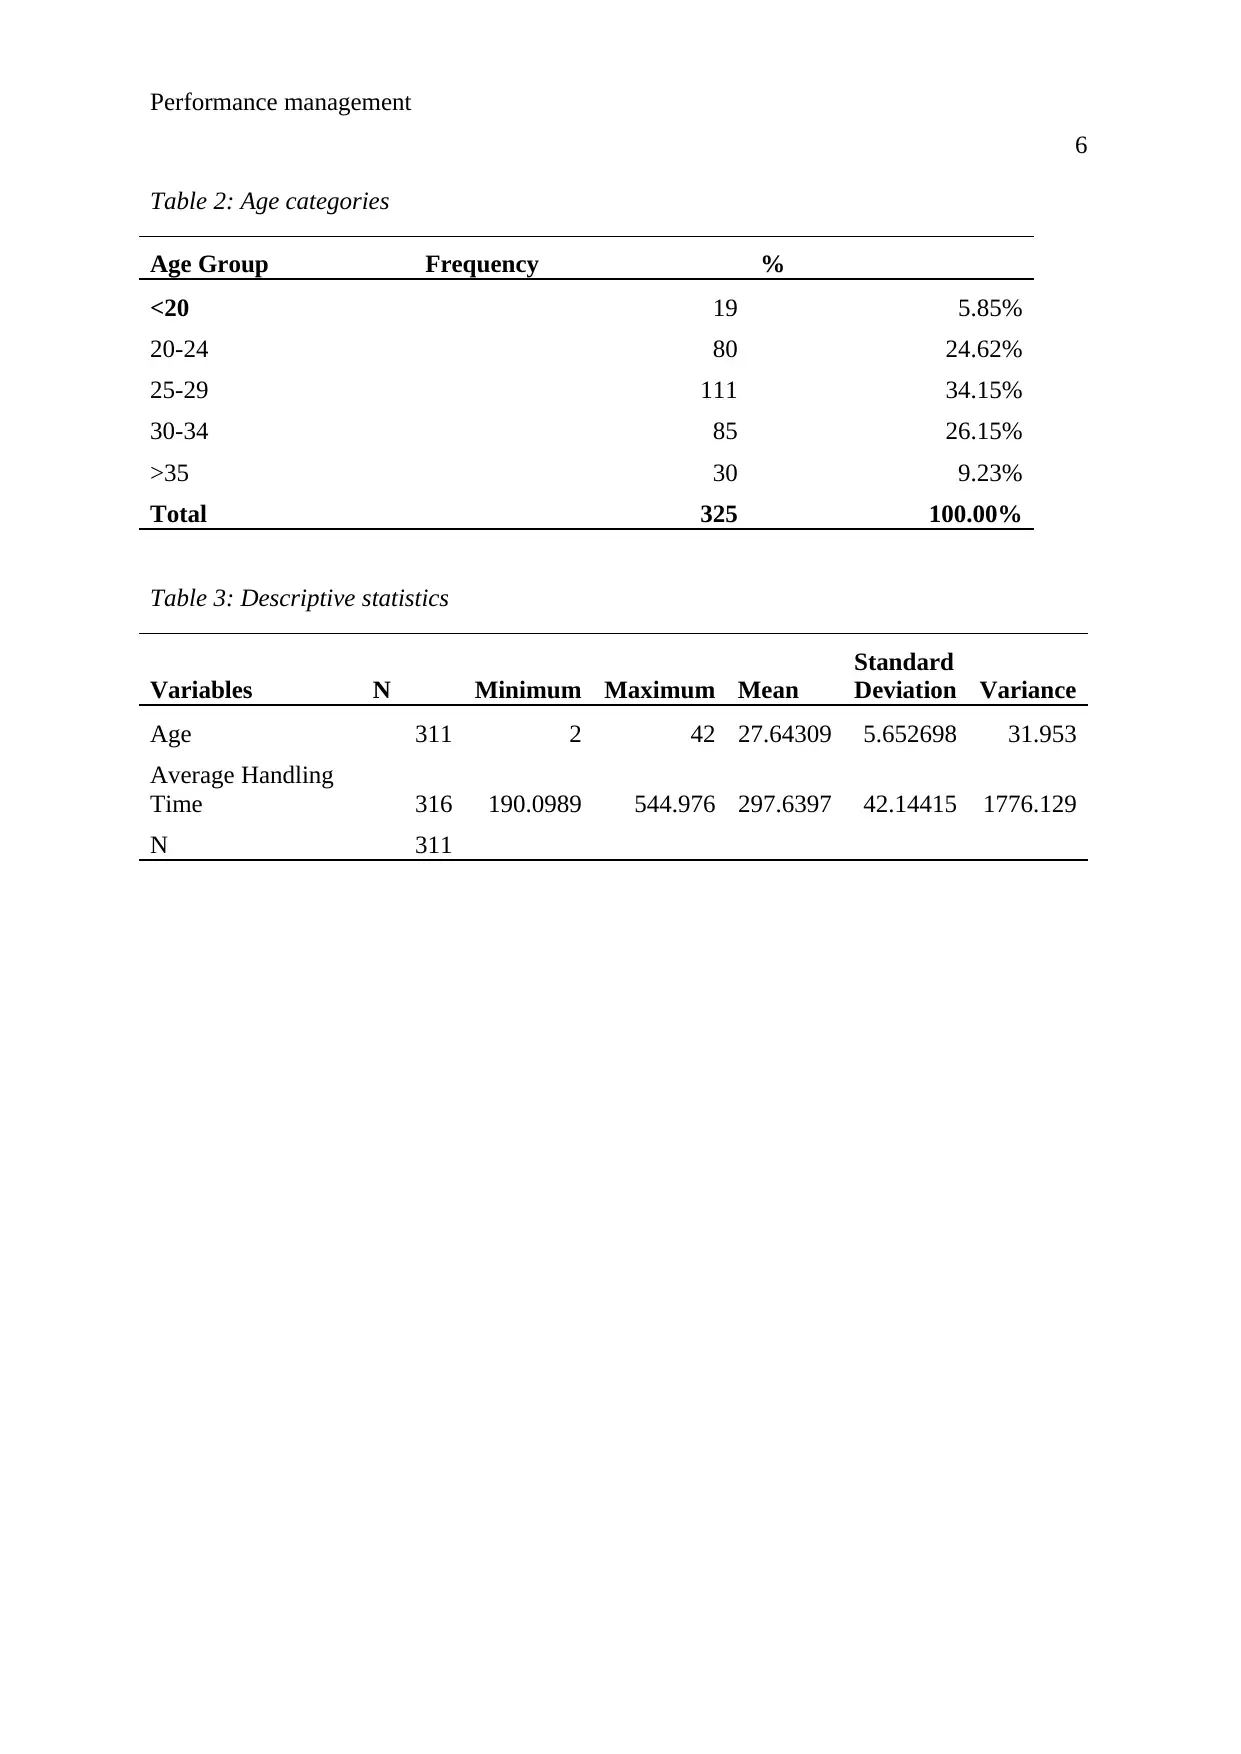
Table 2: Age categories
Age Group Frequency %
<20 19 5.85%
20-24 80 24.62%
25-29 111 34.15%
30-34 85 26.15%
>35 30 9.23%
Total 325 100.00%
Table 3: Descriptive statistics
Variables N Minimum Maximum Mean
Standard
Deviation Variance
Age 311 2 42 27.64309 5.652698 31.953
Average Handling
Time 316 190.0989 544.976 297.6397 42.14415 1776.129
N 311
6
Table 2: Age categories
Age Group Frequency %
<20 19 5.85%
20-24 80 24.62%
25-29 111 34.15%
30-34 85 26.15%
>35 30 9.23%
Total 325 100.00%
Table 3: Descriptive statistics
Variables N Minimum Maximum Mean
Standard
Deviation Variance
Age 311 2 42 27.64309 5.652698 31.953
Average Handling
Time 316 190.0989 544.976 297.6397 42.14415 1776.129
N 311
⊘ This is a preview!⊘
Do you want full access?
Subscribe today to unlock all pages.
Trusted by 1+ million students worldwide
Performance management
7
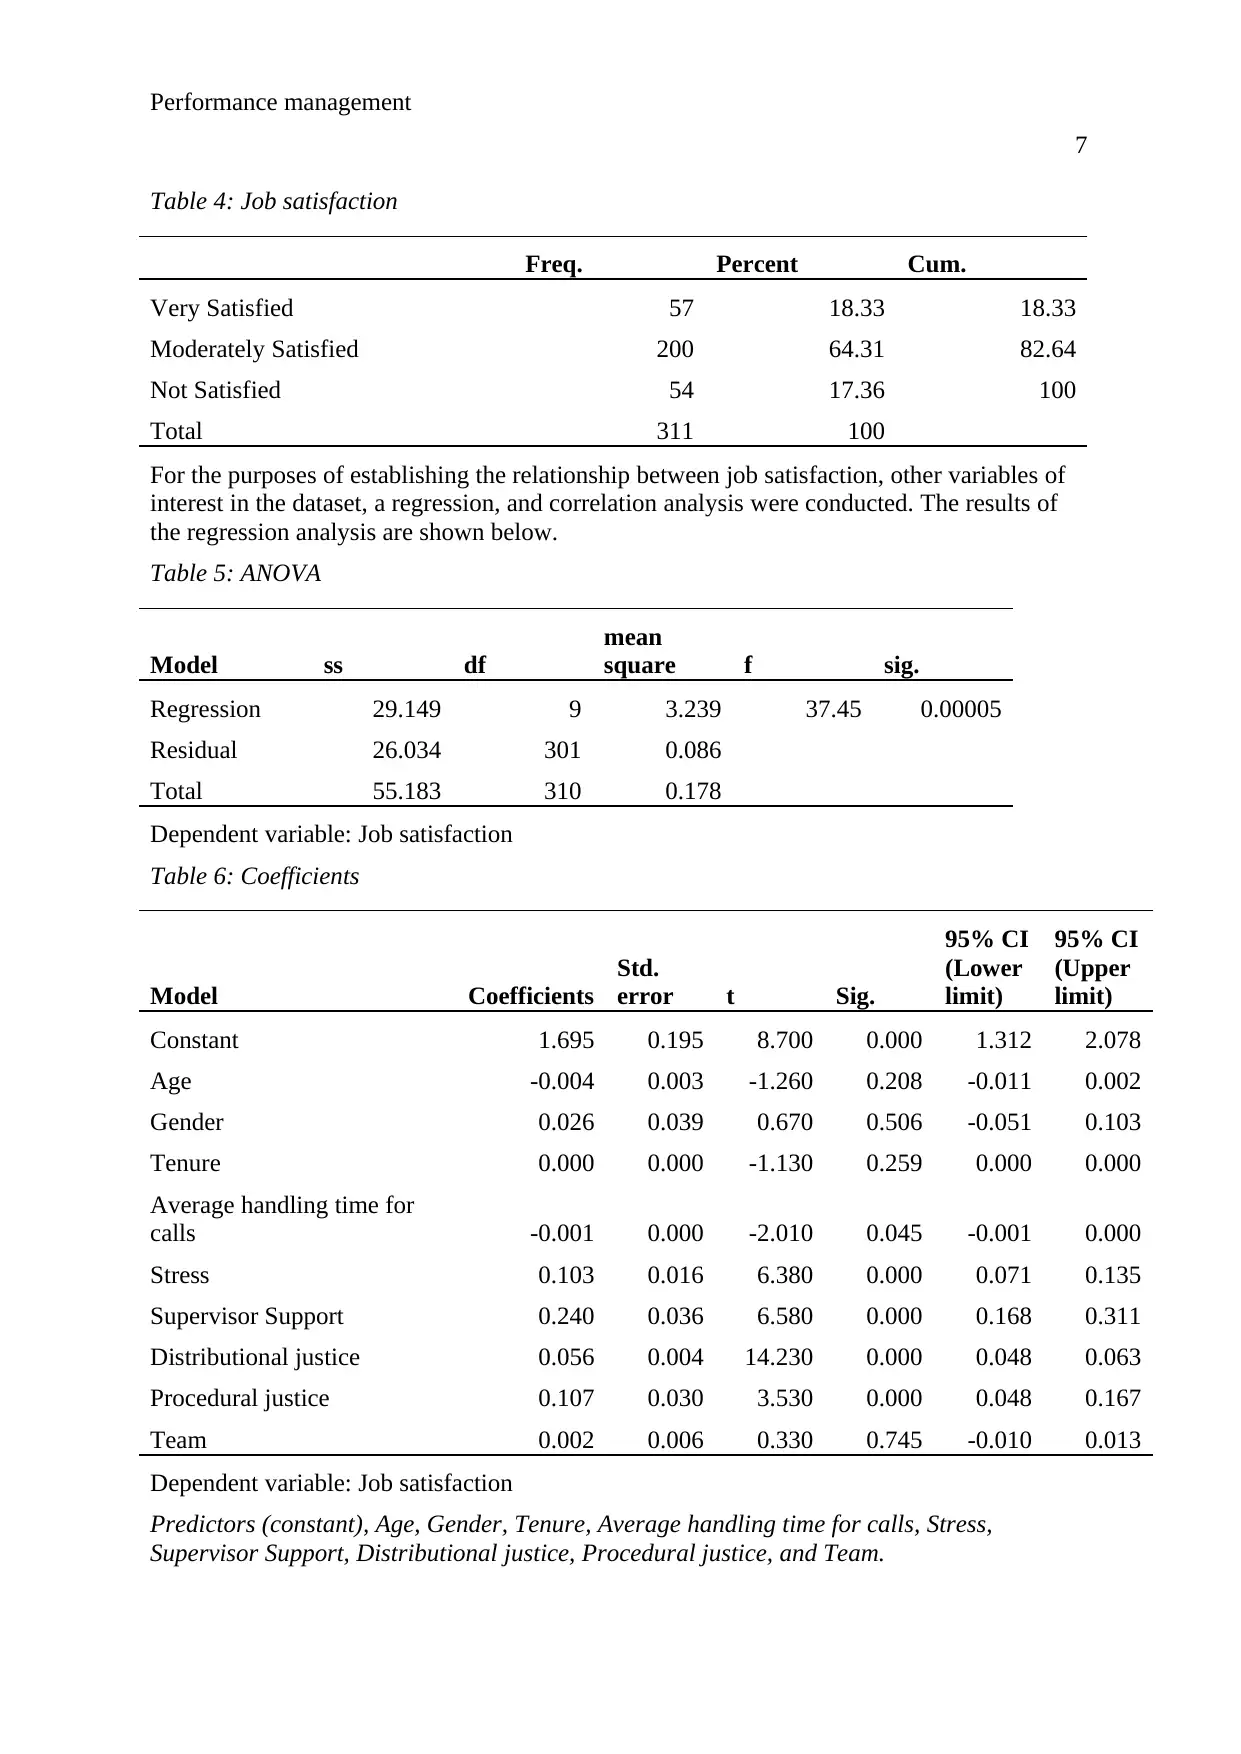
Table 4: Job satisfaction
Freq. Percent Cum.
Very Satisfied 57 18.33 18.33
Moderately Satisfied 200 64.31 82.64
Not Satisfied 54 17.36 100
Total 311 100
For the purposes of establishing the relationship between job satisfaction, other variables of
interest in the dataset, a regression, and correlation analysis were conducted. The results of
the regression analysis are shown below.
Table 5: ANOVA
Model ss df
mean
square f sig.
Regression 29.149 9 3.239 37.45 0.00005
Residual 26.034 301 0.086
Total 55.183 310 0.178
Dependent variable: Job satisfaction
Table 6: Coefficients
Model Coefficients
Std.
error t Sig.
95% CI
(Lower
limit)
95% CI
(Upper
limit)
Constant 1.695 0.195 8.700 0.000 1.312 2.078
Age -0.004 0.003 -1.260 0.208 -0.011 0.002
Gender 0.026 0.039 0.670 0.506 -0.051 0.103
Tenure 0.000 0.000 -1.130 0.259 0.000 0.000
Average handling time for
calls -0.001 0.000 -2.010 0.045 -0.001 0.000
Stress 0.103 0.016 6.380 0.000 0.071 0.135
Supervisor Support 0.240 0.036 6.580 0.000 0.168 0.311
Distributional justice 0.056 0.004 14.230 0.000 0.048 0.063
Procedural justice 0.107 0.030 3.530 0.000 0.048 0.167
Team 0.002 0.006 0.330 0.745 -0.010 0.013
Dependent variable: Job satisfaction
Predictors (constant), Age, Gender, Tenure, Average handling time for calls, Stress,
Supervisor Support, Distributional justice, Procedural justice, and Team.
7
Table 4: Job satisfaction
Freq. Percent Cum.
Very Satisfied 57 18.33 18.33
Moderately Satisfied 200 64.31 82.64
Not Satisfied 54 17.36 100
Total 311 100
For the purposes of establishing the relationship between job satisfaction, other variables of
interest in the dataset, a regression, and correlation analysis were conducted. The results of
the regression analysis are shown below.
Table 5: ANOVA
Model ss df
mean
square f sig.
Regression 29.149 9 3.239 37.45 0.00005
Residual 26.034 301 0.086
Total 55.183 310 0.178
Dependent variable: Job satisfaction
Table 6: Coefficients
Model Coefficients
Std.
error t Sig.
95% CI
(Lower
limit)
95% CI
(Upper
limit)
Constant 1.695 0.195 8.700 0.000 1.312 2.078
Age -0.004 0.003 -1.260 0.208 -0.011 0.002
Gender 0.026 0.039 0.670 0.506 -0.051 0.103
Tenure 0.000 0.000 -1.130 0.259 0.000 0.000
Average handling time for
calls -0.001 0.000 -2.010 0.045 -0.001 0.000
Stress 0.103 0.016 6.380 0.000 0.071 0.135
Supervisor Support 0.240 0.036 6.580 0.000 0.168 0.311
Distributional justice 0.056 0.004 14.230 0.000 0.048 0.063
Procedural justice 0.107 0.030 3.530 0.000 0.048 0.167
Team 0.002 0.006 0.330 0.745 -0.010 0.013
Dependent variable: Job satisfaction
Predictors (constant), Age, Gender, Tenure, Average handling time for calls, Stress,
Supervisor Support, Distributional justice, Procedural justice, and Team.
Paraphrase This Document
Need a fresh take? Get an instant paraphrase of this document with our AI Paraphraser
Performance management
8
Discussion
The findings of this study indicate the presence of inequality when it comes to the proportion
of differences in gender. For instance, the results confirmed that male participants were more
than female participants. In total, there are 231 (74,3%), male employees, as compared to 80
(25.72%) female employees. This is a clear indication that the number of male employees in
the organization outweighs that of female employees. Based on this finding, it is evidenced
that the organization prefers male employees than female employees.
Furthermore, the minimum and maximum ages recorded are 2 and 42 respectively.
Seemingly, aged 2 individuals in one way or the other might have given wrong age category
in the survey and this affects data quality. The majority of the employees are aged between
25-29 years; 111 (34.2%) followed by 85 (26.2%) who were aged 30-34 years. The youngest
number of employees less than 20 years accounted for 19 (5.9%). From the results, there is
evidence that the organization prefers young employees aged below 35 years. This may be
contributed by the fact that these age groups are very energetic and take their roles at
workplace more seriously to enhance organizational performance in general.
Moreover, the mean age among the employees is 27.6 with a standard deviation of 5.7 which
shows that nearly young people work in the organization. In addition, the average handling
Performance management
9
time for calls is 297.6 with a standard deviation of 42.1. Given that the standard deviation is
large, it implies that there is a wide variation in the dataset as far as the average handling time
for calls is concerned. This is evidenced in the minimum and maximum values of the average
handling time for calls accounting for 190.1 and 545 respectively.
On job satisfaction, the findings clearly show that only 57 (18.3%) of the employees are very
satisfied with their work while most of the employees; 200 (64.3%) are moderately satisfied.
Unfortunately, 54 (17.4%) of the employees are not satisfied at all and this affects their
performance within the organization.
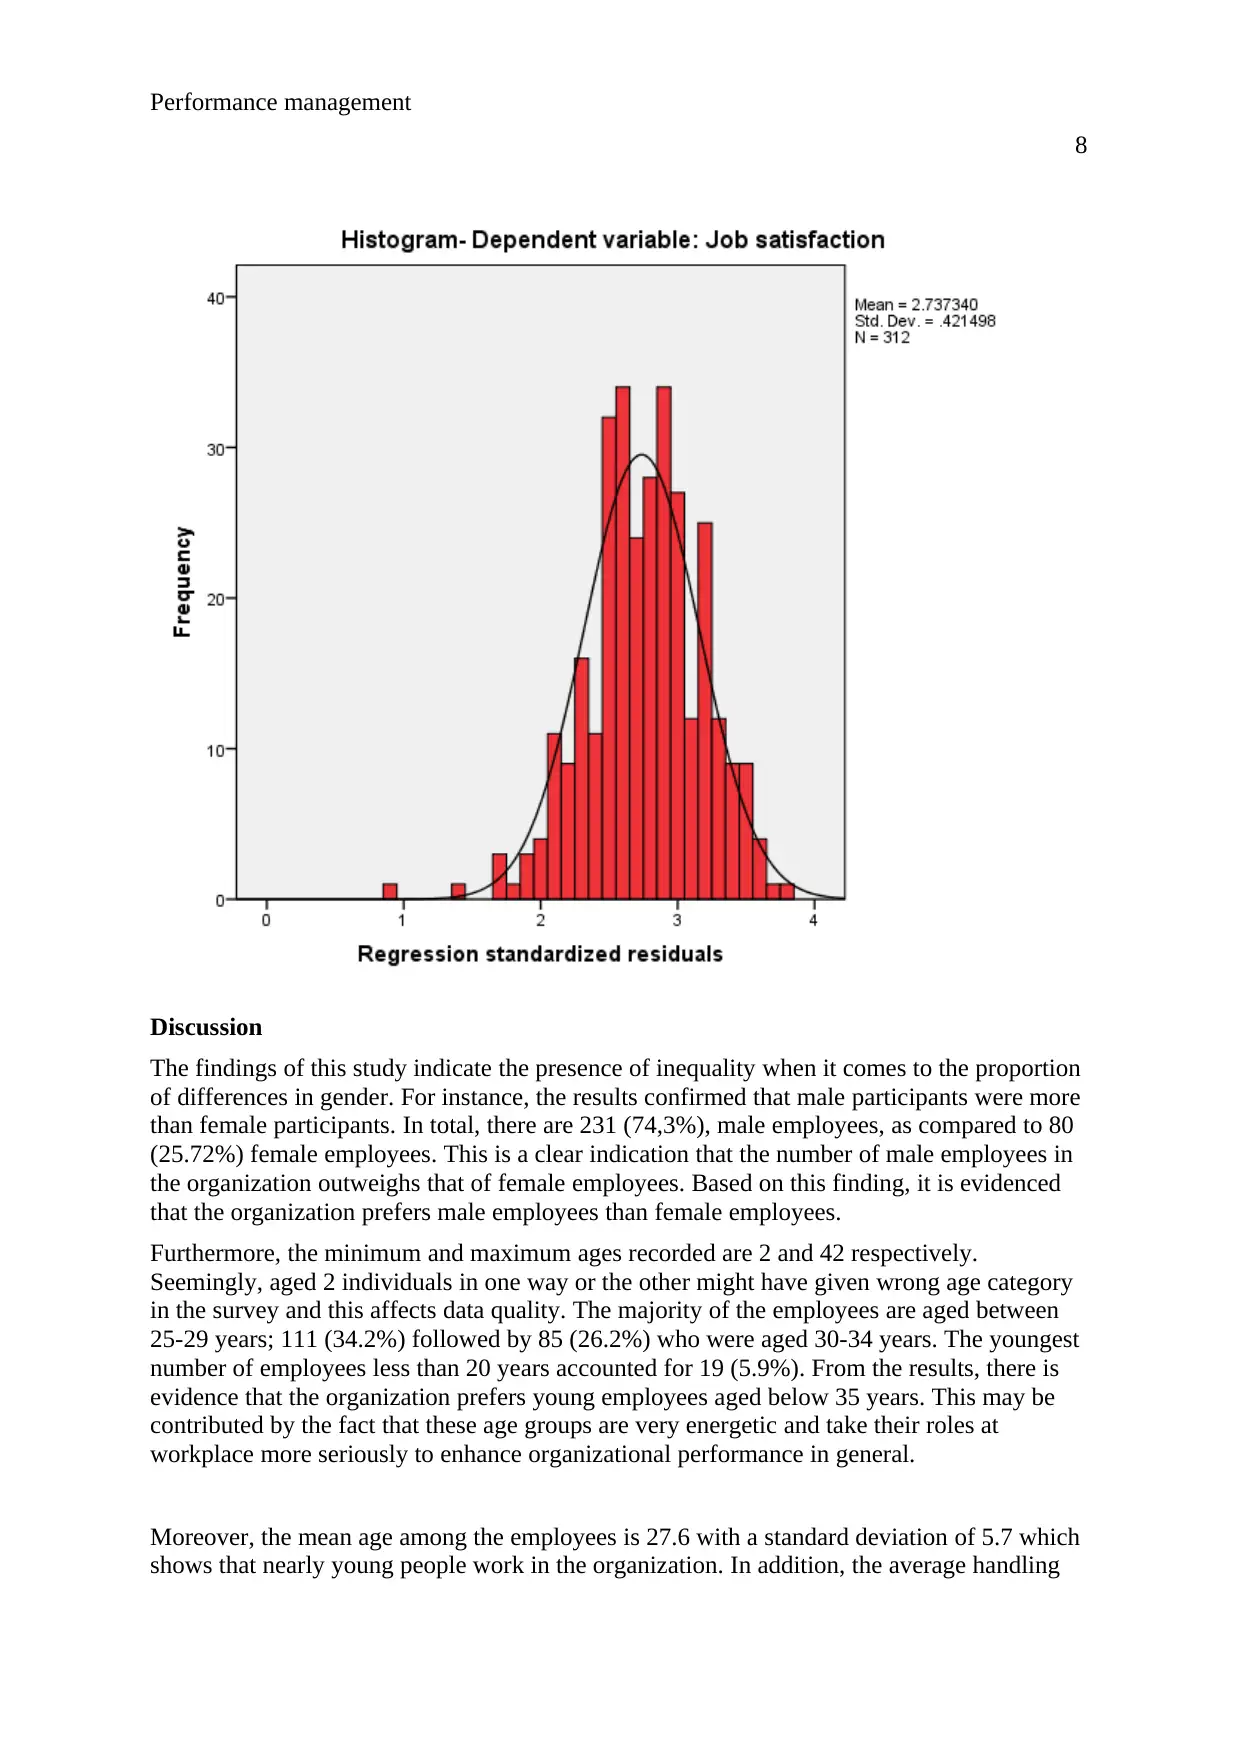
Furthermore, a histogram has been drawn to visualize job satisfaction. By the look of the
histogram, there is a normal distribution curve, and this confirms that the data has passed the
test of normality since it is not skewed.
From the ANOVA table, the output investigates the relationship between job satisfaction and
other variables of interest. In this case, the prediction model used for the regression is
𝑦 ̂ = 𝑏0 + 𝑏1𝑥
where the regress and (y) is the job satisfaction and the regressor x is the variables of interest.
𝑦 ̂ is the predicted job satisfaction. To note, job satisfaction has been chosen to be the regress
and because it is the variable to be predicted in the research interest above. Therefore, job
satisfaction in this research refers to the regressor because it is the variable that will be used
to predict the regression and can change over time.
From the results, the r2 of the regression is 0.2631, which means that about 26% of the
variance in job satisfaction in the dataset and this can be explained by the variations of Age,
Gender, Tenure, Average handling time for calls, Stress, Supervisor Support, Distributional
justice, Procedural justice, and Team.
Normally, the coefficient associated with job satisfaction is the slope (b1) is and it takes the
value 1.695. The implication is that an additional 2 average handling time for calls per person
is expected to be witnessed in average calls among employees for each additional job
dissatisfaction witnessed in the organization. The intercept (b0) takes value 1.33. It reflects
the fixed average handling time for calls of 133.
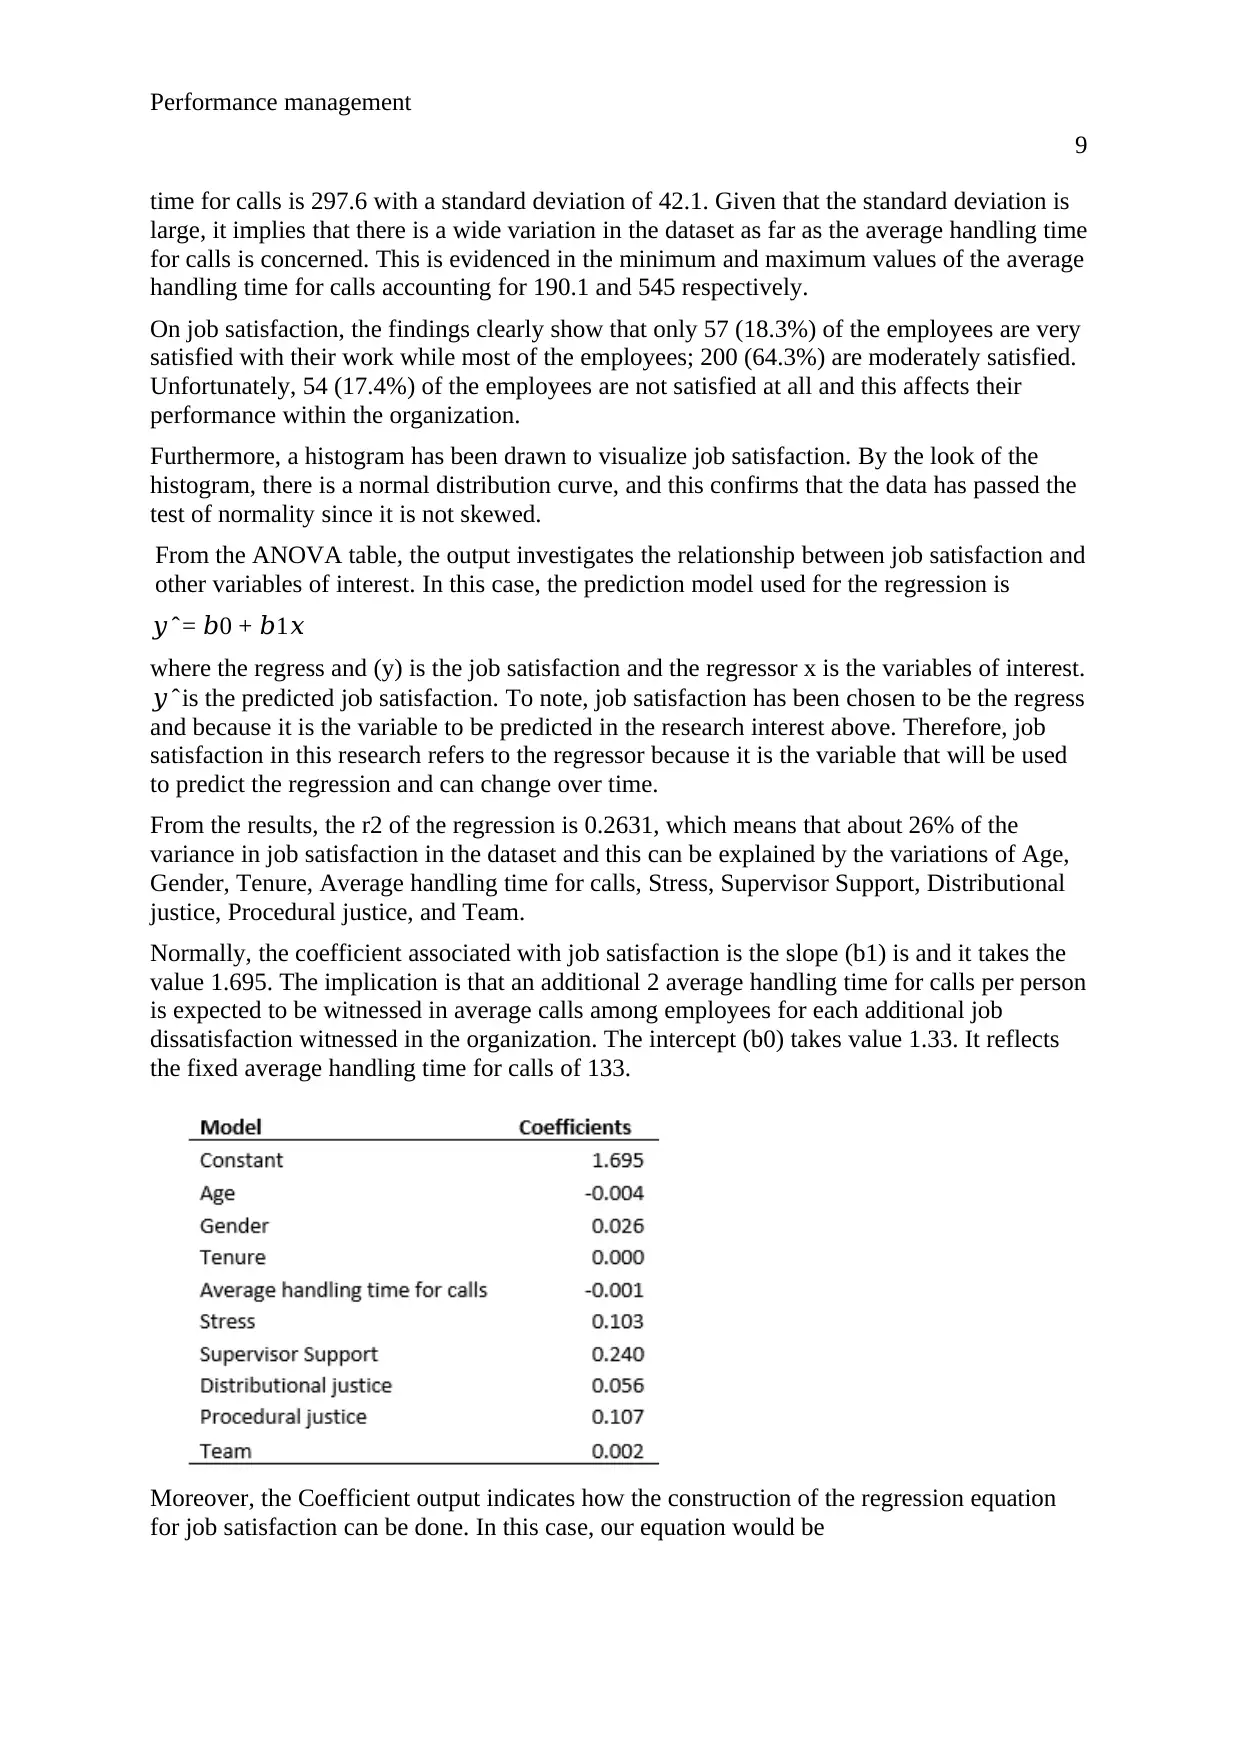
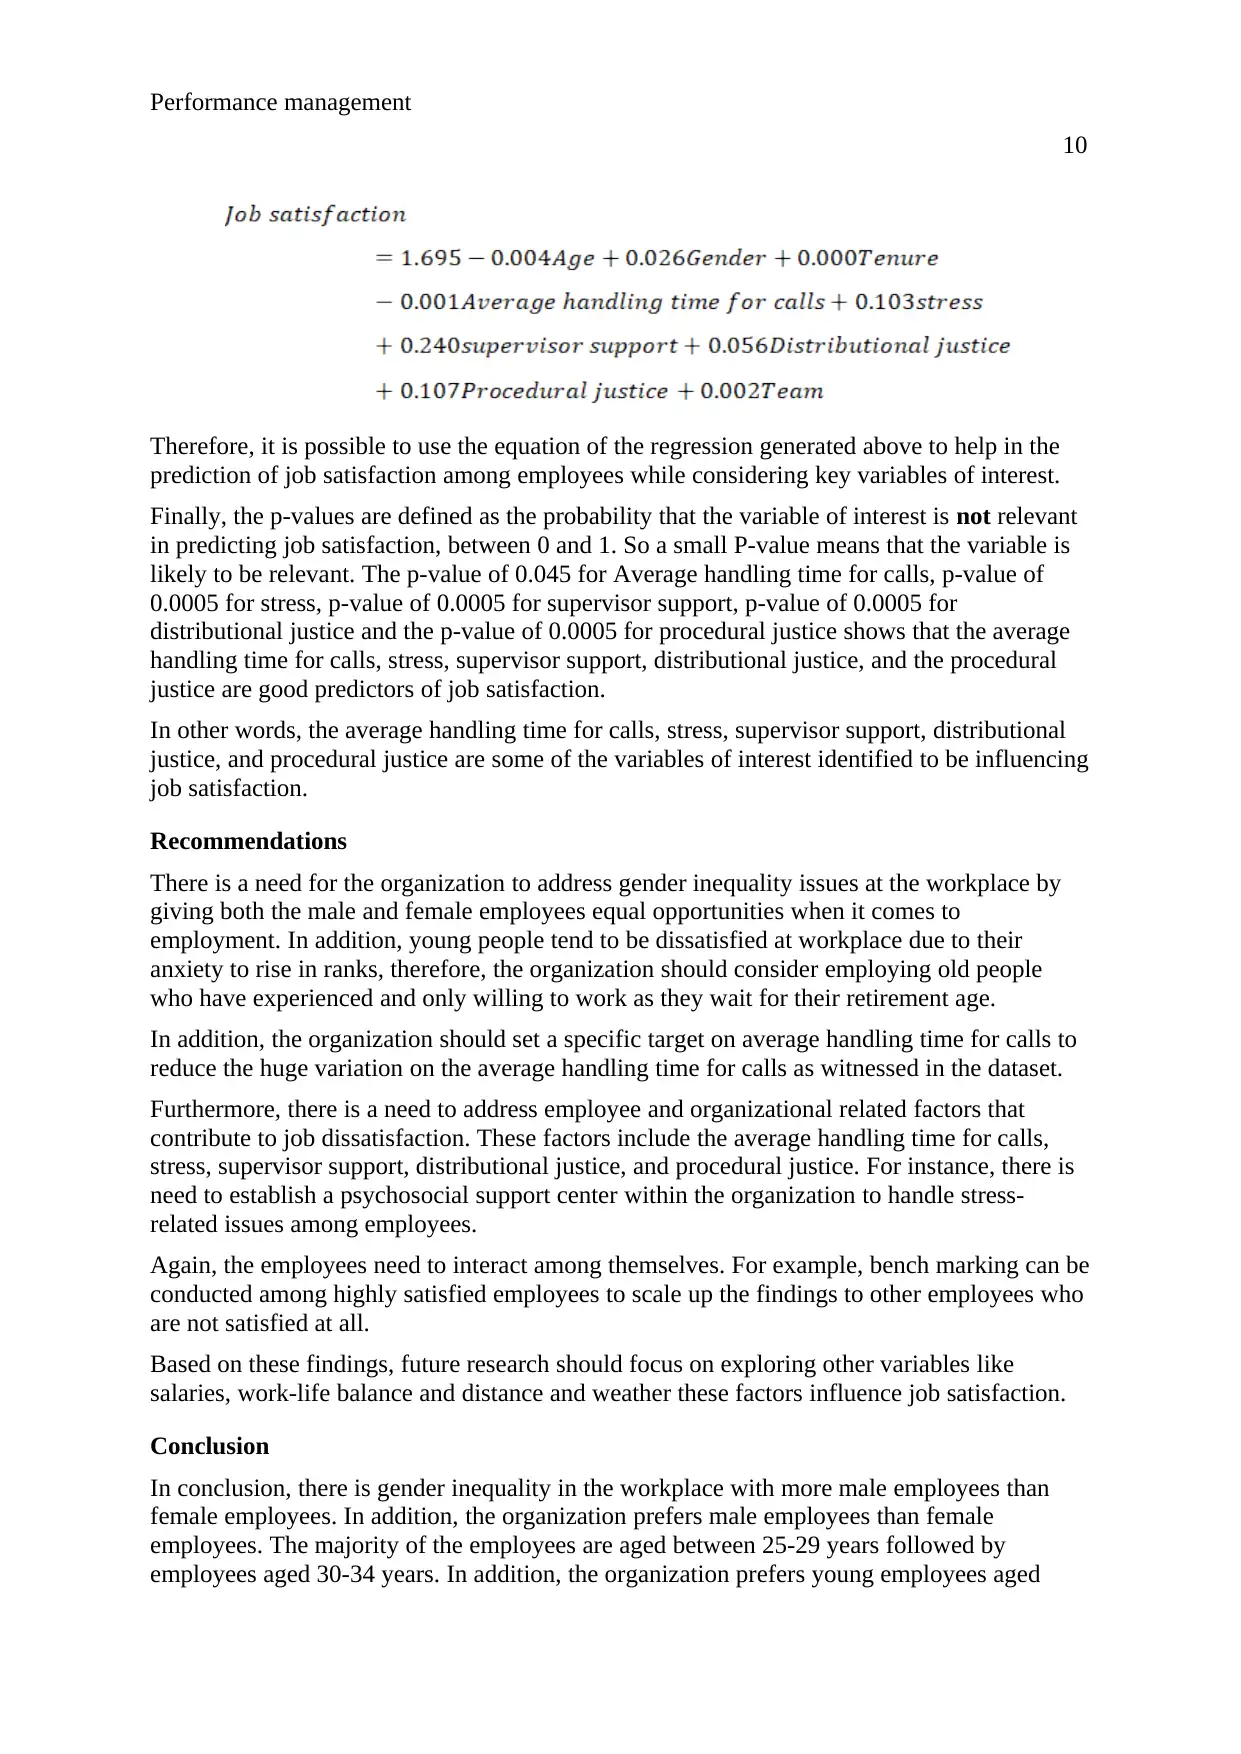
Moreover, the Coefficient output indicates how the construction of the regression equation
for job satisfaction can be done. In this case, our equation would be
9
time for calls is 297.6 with a standard deviation of 42.1. Given that the standard deviation is
large, it implies that there is a wide variation in the dataset as far as the average handling time
for calls is concerned. This is evidenced in the minimum and maximum values of the average
handling time for calls accounting for 190.1 and 545 respectively.
On job satisfaction, the findings clearly show that only 57 (18.3%) of the employees are very
satisfied with their work while most of the employees; 200 (64.3%) are moderately satisfied.
Unfortunately, 54 (17.4%) of the employees are not satisfied at all and this affects their
performance within the organization.
Furthermore, a histogram has been drawn to visualize job satisfaction. By the look of the
histogram, there is a normal distribution curve, and this confirms that the data has passed the
test of normality since it is not skewed.
From the ANOVA table, the output investigates the relationship between job satisfaction and
other variables of interest. In this case, the prediction model used for the regression is
𝑦 ̂ = 𝑏0 + 𝑏1𝑥
where the regress and (y) is the job satisfaction and the regressor x is the variables of interest.
𝑦 ̂ is the predicted job satisfaction. To note, job satisfaction has been chosen to be the regress
and because it is the variable to be predicted in the research interest above. Therefore, job
satisfaction in this research refers to the regressor because it is the variable that will be used
to predict the regression and can change over time.
From the results, the r2 of the regression is 0.2631, which means that about 26% of the
variance in job satisfaction in the dataset and this can be explained by the variations of Age,
Gender, Tenure, Average handling time for calls, Stress, Supervisor Support, Distributional
justice, Procedural justice, and Team.
Normally, the coefficient associated with job satisfaction is the slope (b1) is and it takes the
value 1.695. The implication is that an additional 2 average handling time for calls per person
is expected to be witnessed in average calls among employees for each additional job
dissatisfaction witnessed in the organization. The intercept (b0) takes value 1.33. It reflects
the fixed average handling time for calls of 133.
Moreover, the Coefficient output indicates how the construction of the regression equation
for job satisfaction can be done. In this case, our equation would be
⊘ This is a preview!⊘
Do you want full access?
Subscribe today to unlock all pages.
Trusted by 1+ million students worldwide
Performance management
10
Therefore, it is possible to use the equation of the regression generated above to help in the
prediction of job satisfaction among employees while considering key variables of interest.
Finally, the p-values are defined as the probability that the variable of interest is not relevant
in predicting job satisfaction, between 0 and 1. So a small P-value means that the variable is
likely to be relevant. The p-value of 0.045 for Average handling time for calls, p-value of
0.0005 for stress, p-value of 0.0005 for supervisor support, p-value of 0.0005 for
distributional justice and the p-value of 0.0005 for procedural justice shows that the average
handling time for calls, stress, supervisor support, distributional justice, and the procedural
justice are good predictors of job satisfaction.
In other words, the average handling time for calls, stress, supervisor support, distributional
justice, and procedural justice are some of the variables of interest identified to be influencing
job satisfaction.
Recommendations
There is a need for the organization to address gender inequality issues at the workplace by
giving both the male and female employees equal opportunities when it comes to
employment. In addition, young people tend to be dissatisfied at workplace due to their
anxiety to rise in ranks, therefore, the organization should consider employing old people
who have experienced and only willing to work as they wait for their retirement age.
In addition, the organization should set a specific target on average handling time for calls to
reduce the huge variation on the average handling time for calls as witnessed in the dataset.
Furthermore, there is a need to address employee and organizational related factors that
contribute to job dissatisfaction. These factors include the average handling time for calls,
stress, supervisor support, distributional justice, and procedural justice. For instance, there is
need to establish a psychosocial support center within the organization to handle stress-
related issues among employees.
Again, the employees need to interact among themselves. For example, bench marking can be
conducted among highly satisfied employees to scale up the findings to other employees who
are not satisfied at all.
Based on these findings, future research should focus on exploring other variables like
salaries, work-life balance and distance and weather these factors influence job satisfaction.
Conclusion
In conclusion, there is gender inequality in the workplace with more male employees than
female employees. In addition, the organization prefers male employees than female
employees. The majority of the employees are aged between 25-29 years followed by
employees aged 30-34 years. In addition, the organization prefers young employees aged
Paraphrase This Document
Need a fresh take? Get an instant paraphrase of this document with our AI Paraphraser
Performance management
11
below 35 years unlike to old generations. This may be contributed by the fact that these age
groups are very energetic and take their roles at workplace more seriously to enhance
organizational performance in general.
Furthermore, there is a wide variation in the dataset as far as the average handling time for
calls is concerned. This is evidenced in the minimum and maximum values of the average
handling time for calls accounting for 190.1 and 545 respectively.
Only, 18% of the employees are very satisfied with their work while most of the employees
64% of the employees are moderately satisfied. Unfortunately, only 17% of the employees
are not satisfied at all and this affects their performance within the organization.
Furthermore, there is a normal distribution curve, and this confirms that the data has passed
the test of normality since it is not skewed. Additionally, findings have confirmed that there
is a relationship between job satisfaction and other variables of interest; the average handling
time for calls, stress, supervisor support, distributional justice, and procedural justice.
Moreover, the results indicate a 26% of the variance in job satisfaction in the dataset and this
can be explained by the variations of Age, Gender, Tenure, Average handling time for calls,
Stress, Supervisor Support, Distributional justice, Procedural justice, and Team.
Again, there is an additional of 2 average handling time for calls per person expected to be
witnessed in average calls among employees for each additional job dissatisfaction occurring
in the organization.
Performance management
12
References
Ary, D., Jacobs, L.C., Irvine, C.K.S. and Walker, D., 2018. Introduction to research in
education. Cengage Learning.
Cooper, H., Hedges, L.V. and Valentine, J.C. eds., 2019. The handbook of research synthesis
and meta-analysis. Russell Sage Foundation.
DeCenzo, D.A., Robbins, S.P. and Verhulst, S.L., 2016. Fundamentals of Human Resource
Management, Binder Ready Version. John Wiley & Sons.
Drake, B.F., Rancilio, D.M. and Stafford, J.D., 2017. Research methods. In Public Health
Research Methods for Partnerships and Practice (pp. 174-187). Routledge.
Hancock, D.R. and Algozzine, B., 2016. Doing case study research: A practical guide for
beginning researchers. Teachers College Press.
Kumar, R., 2019. Research methodology: A step-by-step guide for beginners. Sage
Publications Limited.
Lazar, J., Feng, J.H. and Hochheiser, H., 2017. Research methods in human-computer
interaction. Morgan Kaufmann.
Lăzăroiu, G., 2015. Employee motivation and job performance. Linguistic and Philosophical
Investigations, (14), pp.97-102.
McCusker, K. and Gunaydin, S., 2015. Research using qualitative, quantitative or mixed
methods and choice based on the research. Perfusion, 30(7), pp.537-542.
Mertler, C.A., 2019. Action research: Improving schools and empowering educators. SAGE
Publications, Incorporated.
Nardi, P.M., 2018. Doing survey research: A guide to quantitative methods. Routledge.
O'Leary, Z. and Hunt, J.S., 2016. Workplace research: Conducting small-scale research in
organizations. Sage.
Opie, C., 2019. Research procedures. Getting Started in Your Educational Research: Design,
Data Production and Analysis, p.159.
Patten, M.L. and Newhart, M., 2017. Understanding research methods: An overview of the
essentials. Routledge.
Platis, C., Reklitis, P. and Zimeras, S., 2015. Relation between job satisfaction and job
performance in healthcare services. Procedia-Social and Behavioral Sciences, 175, pp.480-
487.
Simpson, S.H., 2015. Creating a data analysis plan: What to consider when choosing statistics
for a study. The Canadian Journal of Hospital Pharmacy, 68(4), p.311.
Tillé, Y. and Matei, A., 2016. 21 Basics of Sampling for Survey Research. The SAGE
Handbook of Survey Methodology.
Tyrer, S. and Heyman, B., 2016. Sampling in epidemiological research: issues, hazards and
pitfalls. BJPsych bulletin, 40(2), pp.57-60.
Yin, R.K., 2017. Case study research and applications: Design and methods. Sage
publications.
⊘ This is a preview!⊘
Do you want full access?
Subscribe today to unlock all pages.
Trusted by 1+ million students worldwide
1 out of 13
Related Documents


Your All-in-One AI-Powered Toolkit for Academic Success.
+13062052269
info@desklib.com
Available 24*7 on WhatsApp / Email
![[object Object]](/_next/static/media/star-bottom.7253800d.svg)
Unlock your academic potential
Copyright © 2020–2026 A2Z Services. All Rights Reserved. Developed and managed by ZUCOL.