Applied Ethics and Sustainability: Personal Footprint Analysis Report
VerifiedAdded on 2022/11/26
|12
|2317
|94
Report
AI Summary
This report presents an analysis of an individual's ecological footprint, calculated using the WWF calculator, revealing a consumption rate 3.8 times higher than available resources. The report details the ecological footprint, carbon footprint, and land use, highlighting the impact of lifestyle choices. Major causes of unsustainability are identified, including air travel, personal vehicle use, and eating habits. Solutions are proposed for 'City,' 'Energy,' 'Food,' and 'Population' categories. The report further examines the environmental impact of meat production, focusing on raw materials, energy inputs, and waste disposal, and suggests strategies for waste management and product redesign. The analysis includes stakeholders like consumers, national standards bureaus, and public health departments. It concludes by emphasizing the individual's commitment to reducing meat consumption to decrease their carbon footprint.
Applied Ethics and Sustainability 1
APPLIED ETHICS AND SUSTAINABILITY
By Name
Course
Instructor
Institution
Location
Date
APPLIED ETHICS AND SUSTAINABILITY
By Name
Course
Instructor
Institution
Location
Date
Paraphrase This Document
Need a fresh take? Get an instant paraphrase of this document with our AI Paraphraser
Applied Ethics and Sustainability 2
1
1
Applied Ethics and Sustainability 3
⊘ This is a preview!⊘
Do you want full access?
Subscribe today to unlock all pages.
Trusted by 1+ million students worldwide
Applied Ethics and Sustainability 4
2
a
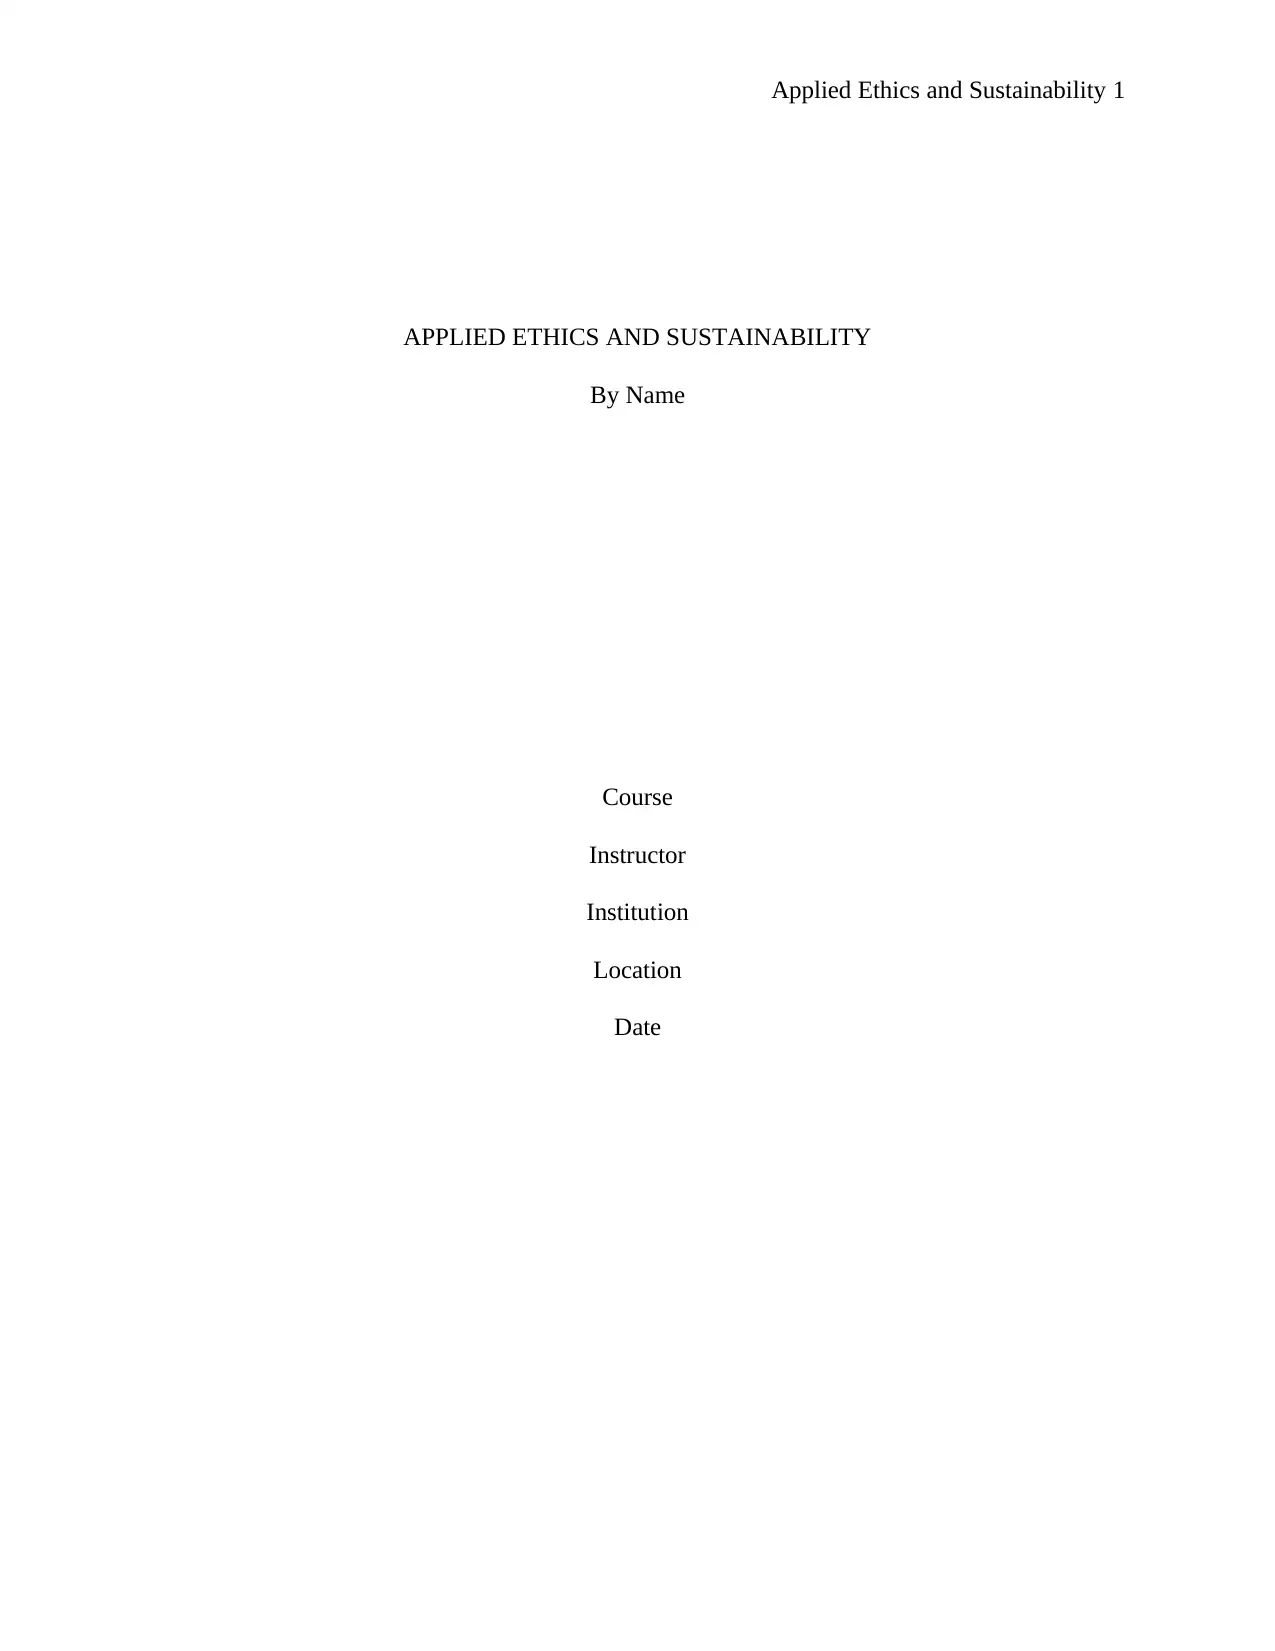
The ecological footprint is an indicator of how much of the earth’s resources I consume in
comparison to the available amount of resources. It puts into consideration of different aspects of
my way of life. My ecological footprint outlines that if everyone else lived the way I do, then we
would require 3.8 earths in order to efficiently accommodate us. This implies that level with
which I use different resources and energy is 3.8 times higher than what is actually available
(Bagliani et al, 2014). After considering all the factors of land and consumption, my ecological
footprint is estimated at 6.6 gha. My total carbon footprint is at a whopping 60%. My total
carbon footprint representing the amount of CO2 emissions to the environment is 11.5 tons per
year. This implies that most of my consumption either through food, travelling , services,
mobility, shelter, total land etc. have got relatively high rates of carbon emissions.
B
Close to 50 gigatonnes of CO2 is produced within the atmosphere and the terrestrial system. The
production is largely influenced by various human activities that are also associated to the
forests. Carbon sequestration involves the process where atmospheric carbon dioxide is absorbed
by trees and other plants and is subsequently stored in the form of carbon in biomass. A tree or
plant is able to absorb up to 48 pounds of CO2 as well as sequester up to 1 ton of CO2 by the
time it attains 40 years. An average human being is also able to emit up to 2.3 pounds of CO2 on
a daily basis. The level may vary depending on the level of activity for each individual. From my
carbon footprint, I emit up to 11.5 tons of CO2 each year (Folke et al, 2015). This implies that
my carbon footprint is higher than the estimated average carbon footprint for humans. The high
2
a
The ecological footprint is an indicator of how much of the earth’s resources I consume in
comparison to the available amount of resources. It puts into consideration of different aspects of
my way of life. My ecological footprint outlines that if everyone else lived the way I do, then we
would require 3.8 earths in order to efficiently accommodate us. This implies that level with
which I use different resources and energy is 3.8 times higher than what is actually available
(Bagliani et al, 2014). After considering all the factors of land and consumption, my ecological
footprint is estimated at 6.6 gha. My total carbon footprint is at a whopping 60%. My total
carbon footprint representing the amount of CO2 emissions to the environment is 11.5 tons per
year. This implies that most of my consumption either through food, travelling , services,
mobility, shelter, total land etc. have got relatively high rates of carbon emissions.
B
Close to 50 gigatonnes of CO2 is produced within the atmosphere and the terrestrial system. The
production is largely influenced by various human activities that are also associated to the
forests. Carbon sequestration involves the process where atmospheric carbon dioxide is absorbed
by trees and other plants and is subsequently stored in the form of carbon in biomass. A tree or
plant is able to absorb up to 48 pounds of CO2 as well as sequester up to 1 ton of CO2 by the
time it attains 40 years. An average human being is also able to emit up to 2.3 pounds of CO2 on
a daily basis. The level may vary depending on the level of activity for each individual. From my
carbon footprint, I emit up to 11.5 tons of CO2 each year (Folke et al, 2015). This implies that
my carbon footprint is higher than the estimated average carbon footprint for humans. The high
Paraphrase This Document
Need a fresh take? Get an instant paraphrase of this document with our AI Paraphraser
Applied Ethics and Sustainability 5
rate is influenced by the unhealthy living standards that I am seemingly involved in on a daily
basis.
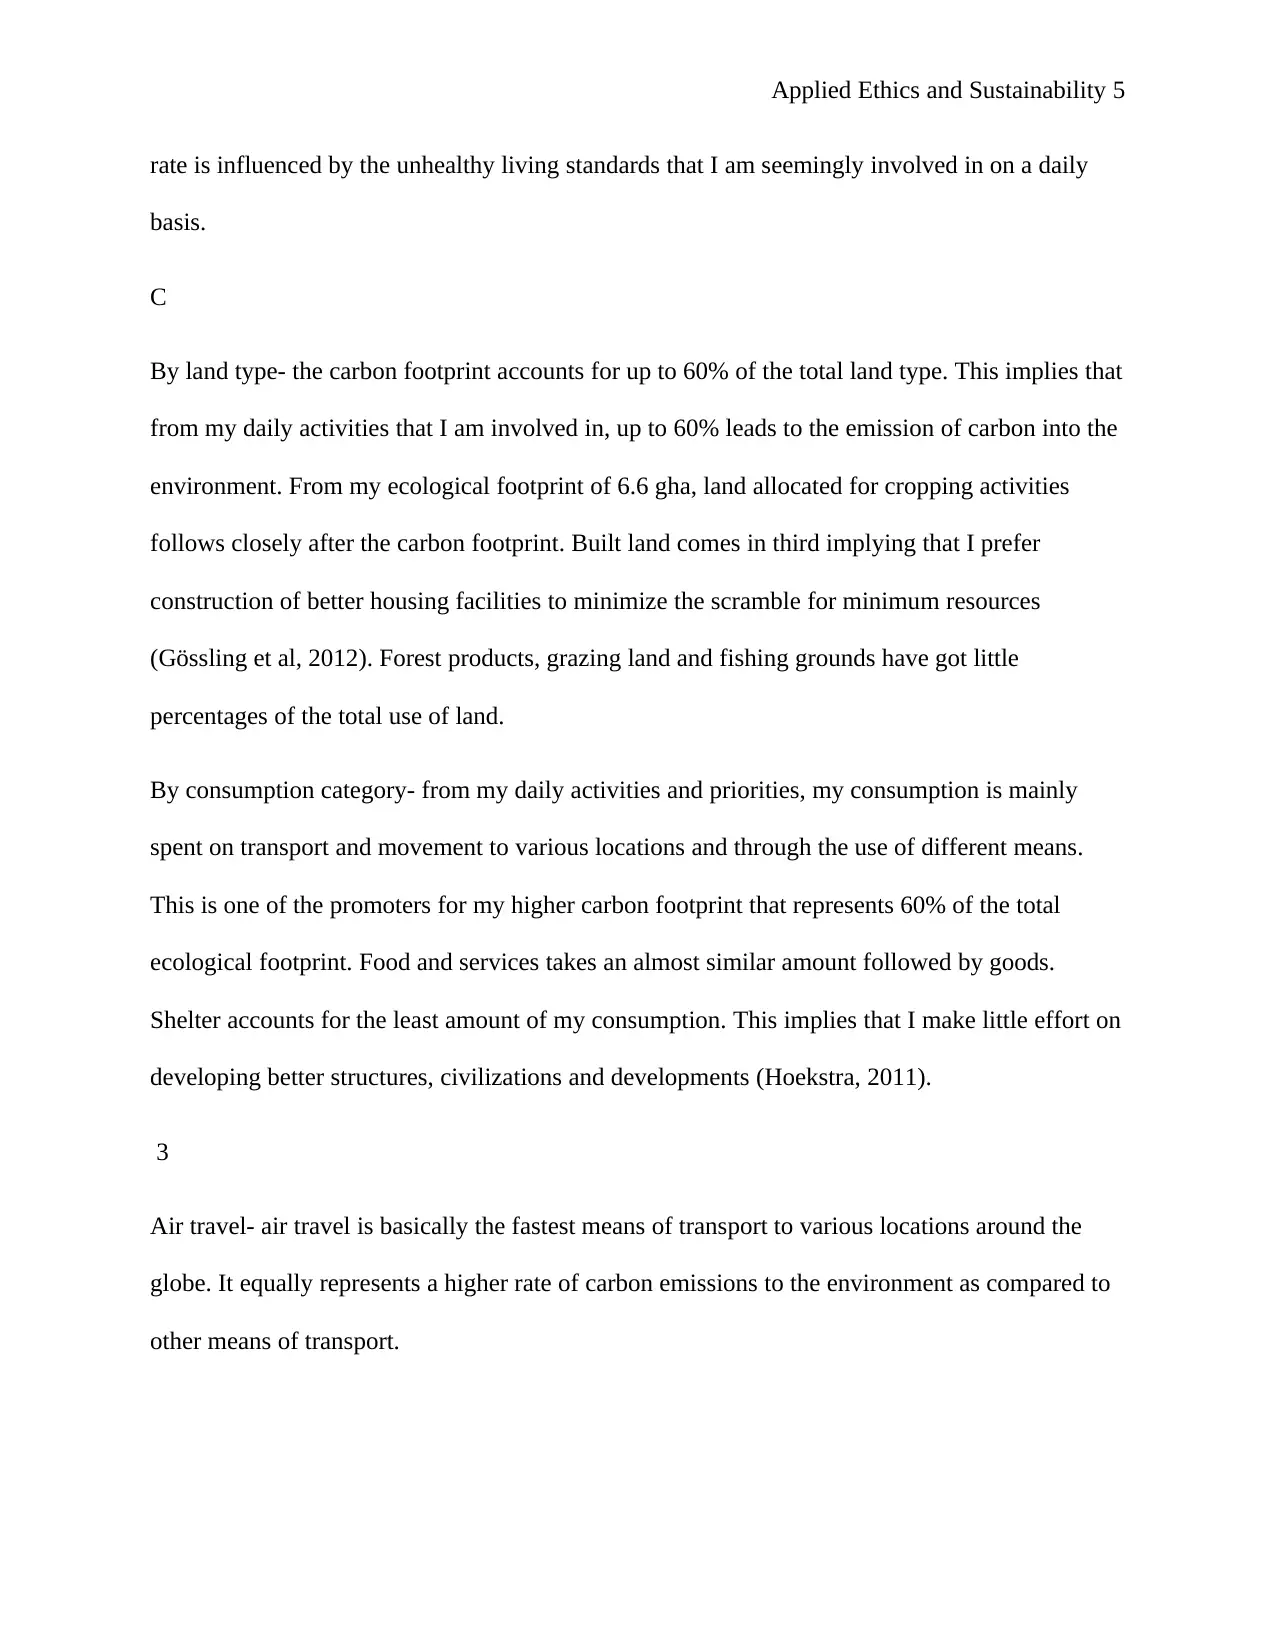
C
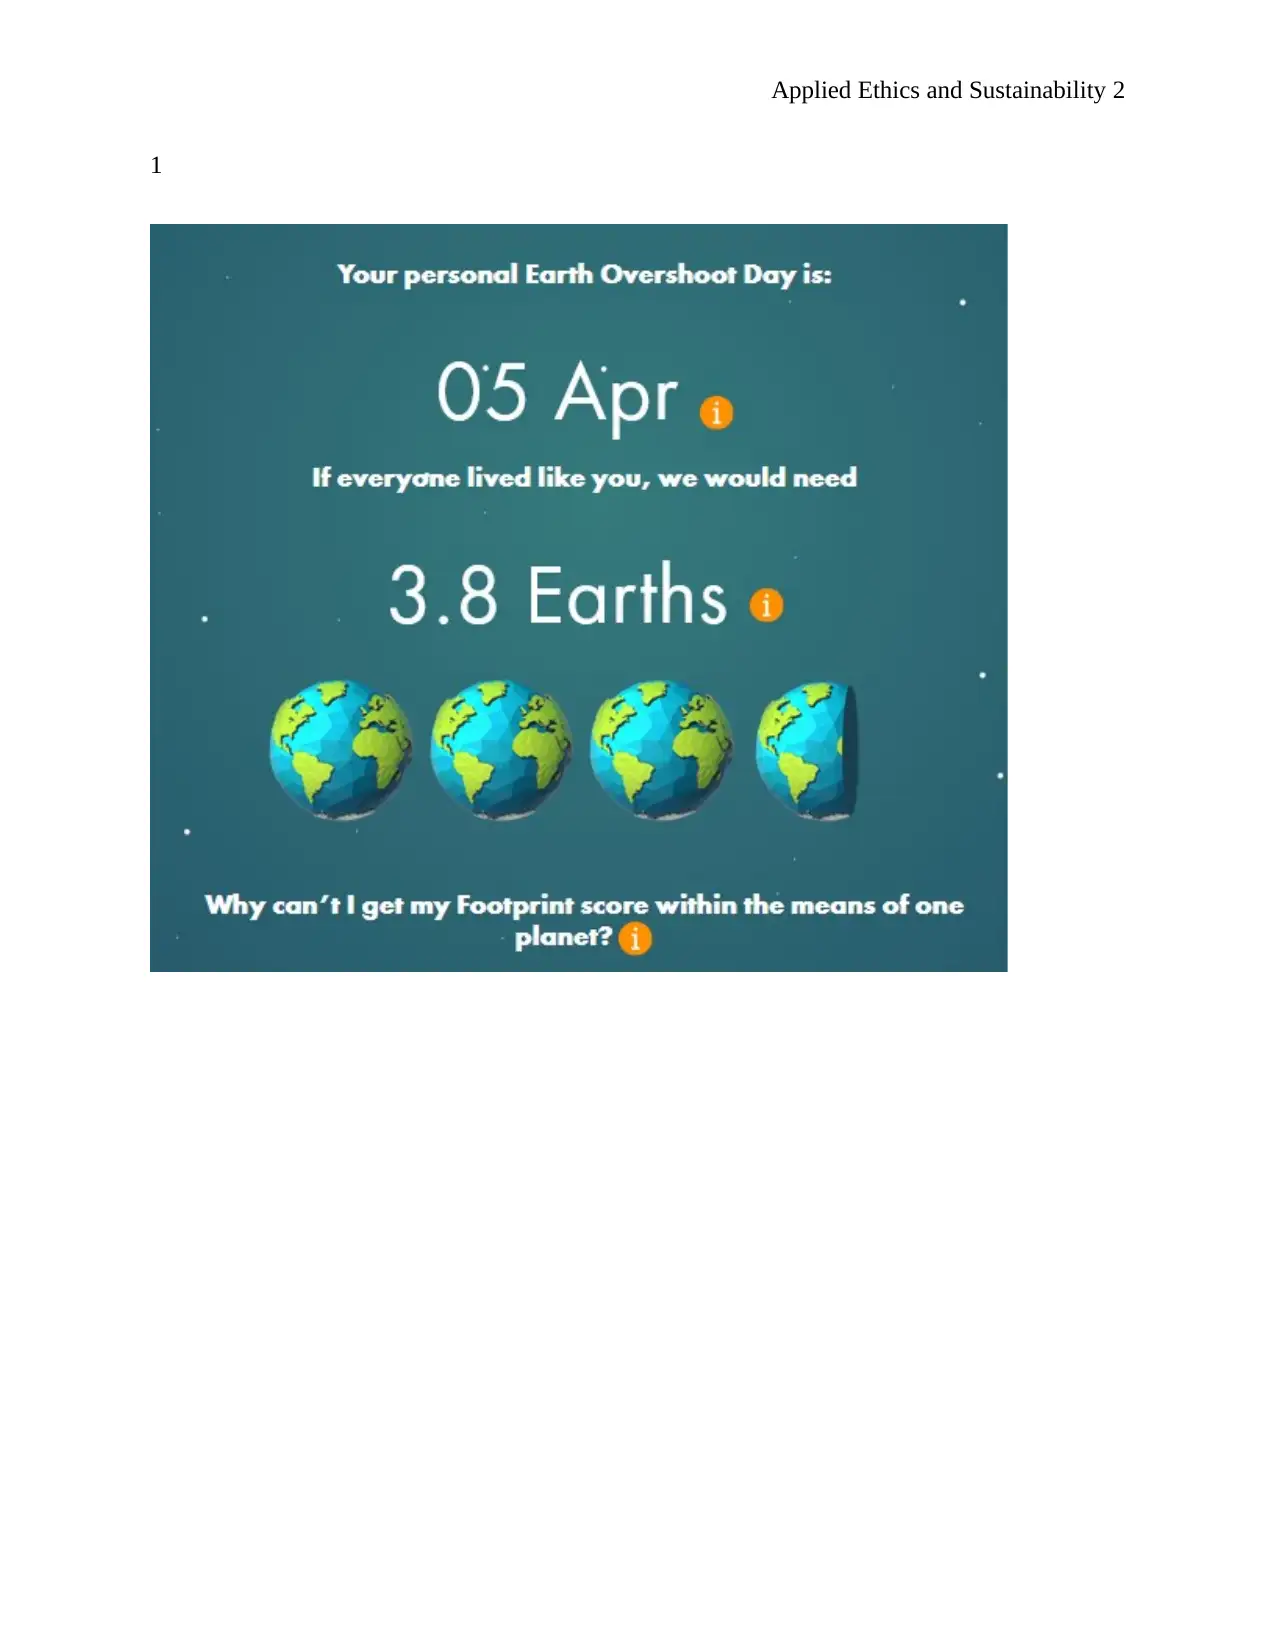
By land type- the carbon footprint accounts for up to 60% of the total land type. This implies that
from my daily activities that I am involved in, up to 60% leads to the emission of carbon into the
environment. From my ecological footprint of 6.6 gha, land allocated for cropping activities
follows closely after the carbon footprint. Built land comes in third implying that I prefer
construction of better housing facilities to minimize the scramble for minimum resources
(Gössling et al, 2012). Forest products, grazing land and fishing grounds have got little
percentages of the total use of land.
By consumption category- from my daily activities and priorities, my consumption is mainly
spent on transport and movement to various locations and through the use of different means.
This is one of the promoters for my higher carbon footprint that represents 60% of the total
ecological footprint. Food and services takes an almost similar amount followed by goods.
Shelter accounts for the least amount of my consumption. This implies that I make little effort on
developing better structures, civilizations and developments (Hoekstra, 2011).
3
Air travel- air travel is basically the fastest means of transport to various locations around the
globe. It equally represents a higher rate of carbon emissions to the environment as compared to
other means of transport.
rate is influenced by the unhealthy living standards that I am seemingly involved in on a daily
basis.
C
By land type- the carbon footprint accounts for up to 60% of the total land type. This implies that
from my daily activities that I am involved in, up to 60% leads to the emission of carbon into the
environment. From my ecological footprint of 6.6 gha, land allocated for cropping activities
follows closely after the carbon footprint. Built land comes in third implying that I prefer
construction of better housing facilities to minimize the scramble for minimum resources
(Gössling et al, 2012). Forest products, grazing land and fishing grounds have got little
percentages of the total use of land.
By consumption category- from my daily activities and priorities, my consumption is mainly
spent on transport and movement to various locations and through the use of different means.
This is one of the promoters for my higher carbon footprint that represents 60% of the total
ecological footprint. Food and services takes an almost similar amount followed by goods.
Shelter accounts for the least amount of my consumption. This implies that I make little effort on
developing better structures, civilizations and developments (Hoekstra, 2011).
3
Air travel- air travel is basically the fastest means of transport to various locations around the
globe. It equally represents a higher rate of carbon emissions to the environment as compared to
other means of transport.
Applied Ethics and Sustainability 6
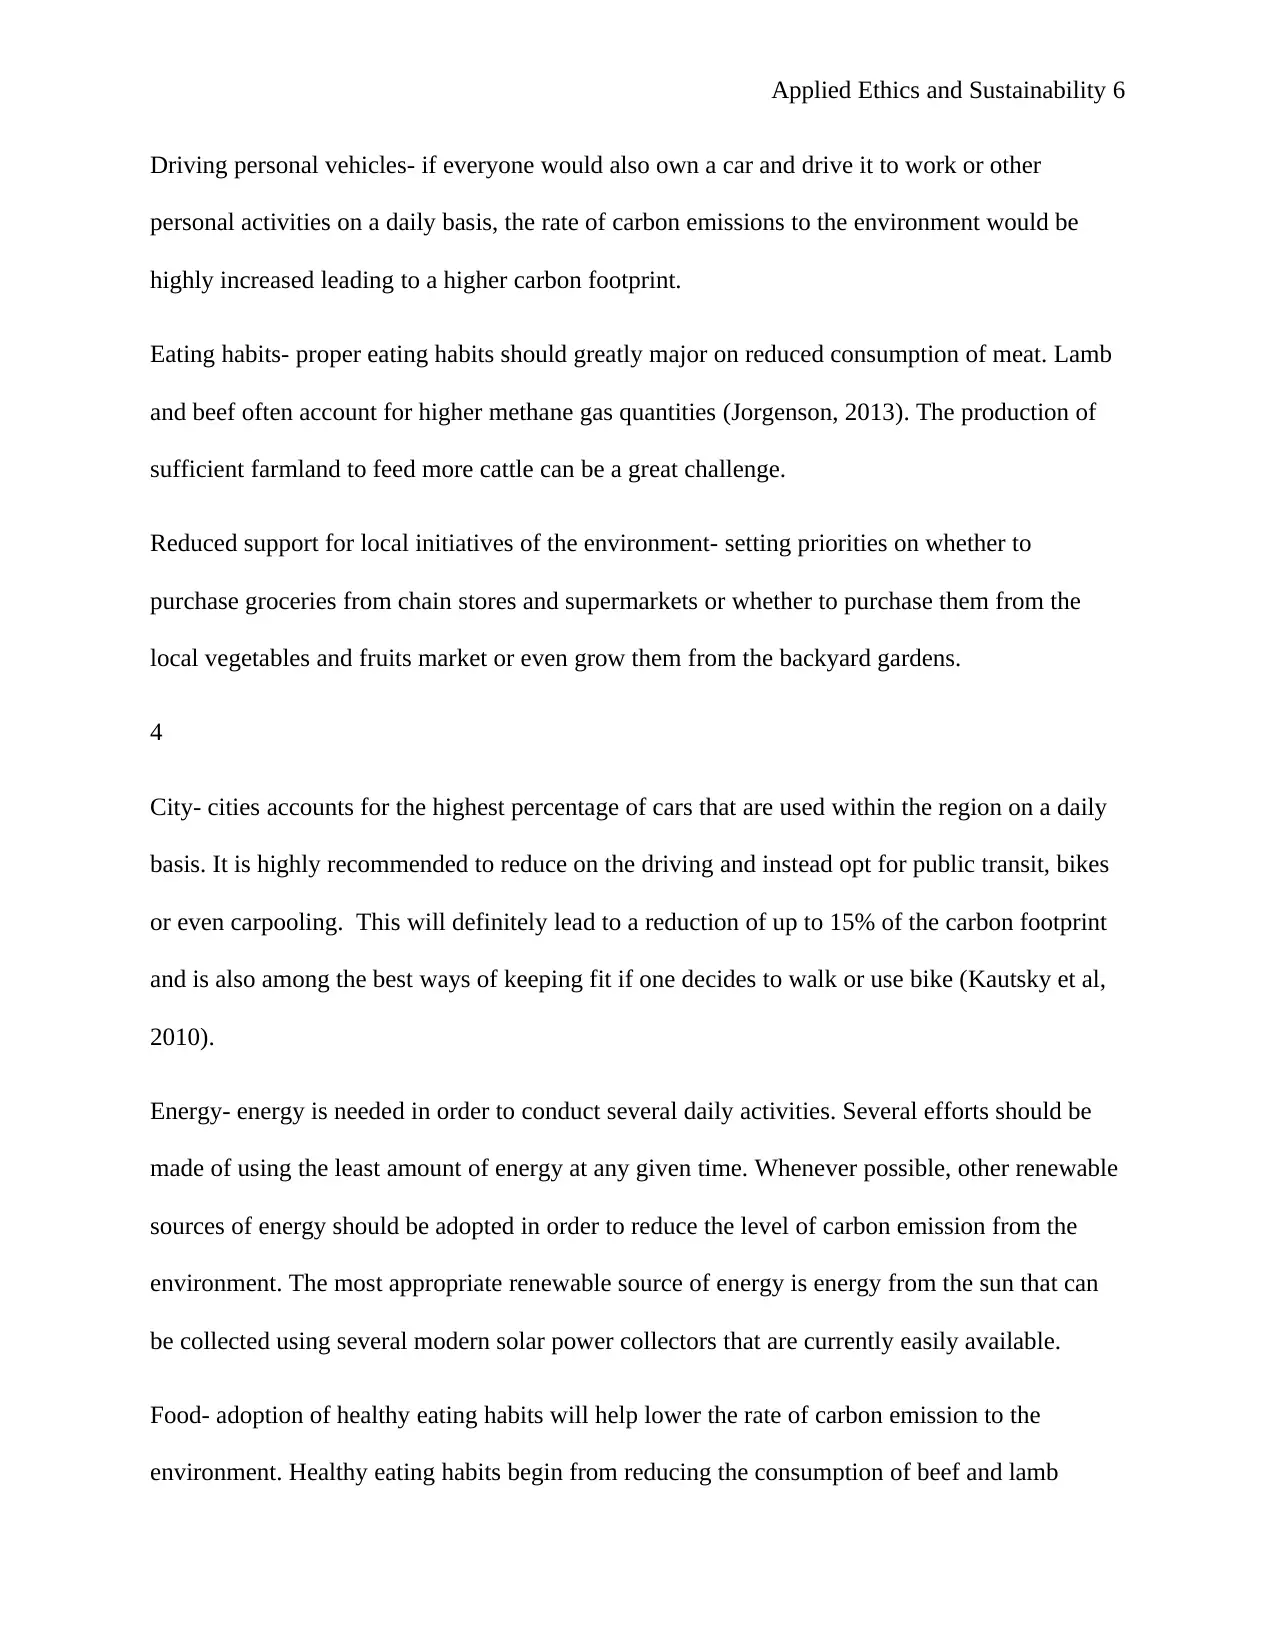
Driving personal vehicles- if everyone would also own a car and drive it to work or other
personal activities on a daily basis, the rate of carbon emissions to the environment would be
highly increased leading to a higher carbon footprint.
Eating habits- proper eating habits should greatly major on reduced consumption of meat. Lamb
and beef often account for higher methane gas quantities (Jorgenson, 2013). The production of
sufficient farmland to feed more cattle can be a great challenge.
Reduced support for local initiatives of the environment- setting priorities on whether to
purchase groceries from chain stores and supermarkets or whether to purchase them from the
local vegetables and fruits market or even grow them from the backyard gardens.
4
City- cities accounts for the highest percentage of cars that are used within the region on a daily
basis. It is highly recommended to reduce on the driving and instead opt for public transit, bikes
or even carpooling. This will definitely lead to a reduction of up to 15% of the carbon footprint
and is also among the best ways of keeping fit if one decides to walk or use bike (Kautsky et al,
2010).
Energy- energy is needed in order to conduct several daily activities. Several efforts should be
made of using the least amount of energy at any given time. Whenever possible, other renewable
sources of energy should be adopted in order to reduce the level of carbon emission from the
environment. The most appropriate renewable source of energy is energy from the sun that can
be collected using several modern solar power collectors that are currently easily available.
Food- adoption of healthy eating habits will help lower the rate of carbon emission to the
environment. Healthy eating habits begin from reducing the consumption of beef and lamb
⊘ This is a preview!⊘
Do you want full access?
Subscribe today to unlock all pages.
Trusted by 1+ million students worldwide
Applied Ethics and Sustainability 7
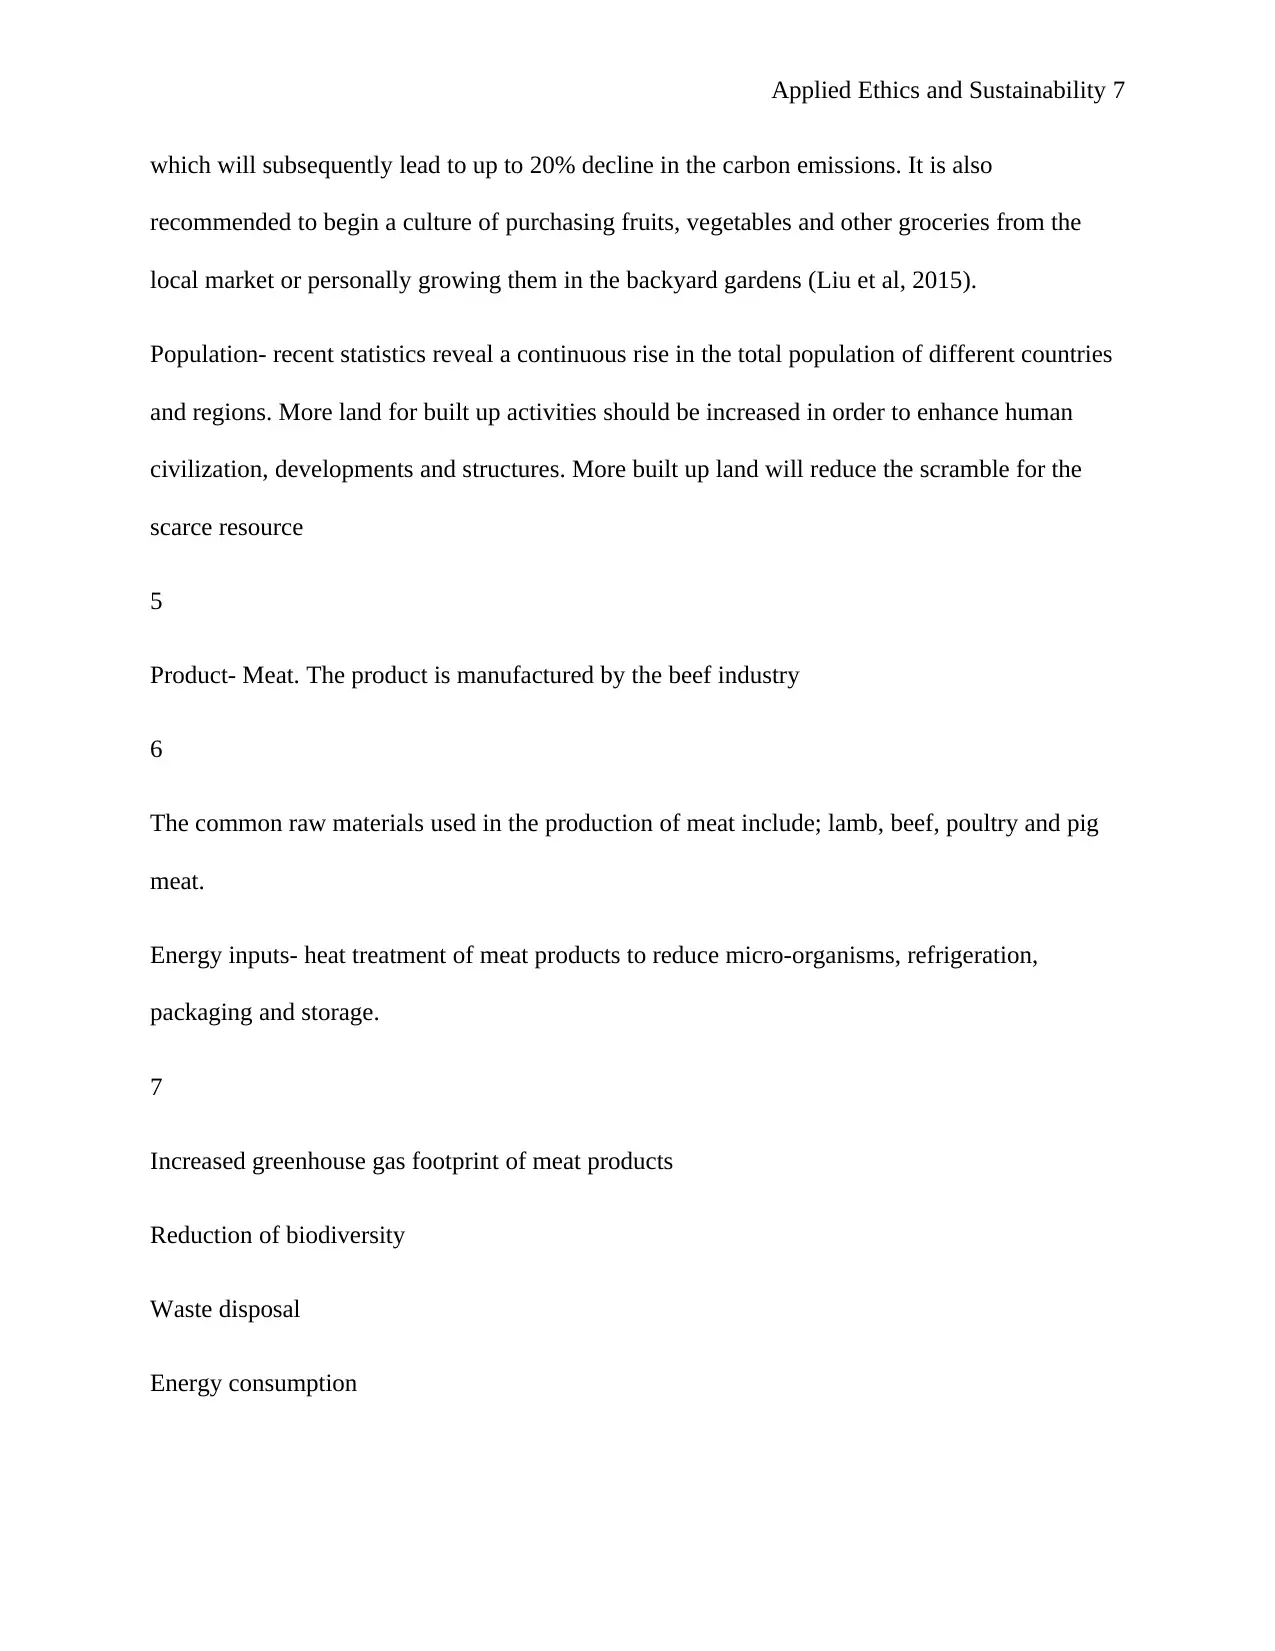
which will subsequently lead to up to 20% decline in the carbon emissions. It is also
recommended to begin a culture of purchasing fruits, vegetables and other groceries from the
local market or personally growing them in the backyard gardens (Liu et al, 2015).
Population- recent statistics reveal a continuous rise in the total population of different countries
and regions. More land for built up activities should be increased in order to enhance human
civilization, developments and structures. More built up land will reduce the scramble for the
scarce resource
5
Product- Meat. The product is manufactured by the beef industry
6
The common raw materials used in the production of meat include; lamb, beef, poultry and pig
meat.
Energy inputs- heat treatment of meat products to reduce micro-organisms, refrigeration,
packaging and storage.
7
Increased greenhouse gas footprint of meat products
Reduction of biodiversity
Waste disposal
Energy consumption
Paraphrase This Document
Need a fresh take? Get an instant paraphrase of this document with our AI Paraphraser
Applied Ethics and Sustainability 8
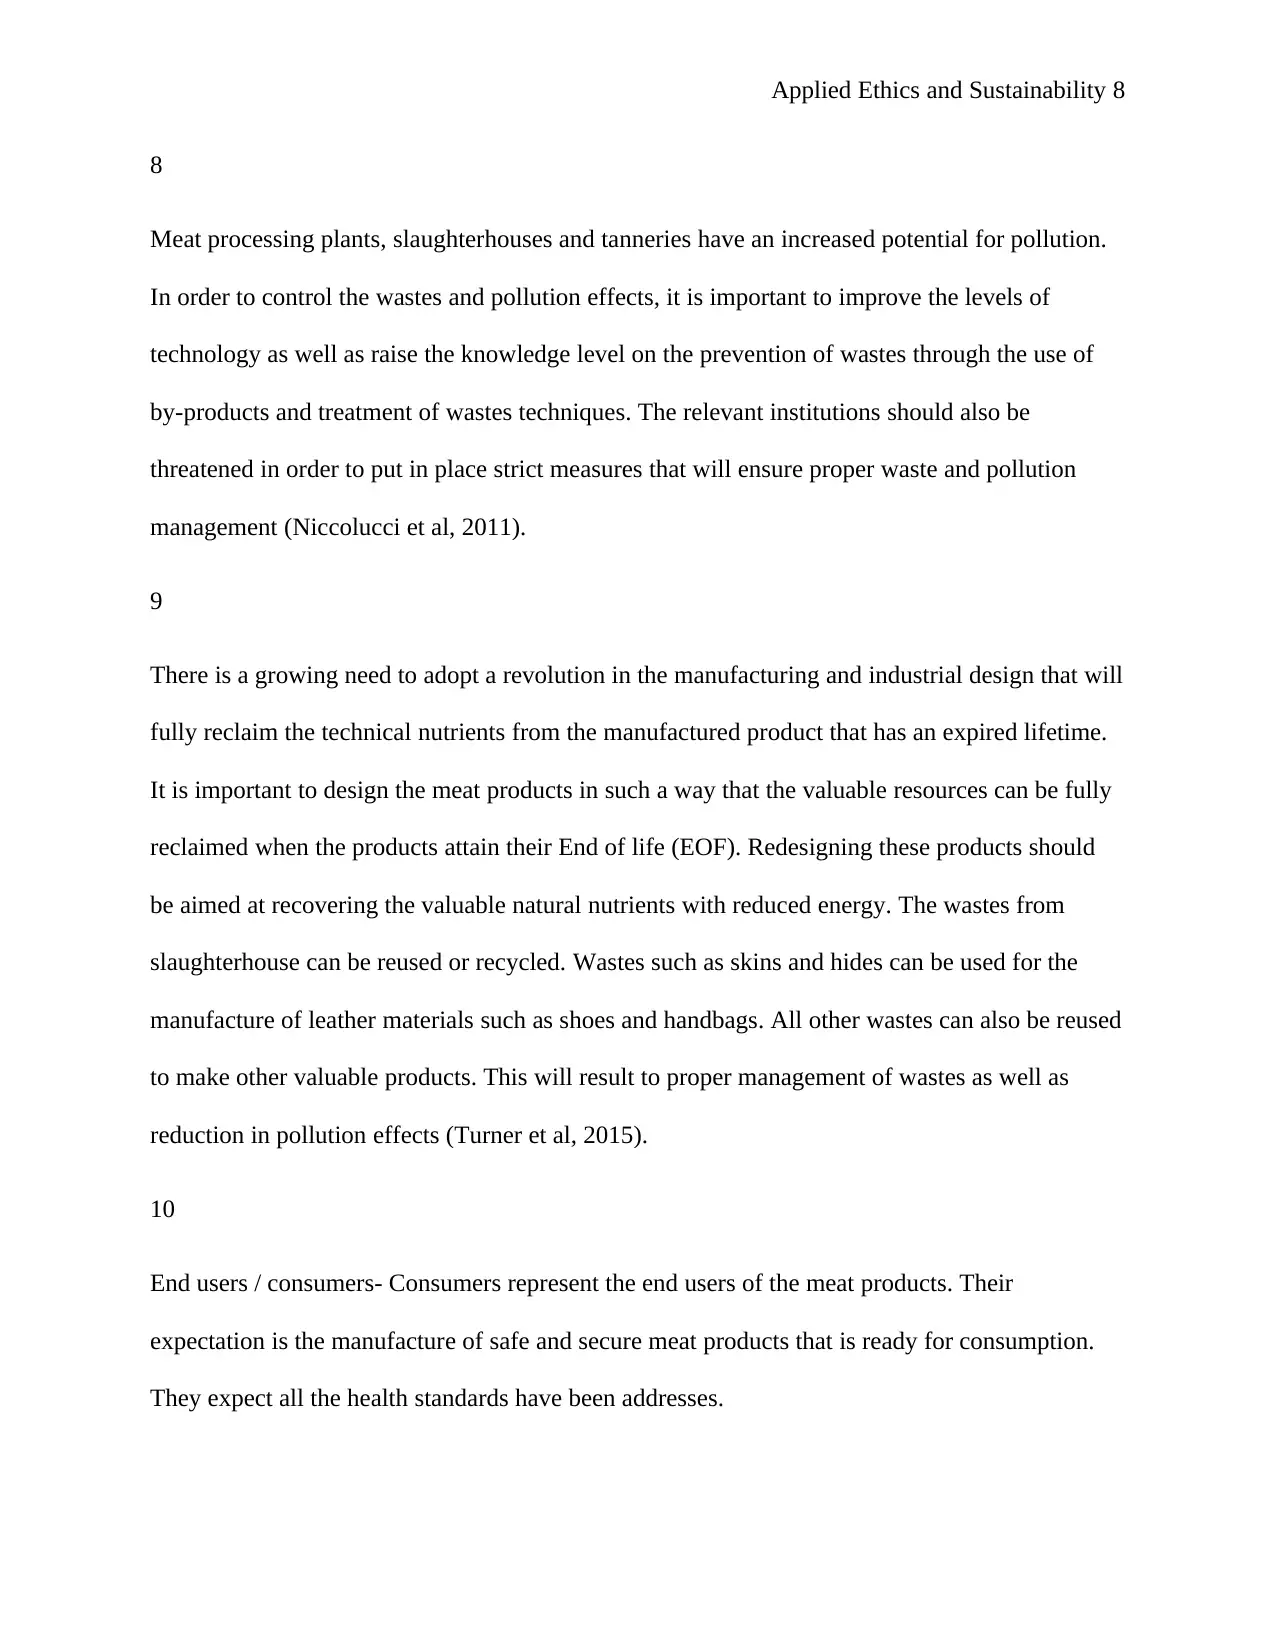
8
Meat processing plants, slaughterhouses and tanneries have an increased potential for pollution.
In order to control the wastes and pollution effects, it is important to improve the levels of
technology as well as raise the knowledge level on the prevention of wastes through the use of
by-products and treatment of wastes techniques. The relevant institutions should also be
threatened in order to put in place strict measures that will ensure proper waste and pollution
management (Niccolucci et al, 2011).
9
There is a growing need to adopt a revolution in the manufacturing and industrial design that will
fully reclaim the technical nutrients from the manufactured product that has an expired lifetime.
It is important to design the meat products in such a way that the valuable resources can be fully
reclaimed when the products attain their End of life (EOF). Redesigning these products should
be aimed at recovering the valuable natural nutrients with reduced energy. The wastes from
slaughterhouse can be reused or recycled. Wastes such as skins and hides can be used for the
manufacture of leather materials such as shoes and handbags. All other wastes can also be reused
to make other valuable products. This will result to proper management of wastes as well as
reduction in pollution effects (Turner et al, 2015).
10
End users / consumers- Consumers represent the end users of the meat products. Their
expectation is the manufacture of safe and secure meat products that is ready for consumption.
They expect all the health standards have been addresses.
Applied Ethics and Sustainability 9
The national bureau of standards- meat products are exposed to several meat products that need t
handled with a lot of keenness. The board is in charge of ensuring that all the organizations who
deal with the production of meat attain the required standards that have been set by the board
(Wackernagel et al, 2014)
Public health department- proper health is vital to any organization that deals with the
manufacture of meat products. The public health department expects that these institutions fully
comply with the required health standards.
The local meat association- they are in charge of coordinating all the occurrences within the meat
production industry. They are also in charge of organizing any research work that is aimed
towards promoting the efficiency within the industry.
11
Perceived health concerns of consuming meat- Consumption of meat has made headlines for all
the wrong treasons relating to health. Several suggestions have been made about consumption of
meat leading to several diseases including cancer, heart diseases and diabetes. The major
challenge is now on the relevant stakeholders to convince the consumers that all these health
concerns have been addressed and that the chances of occurrence have been reduced
(Wackernagel et al, 2014).
12
Public health department- the public health department is in charge of ensuring all the health
requirements are attained by the different organizations in charge of the manufacture of meat.
This will provide confidence to the end consumers that they are acquiring a product that has been
⊘ This is a preview!⊘
Do you want full access?
Subscribe today to unlock all pages.
Trusted by 1+ million students worldwide
Applied Ethics and Sustainability 10
deemed fit for consumption. It will also reduce the level of commitment and requirements by
other stakeholders.
13
The public health department should put more strict measures of ensuring earth and safety within
the meat industry to help improve sustainability within this vital industry.
14
I will limit my consumption of meat and meat product given that it is considered one of the
leading promoters for increased carbon footprint. This is supported by several research works
that have proven that withdrawal of meat products from an individual’s diet will lead to a 20%
reduction of the carbon footprint (Monfreda, Wackernagel & Deumling, 2014).
Paraphrase This Document
Need a fresh take? Get an instant paraphrase of this document with our AI Paraphraser
Applied Ethics and Sustainability 11
References
Bagliani, M., Galli, A., Niccolucci, V. and Marchettini, N., 2014. Ecological footprint analysis
applied to a sub-national area: the case of the Province of Siena (Italy). Journal of
Environmental management, 86(2), pp.354-364.
Folke, C., Kautsky, N., Berg, H., Jansson, Å. and Troell, M., 2015. The ecological footprint
concept for sustainable seafood production: a review. Ecological Applications, 8(sp1),
pp.S63-S71.
Gössling, S., Hansson, C.B., Hörstmeier, O. and Saggel, S., 2012. Ecological footprint analysis
as a tool to assess tourism sustainability. Ecological economics, 43(2-3), pp.199-211.
Hoekstra, A.Y., 2011. Human appropriation of natural capital: A comparison of ecological
footprint and water footprint analysis. Ecological Economics, 68(7), pp.1963-1974.
Jorgenson, A.K., 2013. Consumption and environmental degradation: A cross-national analysis
of the ecological footprint. Social Problems, 50(3), pp.374-394.
Kautsky, N., Rönnbäck, P., Tedengren, M. and Troell, M., 2010. Ecosystem perspectives on
management of disease in shrimp pond farming. Aquaculture, 191(1-3), pp.145-161.
Liu, J., Mooney, H., Hull, V., Davis, S.J., Gaskell, J., Hertel, T., Lubchenco, J., Seto, K.C.,
Gleick, P., Kremen, C. and Li, S., 2015. Systems integration for global sustainability.
Science, 347(6225), p.1258832.
Monfreda, C., Wackernagel, M. and Deumling, D., 2014. Establishing national natural capital
accounts based on detailed ecological footprint and biological capacity assessments. Land
use policy, 21(3), pp.231-246.
Applied Ethics and Sustainability 12
Niccolucci, V., Galli, A., Kitzes, J., Pulselli, R.M., Borsa, S. and Marchettini, N., 2011.
Ecological footprint analysis applied to the production of two Italian wines. Agriculture,
ecosystems & environment, 128(3), pp.162-166.
Turner, K., Lenzen, M., Wiedmann, T. and Barrett, J., 2015. Examining the global
environmental impact of regional consumption activities—Part 1: A technical note on
combining input–output and ecological footprint analysis. Ecological Economics, 62(1),
pp.37-44.
Wackernagel, M., Monfreda, C., Schulz, N.B., Erb, K.H., Haberl, H. and Krausmann, F., 2014.
Calculating national and global ecological footprint time series: resolving conceptual
challenges. Land use policy, 21(3), pp.271-278.
Wackernagel, M., Onisto, L., Bello, P., Linares, A.C., Falfán, I.S.L., Garcıa, J.M., Guerrero,
A.I.S. and Guerrero, M.G.S., 2016. National natural capital accounting with the
ecological footprint concept. Ecological economics, 29(3), pp.375-390.
⊘ This is a preview!⊘
Do you want full access?
Subscribe today to unlock all pages.
Trusted by 1+ million students worldwide
1 out of 12
Related Documents


Your All-in-One AI-Powered Toolkit for Academic Success.
+13062052269
info@desklib.com
Available 24*7 on WhatsApp / Email
![[object Object]](/_next/static/media/star-bottom.7253800d.svg)
Unlock your academic potential
Copyright © 2020–2026 A2Z Services. All Rights Reserved. Developed and managed by ZUCOL.