The Role of Personality Types on Stress Response: A Psychology Report
VerifiedAdded on 2020/05/04
|18
|3101
|35
Report
AI Summary
This research report investigates the relationship between personality types and stress responses, focusing on the differences in pulse rates between Type A and Type B personalities. The study employed an experimental design, utilizing the Friedman and Rosenman questionnaire to categorize participants. Participants were subjected to a mild stressor, a dot-to-dot puzzle, while their pulse rates were monitored before, during, and after the task. The results indicated that Type A personalities exhibited significantly higher pulse rates compared to Type B personalities, confirming the hypothesis that Type A individuals are more susceptible to stress. The report includes detailed methodology, results, statistical analysis using a t-test, discussion of findings, and a conclusion that highlights the implications of personality types on stress-related responses. The study also acknowledges ethical considerations and suggests potential improvements for future research, such as using alternative stressors and refining the questionnaire process.
Running head: ROLE OF PERSONALITY TYPES ON STRESS RESPONSE
ROLE OF PERSONALITY TYPES ON STRESS RESPONSE
Name of the Student
Name of the University
Author Note
ROLE OF PERSONALITY TYPES ON STRESS RESPONSE
Name of the Student
Name of the University
Author Note
Paraphrase This Document
Need a fresh take? Get an instant paraphrase of this document with our AI Paraphraser
1ROLE OF PERSONALITY TYPES ON STRESS RESPONSE
Table of Contents
Introduction......................................................................................................................................4
Aim..................................................................................................................................................5
Hypothesis.......................................................................................................................................5
Alternative Hypothesis (H1).........................................................................................................5
Null Hypothesis (H0)....................................................................................................................5
Method.............................................................................................................................................5
Design..........................................................................................................................................5
Participants..................................................................................................................................6
Apparatus.....................................................................................................................................6
Procedure.....................................................................................................................................8
Stage 1.........................................................................................................................................8
Stage 2.........................................................................................................................................8
Results..............................................................................................................................................8
Data obtained from the questionnaire..........................................................................................8
Data obtained after measurement of pulse rates..........................................................................9
Inferential Statistics/Treatment of Results.....................................................................................11
Discussion......................................................................................................................................11
Conclusion.....................................................................................................................................12
Reference List................................................................................................................................13

2ROLE OF PERSONALITY TYPES ON STRESS RESPONSE
Appendix........................................................................................................................................15
Appendix 1.................................................................................................................................15
Appendix 2.................................................................................................................................16
⊘ This is a preview!⊘
Do you want full access?
Subscribe today to unlock all pages.
Trusted by 1+ million students worldwide
3ROLE OF PERSONALITY TYPES ON STRESS RESPONSE
Abstract
This research report describes the effect of personality types on stress responses. Two types of
individuals were selected based on the personality scores obtained after using the Friedman and
Rosenman questionnaire tool. The two personality types were A and B. Both the types were
subjected to a mild stressor like dot-to-dot puzzle and their pulse rates were monitored before,
during and after the puzzle solving. The Type A personalities were found to have a higher pulse
rate than the Type B personalities. Thus, it can be concluded that Type A personalities are highly
anxious and become easily affected by stress than type B individuals.
Paraphrase This Document
Need a fresh take? Get an instant paraphrase of this document with our AI Paraphraser
4ROLE OF PERSONALITY TYPES ON STRESS RESPONSE
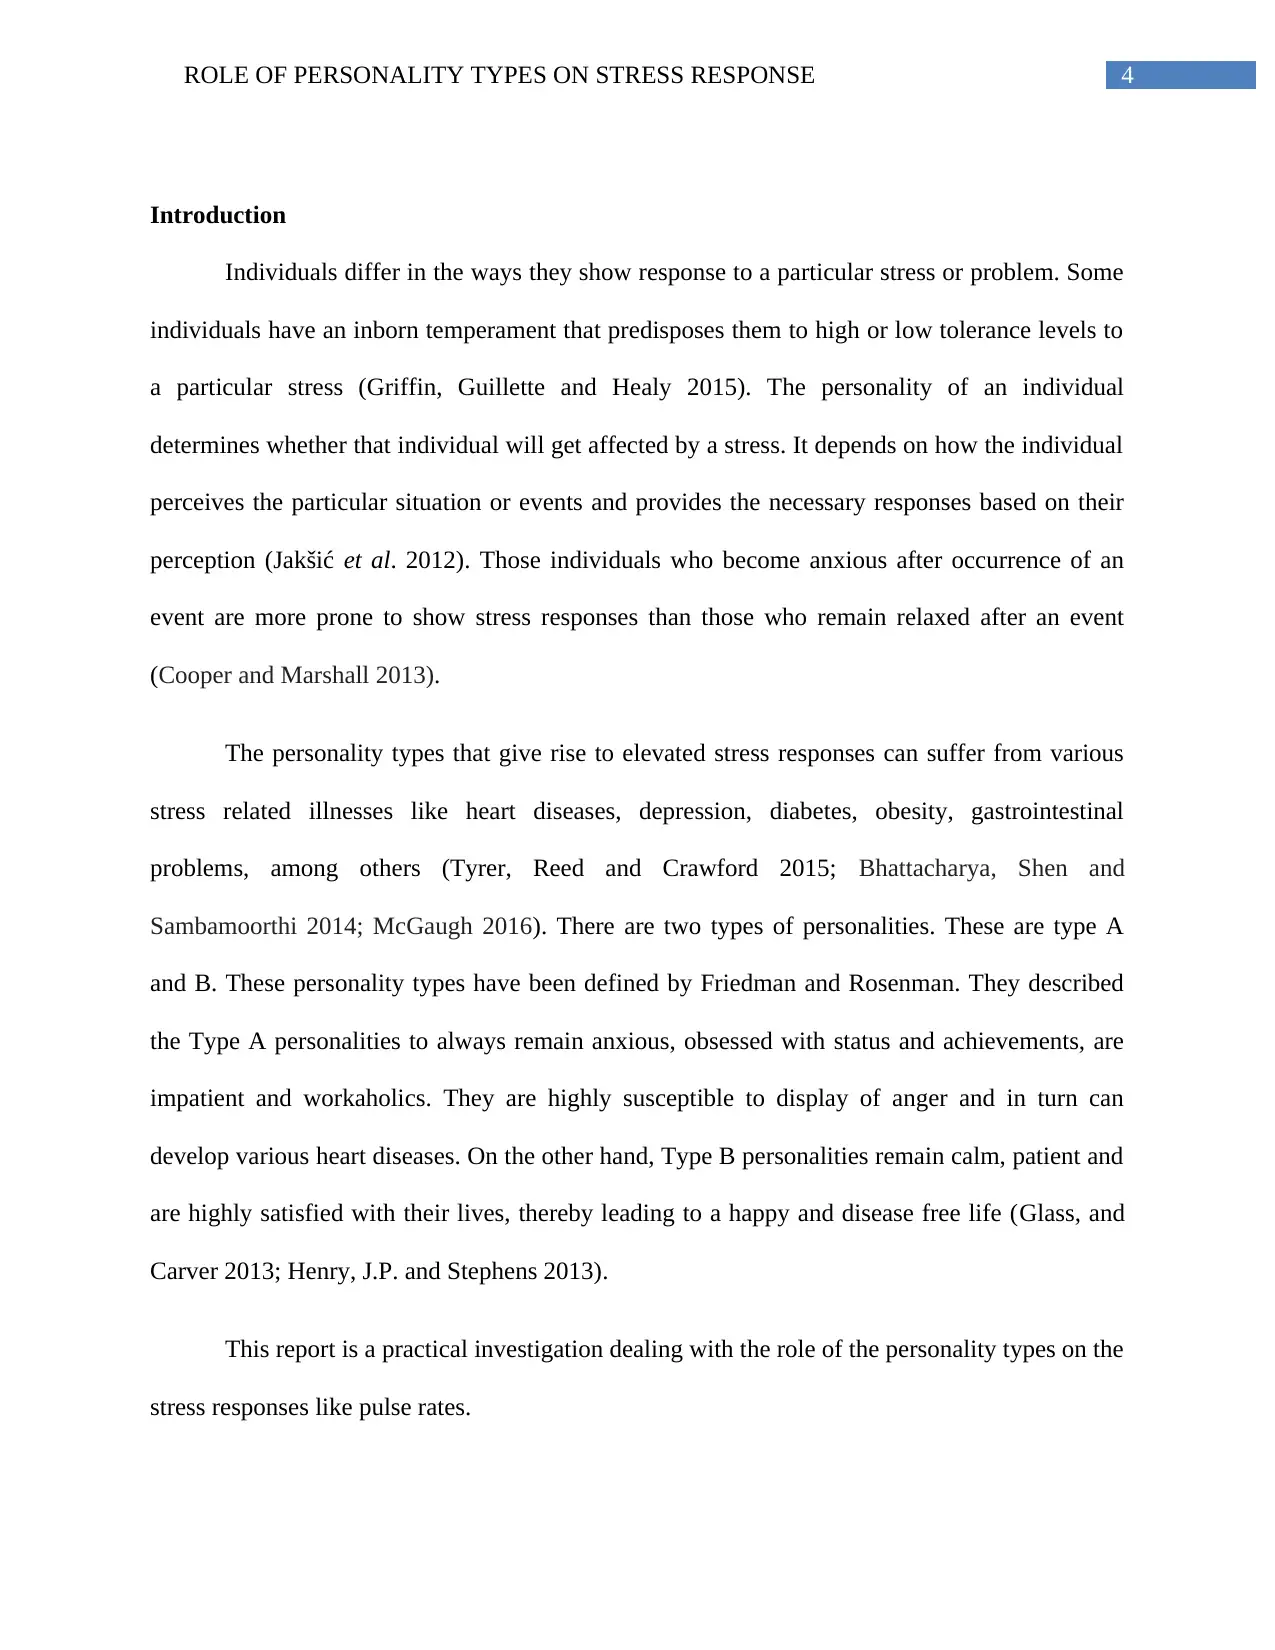
Introduction
Individuals differ in the ways they show response to a particular stress or problem. Some
individuals have an inborn temperament that predisposes them to high or low tolerance levels to
a particular stress (Griffin, Guillette and Healy 2015). The personality of an individual
determines whether that individual will get affected by a stress. It depends on how the individual
perceives the particular situation or events and provides the necessary responses based on their
perception (Jakšić et al. 2012). Those individuals who become anxious after occurrence of an
event are more prone to show stress responses than those who remain relaxed after an event
(Cooper and Marshall 2013).
The personality types that give rise to elevated stress responses can suffer from various
stress related illnesses like heart diseases, depression, diabetes, obesity, gastrointestinal
problems, among others (Tyrer, Reed and Crawford 2015; Bhattacharya, Shen and
Sambamoorthi 2014; McGaugh 2016). There are two types of personalities. These are type A
and B. These personality types have been defined by Friedman and Rosenman. They described
the Type A personalities to always remain anxious, obsessed with status and achievements, are
impatient and workaholics. They are highly susceptible to display of anger and in turn can
develop various heart diseases. On the other hand, Type B personalities remain calm, patient and
are highly satisfied with their lives, thereby leading to a happy and disease free life (Glass, and
Carver 2013; Henry, J.P. and Stephens 2013).
This report is a practical investigation dealing with the role of the personality types on the
stress responses like pulse rates.
5ROLE OF PERSONALITY TYPES ON STRESS RESPONSE
Aim
The aim of the investigation is to determine the effect of the Type A and Type B
personalities on pulse rates, when exposed to a mild stress.
Hypothesis
Alternative Hypothesis (H1)
Among the 2 personality types A and B, Type A personalities will be significantly
affected by stress and will show higher pulse rates than Type B personalities, who will show
lower pulse rates.
Null Hypothesis (H0)
There will not be any significant differences in the pulse rates of the Type A and B
personalities when exposed to a mild stressor.
Method
Design
The design of the study will be based on an experimental research method. This research
method will help to determine the differences in the pulse rates of the Type A and B personalities
following exposure to stress. The 2 types of personalities A and B will be used in the experiment.
Physiologic responses like pulse rates will be measured in case of both the personality types A
and B. Some of the factors that affect stress responses will be controlled. These factors are
gender, age, smoking or caffeine consumption (Eysenck 2012; Richards, G. and Smith 2015).
This is because smoking and consumption of caffeine increases stress responses, younger people
are more prone to stress than the older generation, while women are more prone to stress than
⊘ This is a preview!⊘
Do you want full access?
Subscribe today to unlock all pages.
Trusted by 1+ million students worldwide
6ROLE OF PERSONALITY TYPES ON STRESS RESPONSE
men are. The experimental research will be based on independent measures. The two personality
types will be segregated into groups, where Type A personalities will be present in one group
and Type B will be in another group. But, both the types will be subjected to the same levels of
stress. Both the personality types will be subjected to a dot-to-dot puzzle. The duration of the
puzzle will be 1 minute, where their pulse rates will be measured before the start of the puzzle.
Then, midway their pulse rates will be measured and after the end of the puzzle, the pulse rates
will be measured. The independent variables in the research design will be personality types,
since they will be varied, either Type A or B. The dependant variables will be the measures of
pulse rates or the baseline heart rate. In order to determine whether the method can be replicated
or not, it was given to another member of the research study group and the person was asked to
explain the method designed. The individual easily determined the method design indicating that
the method is valid and can be replicated easily.
Participants
An opportunity sampling method will be used to select the personality types A and B.
Approximately 5 type A and 5 Type B personalities can be recruited to carry out the experiment.
They will be subjected to a mental stress like a dot-to-dot puzzle and their pulse rates will be
measured. Male participants will be selected and they will be of the age range of 18-25 years.
The participants will be allocated into the two groups based on the symptoms generated as a
result of stress. The ethical challenges are to be kept in mind while allocating the individuals for
the experiments. The individuals should not feel that the workers associated with the experiment
are invading their personal space while carrying out the research. Other ethical challenges will
involve in providing the individuals with details of their stress related medical disorders.
Paraphrase This Document
Need a fresh take? Get an instant paraphrase of this document with our AI Paraphraser
7ROLE OF PERSONALITY TYPES ON STRESS RESPONSE
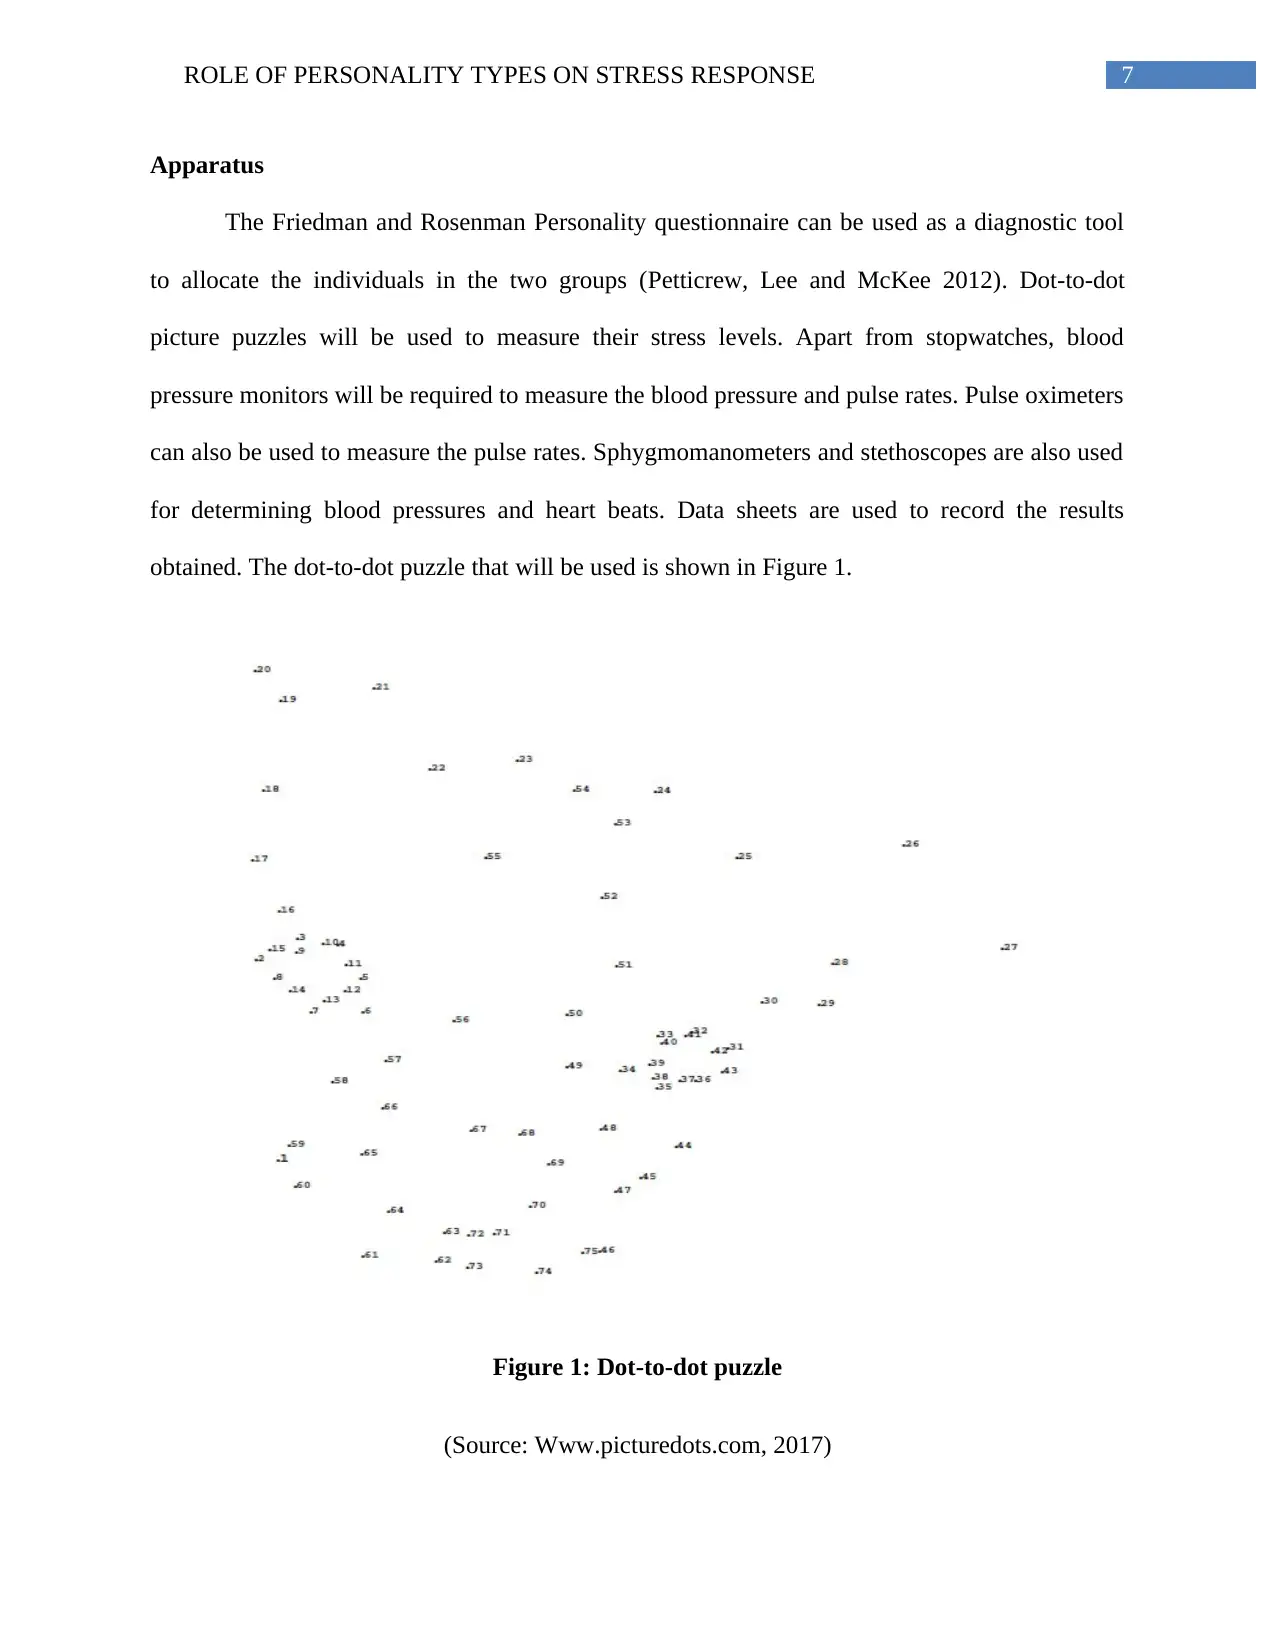
Apparatus
The Friedman and Rosenman Personality questionnaire can be used as a diagnostic tool
to allocate the individuals in the two groups (Petticrew, Lee and McKee 2012). Dot-to-dot
picture puzzles will be used to measure their stress levels. Apart from stopwatches, blood
pressure monitors will be required to measure the blood pressure and pulse rates. Pulse oximeters
can also be used to measure the pulse rates. Sphygmomanometers and stethoscopes are also used
for determining blood pressures and heart beats. Data sheets are used to record the results
obtained. The dot-to-dot puzzle that will be used is shown in Figure 1.
Figure 1: Dot-to-dot puzzle
(Source: Www.picturedots.com, 2017)
8ROLE OF PERSONALITY TYPES ON STRESS RESPONSE
Procedure
Stage 1
The Friedman and Rosenman questionnaire tool will be used to determine whether the
individuals are Type A or B (Appendix 1). The scores obtained will be used to segregate the
individuals into Types A and B.
The personalities were differentiated based on the scores obtained after carrying out the
Friedman and Rosenman questionnaire. Those individuals who had a score of + 1 or more were
considered to be Type A personalities, while those individuals who scored negative that is – 1 or
less are considered to be Type B personalities. However, if some individuals could not be easily
identified as Type A or B, for such individuals the questions B, D and J of the questionnaire will
be used. If they scored 10 or above, they will be classified as Type A, while those who scored 6
or below will be classified as Type B.
Stage 2
The stage 2 of the procedure involves the solving of the dot-to-dot puzzle by the selected
participants. The pulse rates will be monitored in 3 stages. The first stage or pulse rate 1 (PR1)
will be monitored before the start of the puzzle. The second stage or pulse rate 2 (PR2) will be
monitored every 5 seconds during the puzzle and stage 3 or pulse rate 3 (PR3) will be monitored
after the participants have solved the puzzle.
Results
Data obtained from the questionnaire
Table 1: Total scores of participants
⊘ This is a preview!⊘
Do you want full access?
Subscribe today to unlock all pages.
Trusted by 1+ million students worldwide
9ROLE OF PERSONALITY TYPES ON STRESS RESPONSE
Participant No. Total score Personality type
1 5 A
2 4 A
3 -4 B
4 -5 B
5 -2 B
6 -6 B
7 10 A
8 3 A
9 2 A
10 -3 B
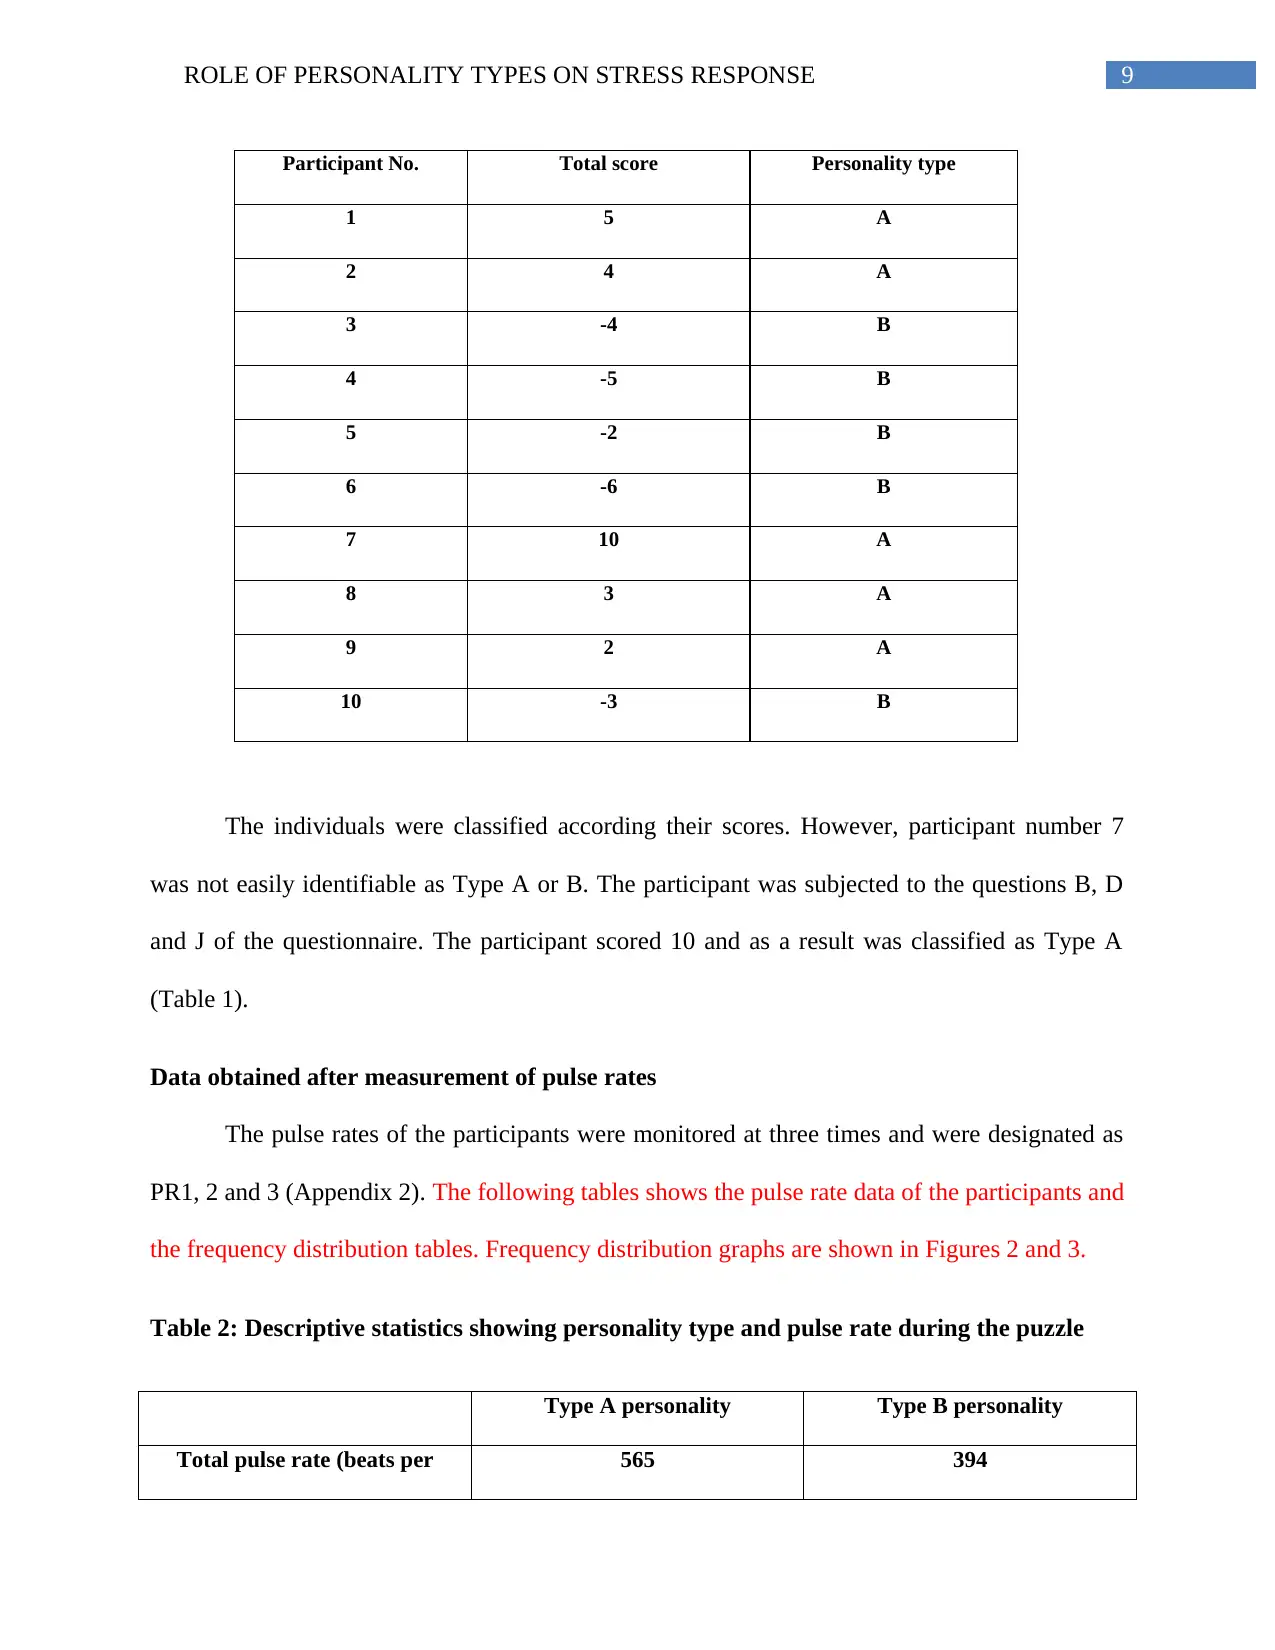
The individuals were classified according their scores. However, participant number 7
was not easily identifiable as Type A or B. The participant was subjected to the questions B, D
and J of the questionnaire. The participant scored 10 and as a result was classified as Type A
(Table 1).
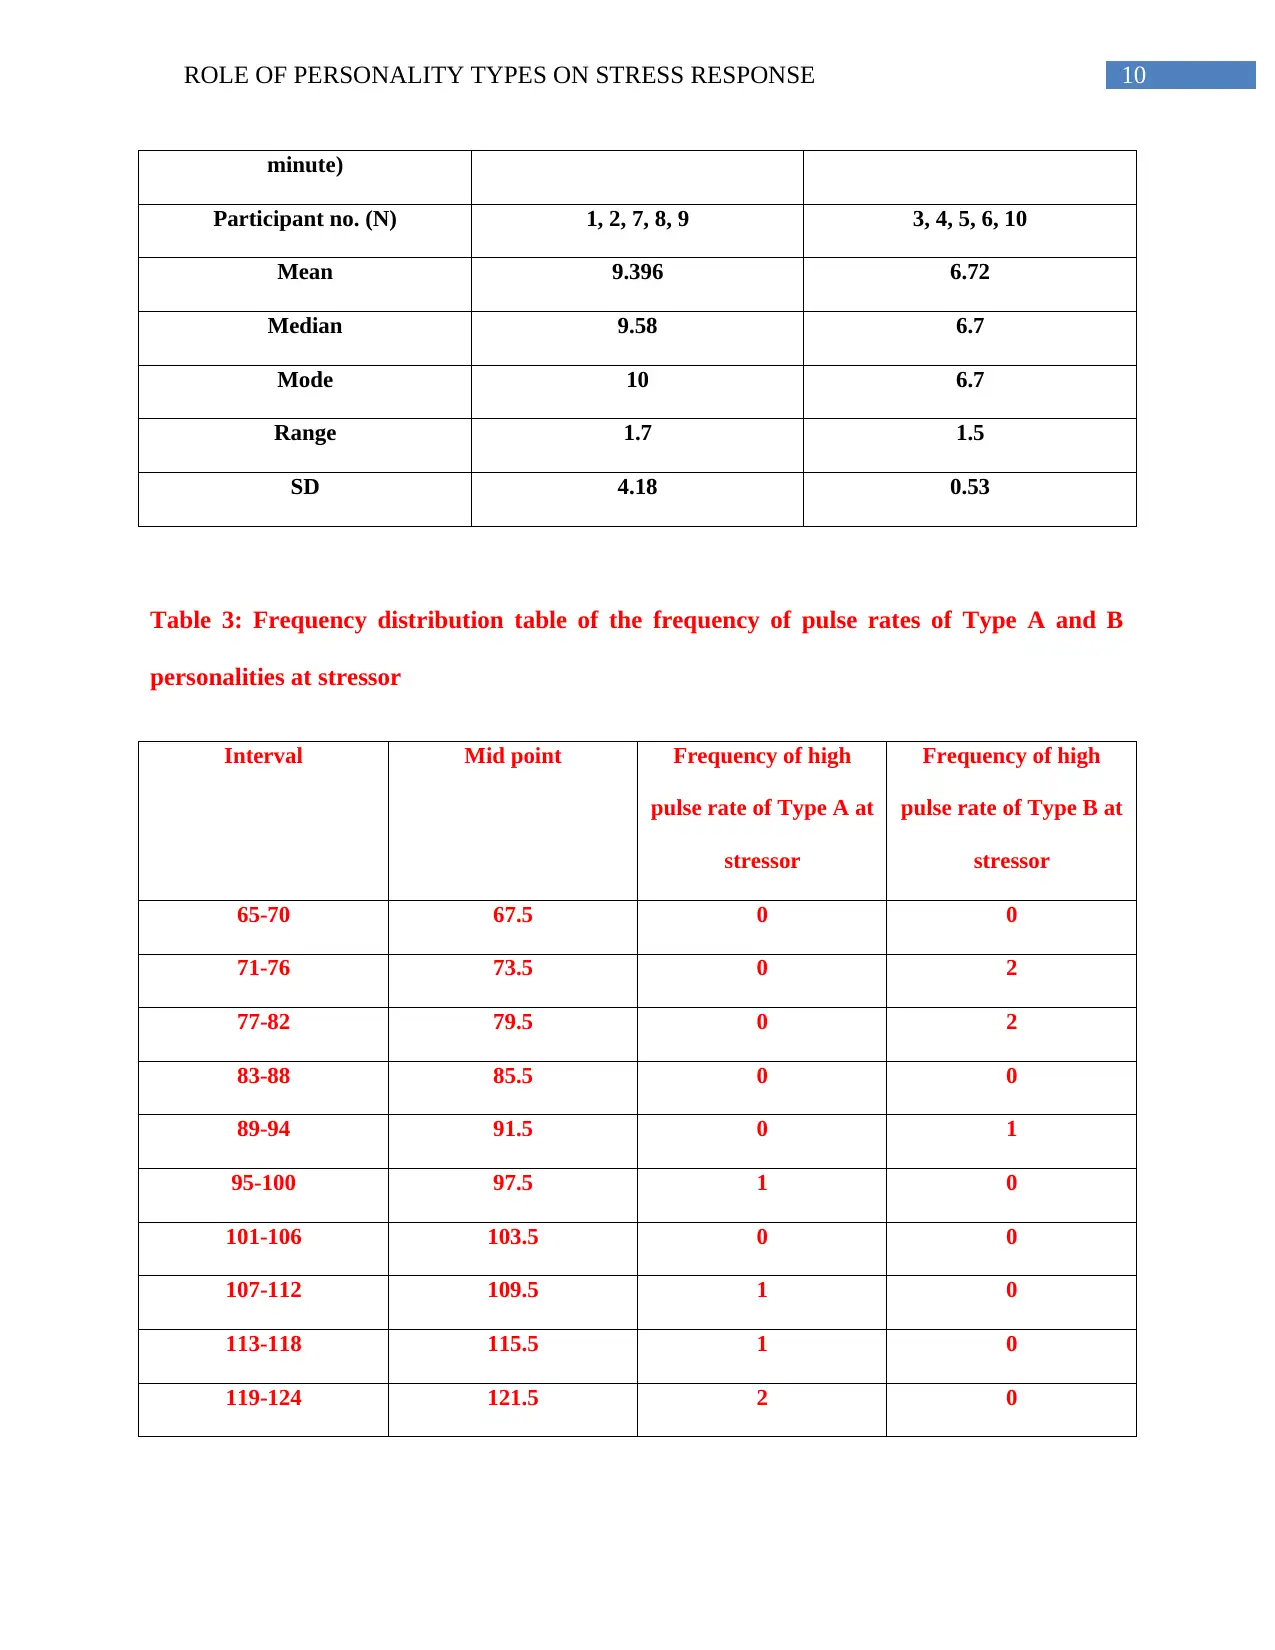
Data obtained after measurement of pulse rates
The pulse rates of the participants were monitored at three times and were designated as
PR1, 2 and 3 (Appendix 2). The following tables shows the pulse rate data of the participants and
the frequency distribution tables. Frequency distribution graphs are shown in Figures 2 and 3.
Table 2: Descriptive statistics showing personality type and pulse rate during the puzzle
Type A personality Type B personality
Total pulse rate (beats per 565 394
Participant No. Total score Personality type
1 5 A
2 4 A
3 -4 B
4 -5 B
5 -2 B
6 -6 B
7 10 A
8 3 A
9 2 A
10 -3 B
The individuals were classified according their scores. However, participant number 7
was not easily identifiable as Type A or B. The participant was subjected to the questions B, D
and J of the questionnaire. The participant scored 10 and as a result was classified as Type A
(Table 1).
Data obtained after measurement of pulse rates
The pulse rates of the participants were monitored at three times and were designated as
PR1, 2 and 3 (Appendix 2). The following tables shows the pulse rate data of the participants and
the frequency distribution tables. Frequency distribution graphs are shown in Figures 2 and 3.
Table 2: Descriptive statistics showing personality type and pulse rate during the puzzle
Type A personality Type B personality
Total pulse rate (beats per 565 394
Paraphrase This Document
Need a fresh take? Get an instant paraphrase of this document with our AI Paraphraser
10ROLE OF PERSONALITY TYPES ON STRESS RESPONSE
minute)
Participant no. (N) 1, 2, 7, 8, 9 3, 4, 5, 6, 10
Mean 9.396 6.72
Median 9.58 6.7
Mode 10 6.7
Range 1.7 1.5
SD 4.18 0.53
Table 3: Frequency distribution table of the frequency of pulse rates of Type A and B
personalities at stressor
Interval Mid point Frequency of high
pulse rate of Type A at
stressor
Frequency of high
pulse rate of Type B at
stressor
65-70 67.5 0 0
71-76 73.5 0 2
77-82 79.5 0 2
83-88 85.5 0 0
89-94 91.5 0 1
95-100 97.5 1 0
101-106 103.5 0 0
107-112 109.5 1 0
113-118 115.5 1 0
119-124 121.5 2 0
11ROLE OF PERSONALITY TYPES ON STRESS RESPONSE
0
0.5
1
1.5
2
2.5
Frequency
Pulse Rates
Frequency of high pulse rate of Type
A at stressor
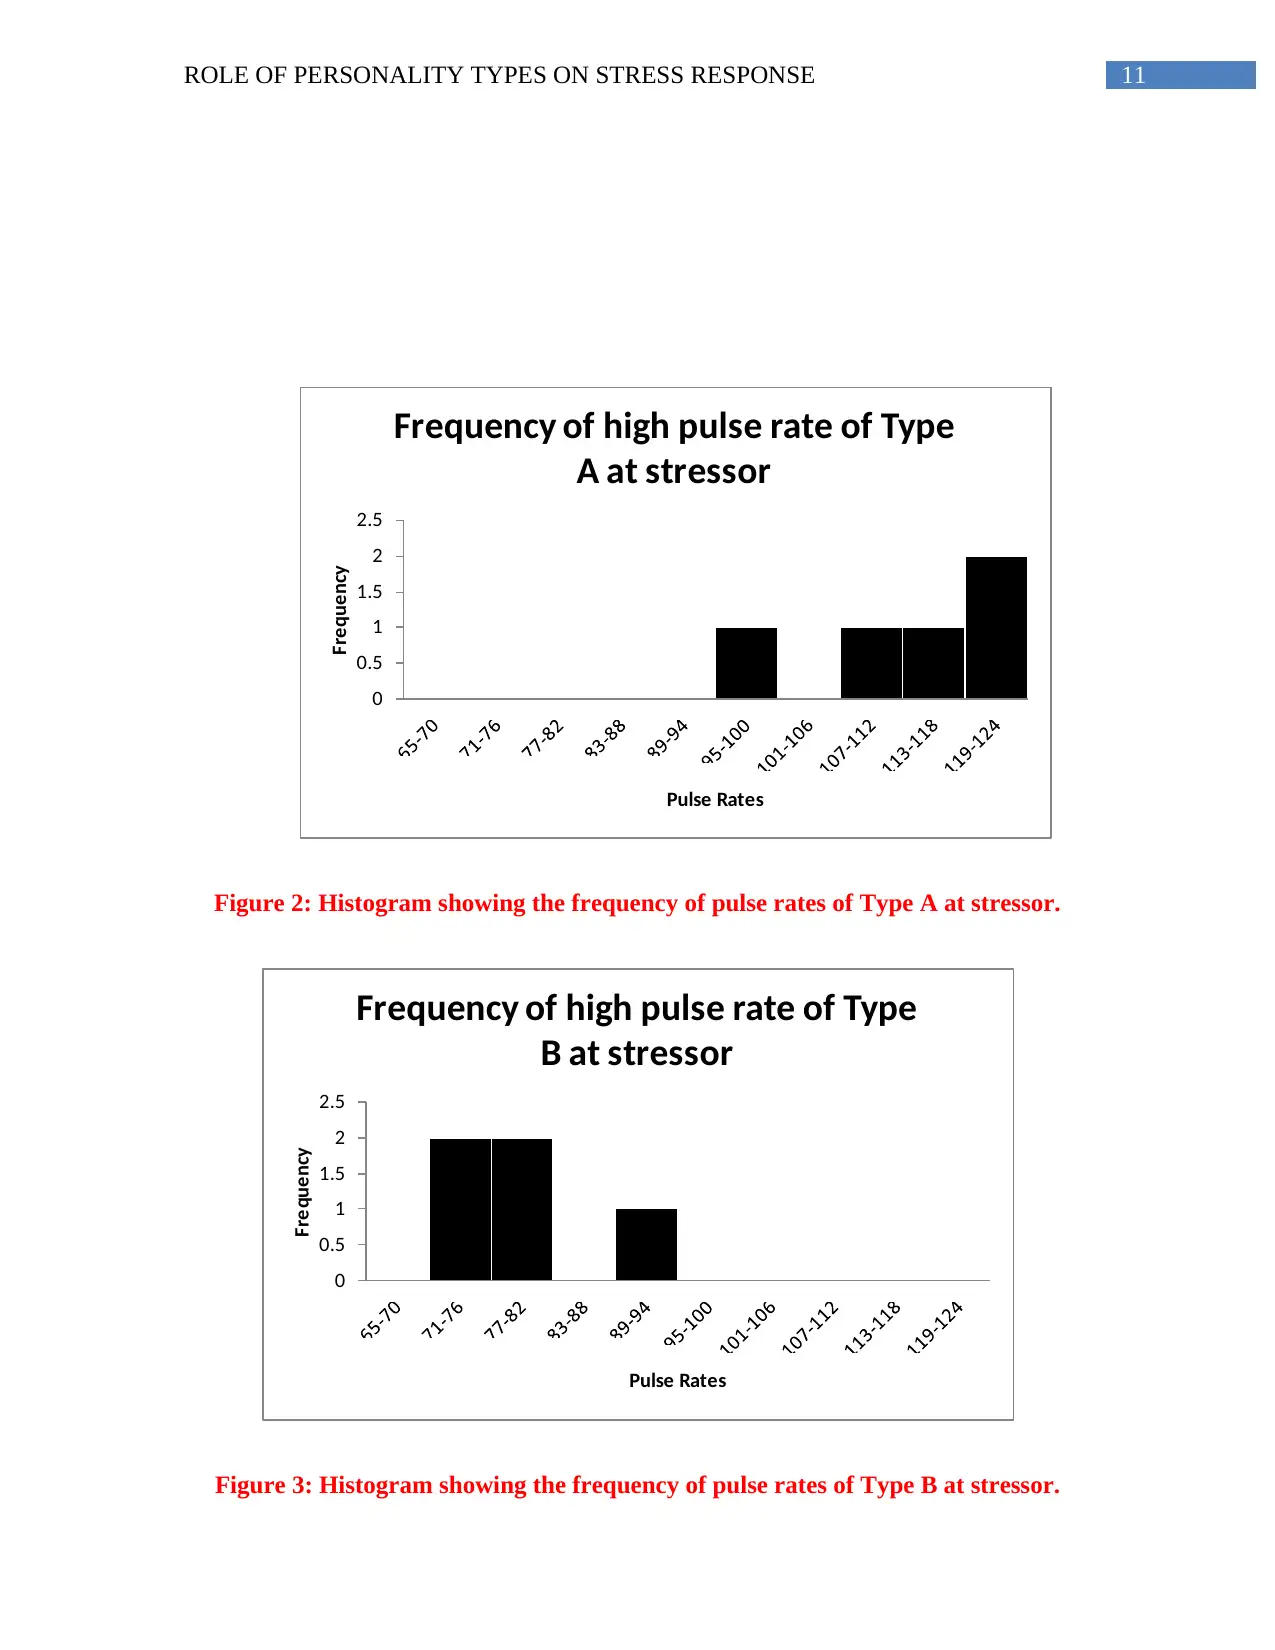
Figure 2: Histogram showing the frequency of pulse rates of Type A at stressor.
0
0.5
1
1.5
2
2.5
Frequency
Pulse Rates
Frequency of high pulse rate of Type
B at stressor
Figure 3: Histogram showing the frequency of pulse rates of Type B at stressor.
0
0.5
1
1.5
2
2.5
Frequency
Pulse Rates
Frequency of high pulse rate of Type
A at stressor
Figure 2: Histogram showing the frequency of pulse rates of Type A at stressor.
0
0.5
1
1.5
2
2.5
Frequency
Pulse Rates
Frequency of high pulse rate of Type
B at stressor
Figure 3: Histogram showing the frequency of pulse rates of Type B at stressor.
⊘ This is a preview!⊘
Do you want full access?
Subscribe today to unlock all pages.
Trusted by 1+ million students worldwide
1 out of 18


Your All-in-One AI-Powered Toolkit for Academic Success.
+13062052269
info@desklib.com
Available 24*7 on WhatsApp / Email
![[object Object]](/_next/static/media/star-bottom.7253800d.svg)
Unlock your academic potential
Copyright © 2020–2026 A2Z Services. All Rights Reserved. Developed and managed by ZUCOL.