Analyzing Water Consumption in Perth: Climate Change and Solutions
VerifiedAdded on 2023/03/21
|16
|3128
|72
Report
AI Summary
This report examines the issue of high household water consumption in Perth, Australia, despite its dry Mediterranean climate and rapidly drying conditions. The analysis highlights the impact of climate change, including declining rainfall and increasing atmospheric pressure, on water availability. Factors such as La Nina and El Nino phenomena, water and air pollution, and increased evapotranspiration rates are discussed. The report includes a systems analysis of Perth's water supply, evaluating river inflows and catchment gauging data to demonstrate the effects of climate change on water resources. Recommendations are provided, considering industrial water usage and potential alternative sources like recycled wastewater, with a focus on strategic water distribution to address the growing water shortage in the region.
Topic
Perth has a dry Mediterranean climate, and a rapidly drying climate, yet household water
consumption continues to be amongst the highest in Australia”
Student Name
Subject Name
Date
Perth has a dry Mediterranean climate, and a rapidly drying climate, yet household water
consumption continues to be amongst the highest in Australia”
Student Name
Subject Name
Date
Paraphrase This Document
Need a fresh take? Get an instant paraphrase of this document with our AI Paraphraser
Introduction
Perth is categorized as a rapid growing City in the overall South West Australia corner. The
population of the people dwelling in the area is estimated at 1.6 million. Further to this, the City
has a time difference of 12 hours when compared to the one for the US east on the coast. On the
other hand, the City is considered to neighbor the Indian Ocean on the West Coast shore. This
location is regarded to offer a mark of identity for the different Western Australians residing in
the area1.
Preferably, there are reports that the Indian Ocean has begun to depict changes as far as the
climatic conditions are concerned, and this has impacted on the lifestyles of the people living in
the area. Perth is considered to be a canary miner, and this is in line with the climate change
reported in the area. This analysis primarily grounded on the global greenhouse assessment
conducted on the corner of the makeable Australia state and which indicated that the City would
suffers as a result of rainfall decline.
Furthermore, the reports on the rainfall amounts recorded on the region indicated a decline of
about 50%2. The decline in the anticipated amount of rainfall by 50% made the Water
Corporation depict the norm. The findings suggested and established the fall was not a result of
the drought in the area but instead came from the changes in the climate.
Background to Problem
1 Bonada and Resh, “Mediterranean-climate streams and rivers,” 12.
2 D'Agui et al. "Phenotypic variation and differentiated gene expression of Australian plants in response to declining
rainfall, 123".
Perth City has depicted a makeable growth as compared to the other cities in Australia in terms
of the population. The City has recorded a constant green environment despite the evidence of
low rainfall as well as the drying climate which have been reported in the area of the years. The
population of the Perth City has continued to grow, and this has double from 800,000 to 1.6
million in the present3. The estimation of the population by 2030 has been approximated at about
2.3 million. Thus, there is the likelihood that the water requirement in the area will increase if the
overall demand management in line with the programs continued to intensify in the long run.
Subsequently, the overall residential water demands are largely estimated to high, and this is
reported to be three-quarters as compared to the total scheme water requirement in the area.
Thus, planning for the future will require the inclusion of the domestic water demands in the
modeling process and the overall analysis for the management. On the other hand, the evaluation
by the Water Corporation in the City has reported that the present per capita water usage is
approximated at about 145 kilolitres (kl) per household. However, if this consumption rate is
maintained, then it will require that the additional water supply of about 120 gigalitres (Gl) be
supplied to the area by the end of 20304.
On the other hand, the proposal by the Water Corporation to reduce the consumption of water in
the area will result in an additional supply of 70 GI. Presently, there is the use of the household
water is estimated at 47% as far as the utilization of the outdoors is concerned in the region. The
evaluation of the adoption strategy to curb the challenges facing the water demands in the area is,
3 Enright and Fontaine, "Climate Change and the Management of Fire‐Prone Vegetation in Southwest and Southeast
Australia," 34.
4 Frost et al., "Water, history and the Australian city," 23.
⊘ This is a preview!⊘
Do you want full access?
Subscribe today to unlock all pages.
Trusted by 1+ million students worldwide

therefore important. This is because the climate change in the area will continue to pose the
makeable difficulties on water consumption and the overall demands in the area.
Also, the recommendations of the strategic measures are important since climate change has led
to the reduction of the reported runoff reservoirs from the makeable 400 GI annually to
approximately 100 GI by 2030.
Systems Analysis
The analysis of the water supply in Perth City and the larger Australia as a continent is not only
essential but also essential for this research. The below Australian Water map is a viable and
vital element which appraises and summarizes the water-related data in line with the factual,
detailed as well as physical attractions. The image gives the evaluation and the summary on both
spatial elements as well as non-spatial components. This figure further provides the analysis of
the water usage as well as the essential management practices regarding resource usage in the
area.
Paraphrase This Document
Need a fresh take? Get an instant paraphrase of this document with our AI Paraphraser

Figure Showing the Australian Water Map5
The rainfall distribution in the area is also another essential aspect which has been appraised in
line with this research. The graphical analysis below shows the delivery of the rainfall in the
area.
Graph Showing the Rainfall Distribution in the Area6
The distribution curve for the rainfall amount reported and documented in the graph above
indicates that there is a significant reduction in the amount of the rainfall which the area
received. This is evident in the decrease in the amount reported from 1876 to 2001. It could be
5 Frost, "Water and the Making of Californian and Australian Cities: Introduction," 123.
6 Gray et al., "Provenance modulates the sensitivity of stored seeds of the Australian native grass Neurachne
alopecuroidea to temperature and moisture availability," 106.

possible that climate change is the major contributor to the reduction in the amount of rainfall
reported and anticipated in the region7.
Major Factors
There are different factors which affect water consumption in Perth City. Some of the significant
factors which impacts on water usage and water needs in the area mostly discussed as follows
Large Scale Phenomena
Phenomena such as the La Nina and El Nino often affect the water supply in Perth City. These
factors are considered to result from the climate changes8. In essence, the rainfall amounts
reported in some of the areas have varied dramatically from one year to the next in due course. It
is clear that there natural variability with longer-term trends which attributed to the distribution
of the precipitations in the different area. Furthermore, there are significant drying levels which
have been reported across Perth City. The reduction in the precipitation amounts can be
illustrated by the graphical analysis below
7 Horne, "Water security in Australia," 23.
8 Luthy et al., "Urban Stormwater to Enhance Water Supply," 35.
⊘ This is a preview!⊘
Do you want full access?
Subscribe today to unlock all pages.
Trusted by 1+ million students worldwide
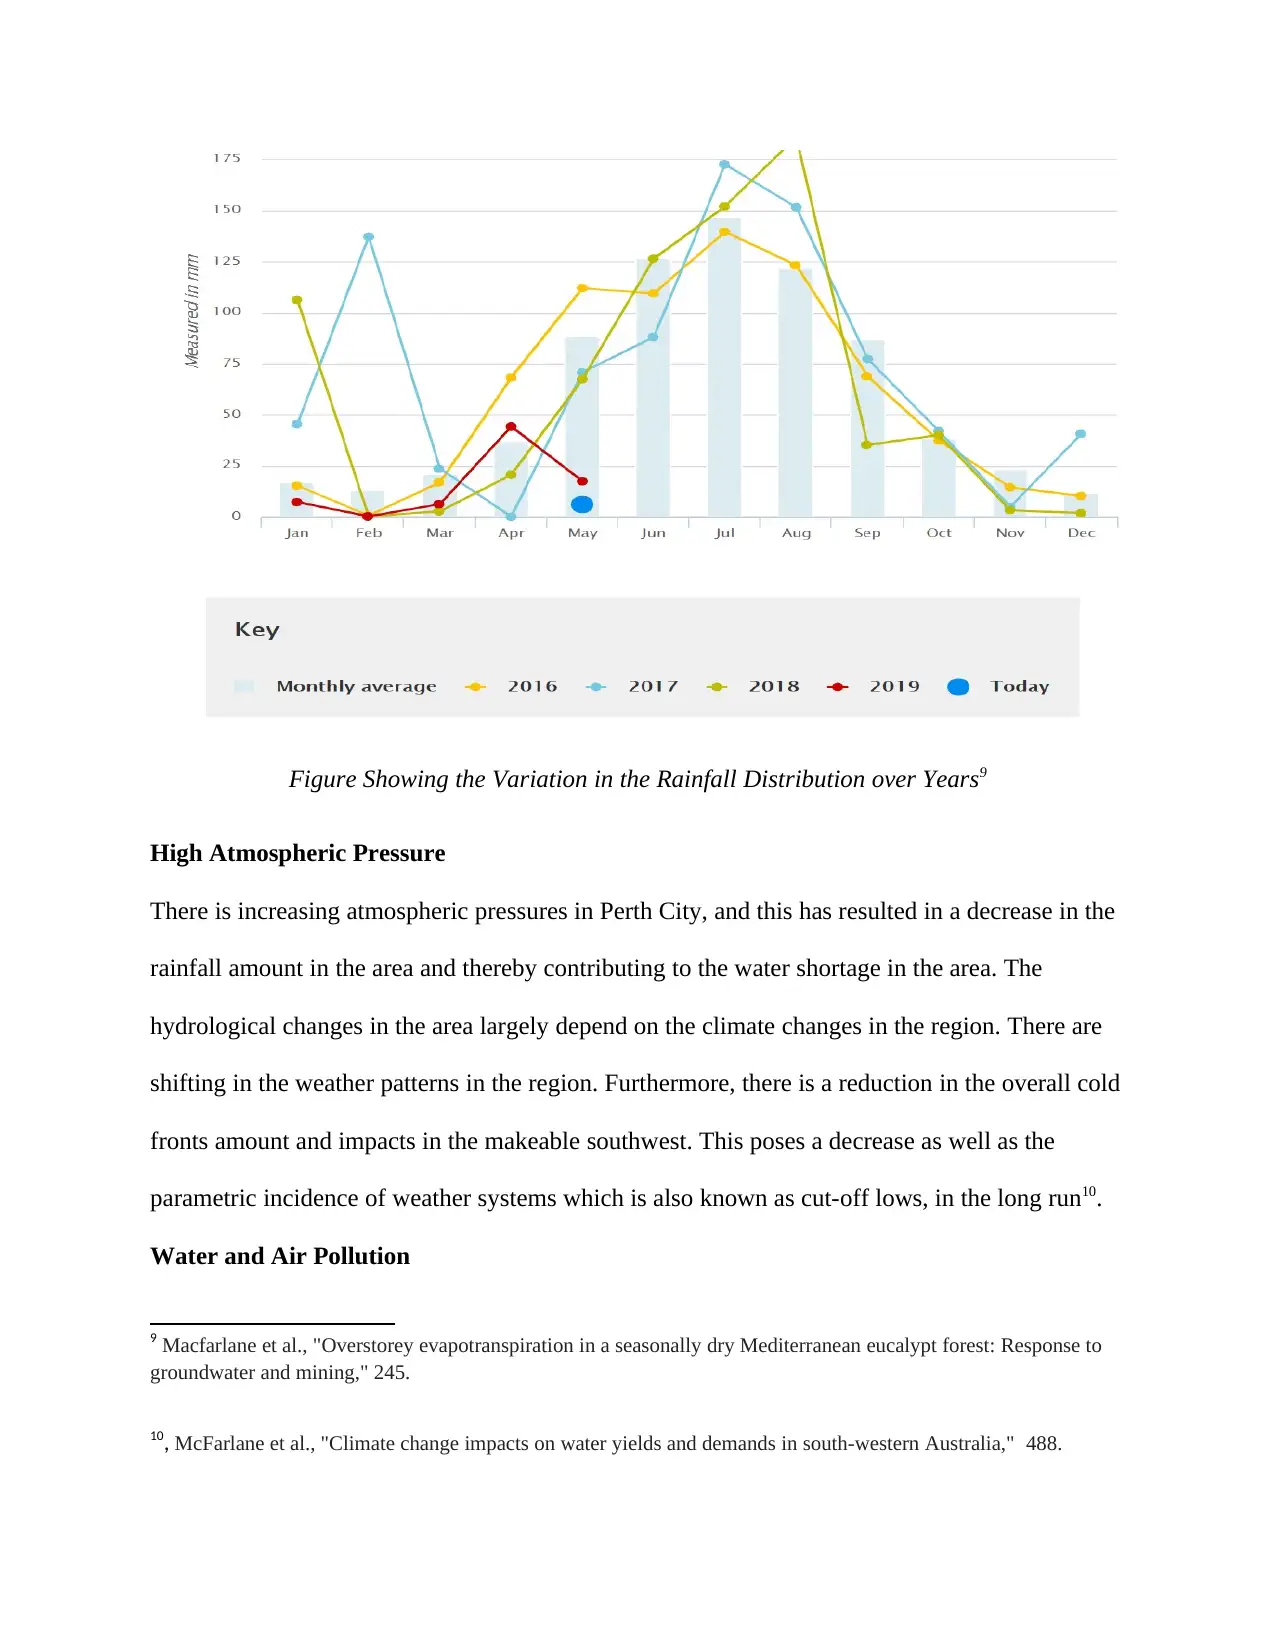
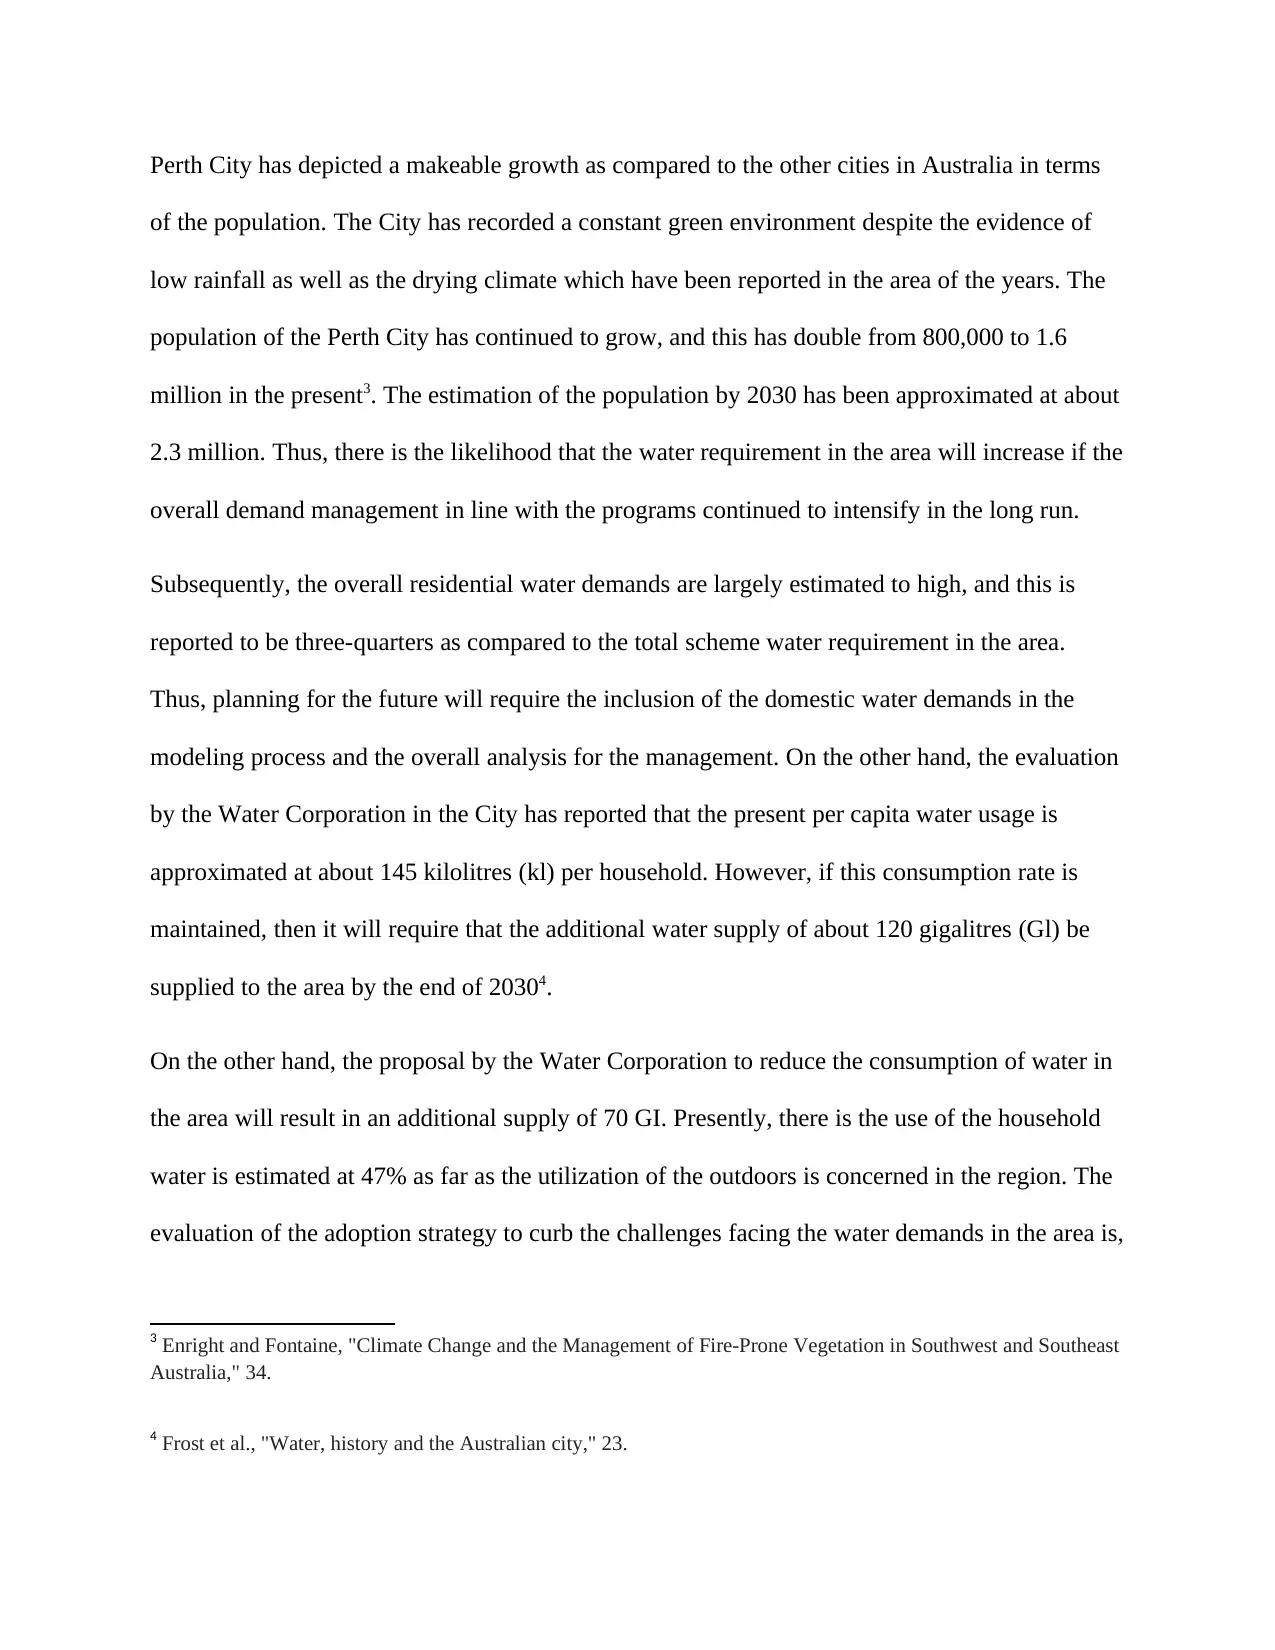
Figure Showing the Variation in the Rainfall Distribution over Years9
High Atmospheric Pressure
There is increasing atmospheric pressures in Perth City, and this has resulted in a decrease in the
rainfall amount in the area and thereby contributing to the water shortage in the area. The
hydrological changes in the area largely depend on the climate changes in the region. There are
shifting in the weather patterns in the region. Furthermore, there is a reduction in the overall cold
fronts amount and impacts in the makeable southwest. This poses a decrease as well as the
parametric incidence of weather systems which is also known as cut-off lows, in the long run10.
Water and Air Pollution
9 Macfarlane et al., "Overstorey evapotranspiration in a seasonally dry Mediterranean eucalypt forest: Response to
groundwater and mining," 245.
10, McFarlane et al., "Climate change impacts on water yields and demands in south-western Australia," 488.
Paraphrase This Document
Need a fresh take? Get an instant paraphrase of this document with our AI Paraphraser
There are different pollutions which can result from climate change. Some of the infection
mostly produces from greenhouse gases such as hydrogen sulfide and carbon (iv) oxide, which
leads to the formation of the acidic rain in the long run. Pollution is considered to have not only
immense impacts on water scarcity but also climate change. The moment that, then it turns to be
undrinkable. Some of the sources of hazardous substances include oil spills, sewage, chemical
spills, and airborne pollution. Preferably, large-scale pollution often affects water miles, animal
habitats, and ecosystems.
Describe each interaction in much more detail
The detailed description and the analysis of the water shortage as a result of the climate change
in the area can be depicted and appraised via the application of the figure below

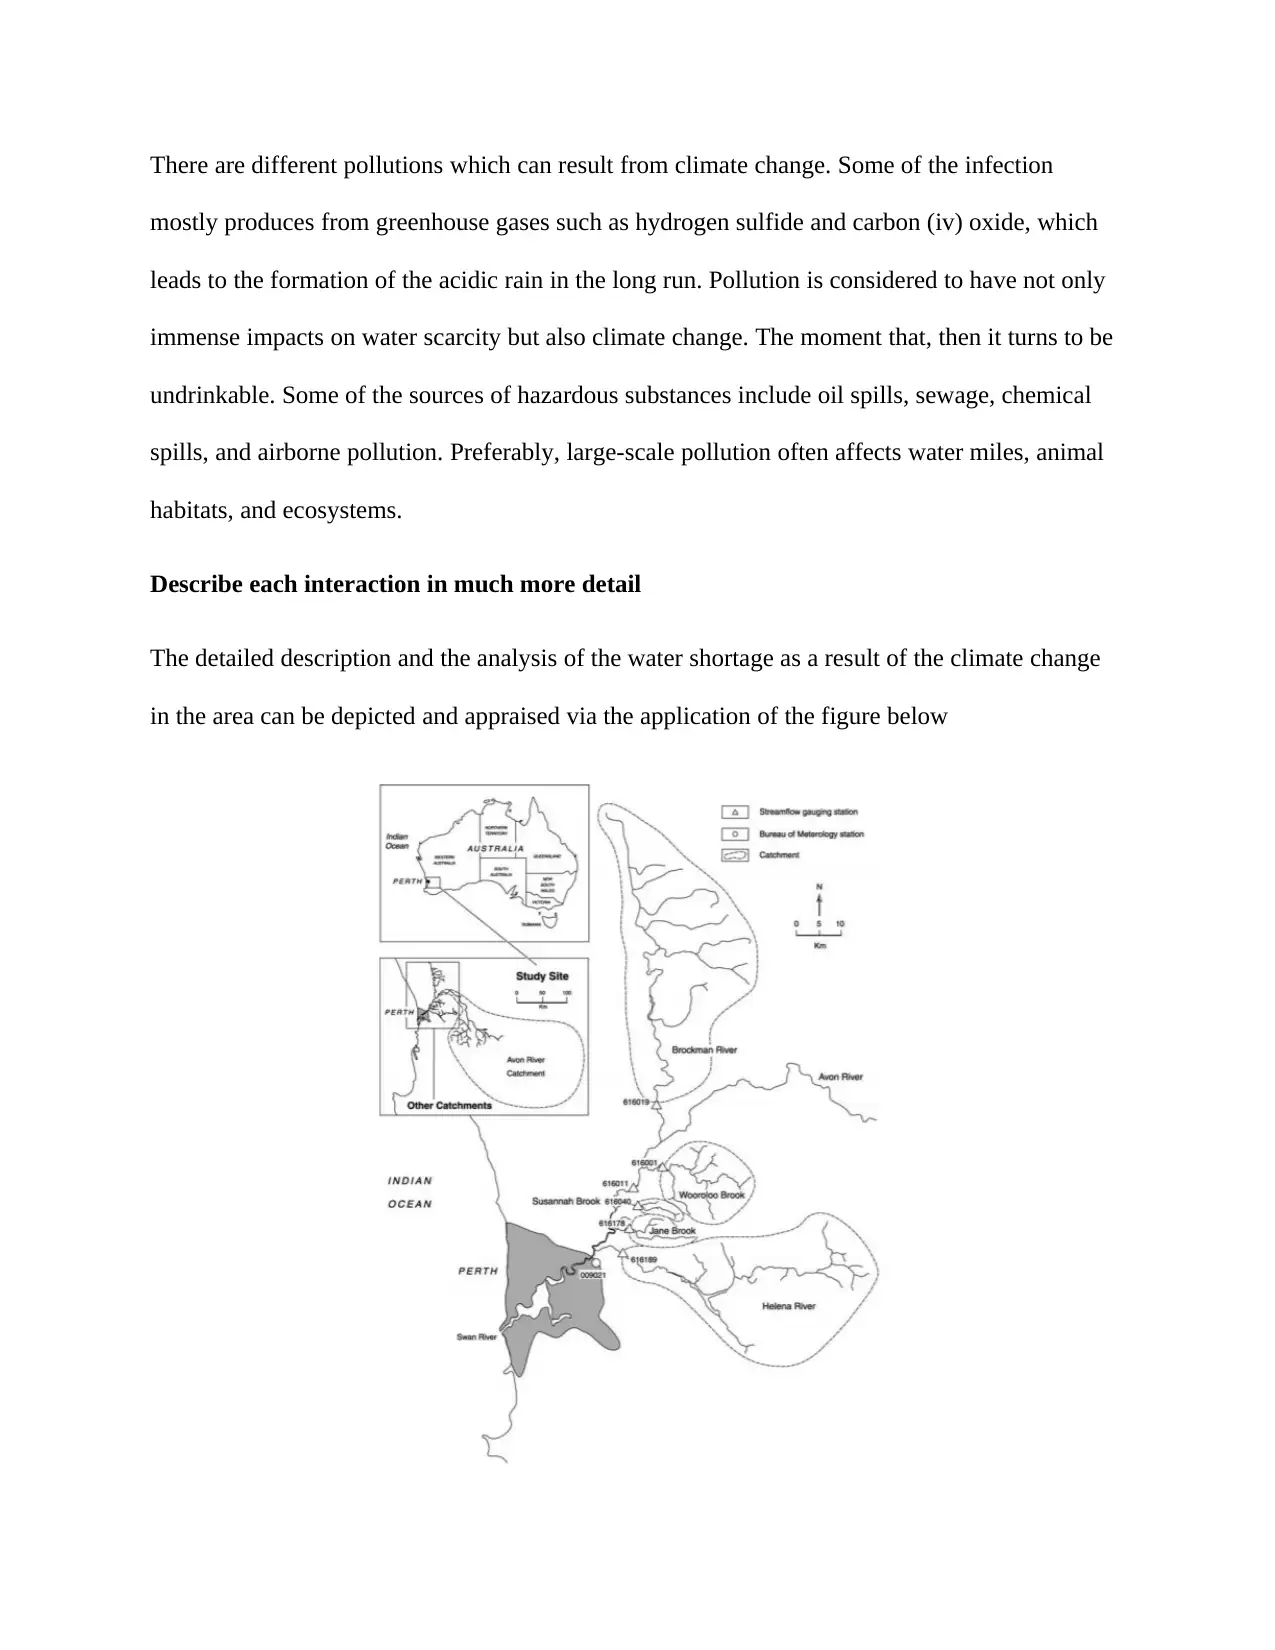
Figure illustrating the analysis of River Inflows and water in the Perth City11
The analysis on the river gauging has been conducted and carried out to ensure that the effects on
the river flow are reported and documented as far as the climate change is concerned. The
analysis gathered widely documented as illustrated and summarized in the two tables below12
Table showing the Catchment Gauging Analysis13
Also, the figure showing the results gathered from the gauging of the various rivers in Perth City.
11 Morgan, "The allure of climate and water independence: Desalination projects in Perth and San Diego," 234.
12 Radcliffe, "History of Water Sensitive Urban Design/Low Impact Development Adoption in Australia and
Internationally,” 24.
13 Simpson and David Newsome, "Environmental history of an urban wetland: from degraded colonial resource to
nature conservation area" 234.
⊘ This is a preview!⊘
Do you want full access?
Subscribe today to unlock all pages.
Trusted by 1+ million students worldwide
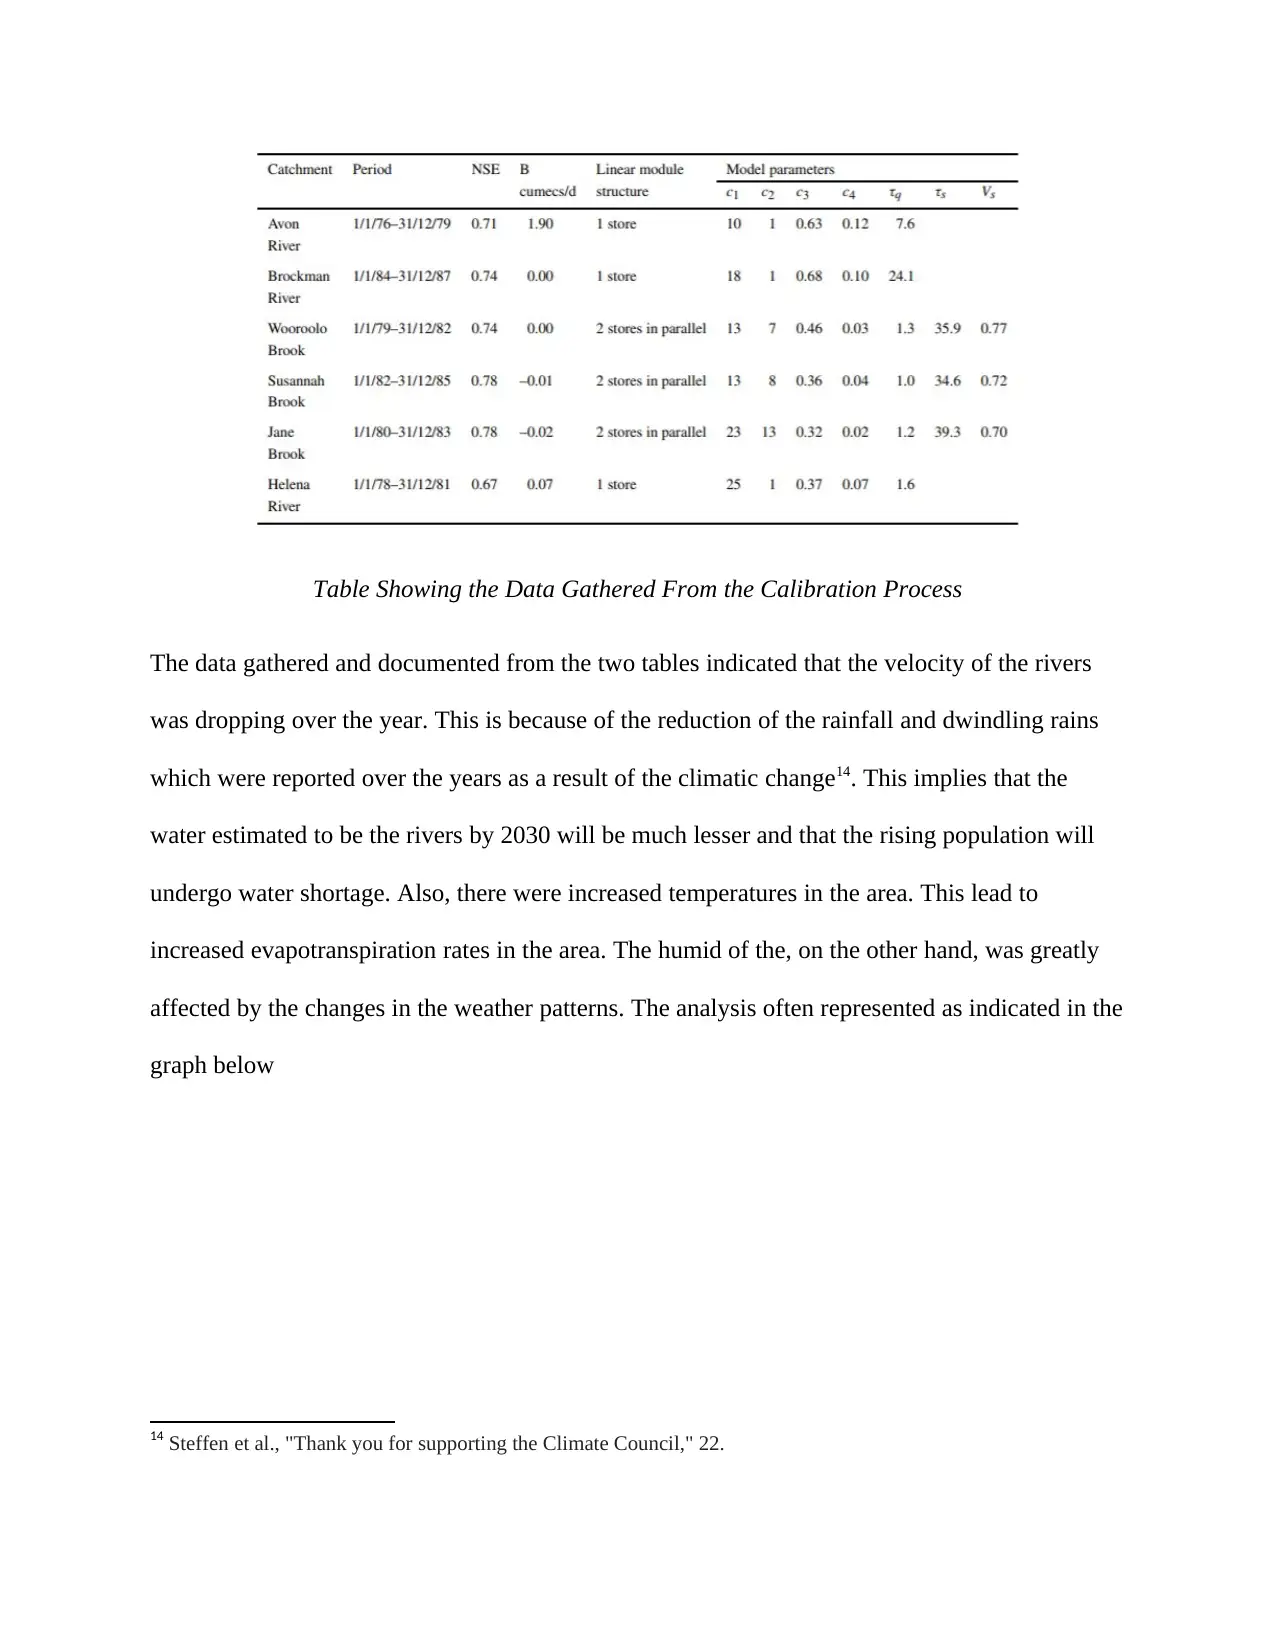
Table Showing the Data Gathered From the Calibration Process
The data gathered and documented from the two tables indicated that the velocity of the rivers
was dropping over the year. This is because of the reduction of the rainfall and dwindling rains
which were reported over the years as a result of the climatic change14. This implies that the
water estimated to be the rivers by 2030 will be much lesser and that the rising population will
undergo water shortage. Also, there were increased temperatures in the area. This lead to
increased evapotranspiration rates in the area. The humid of the, on the other hand, was greatly
affected by the changes in the weather patterns. The analysis often represented as indicated in the
graph below
14 Steffen et al., "Thank you for supporting the Climate Council," 22.
Paraphrase This Document
Need a fresh take? Get an instant paraphrase of this document with our AI Paraphraser
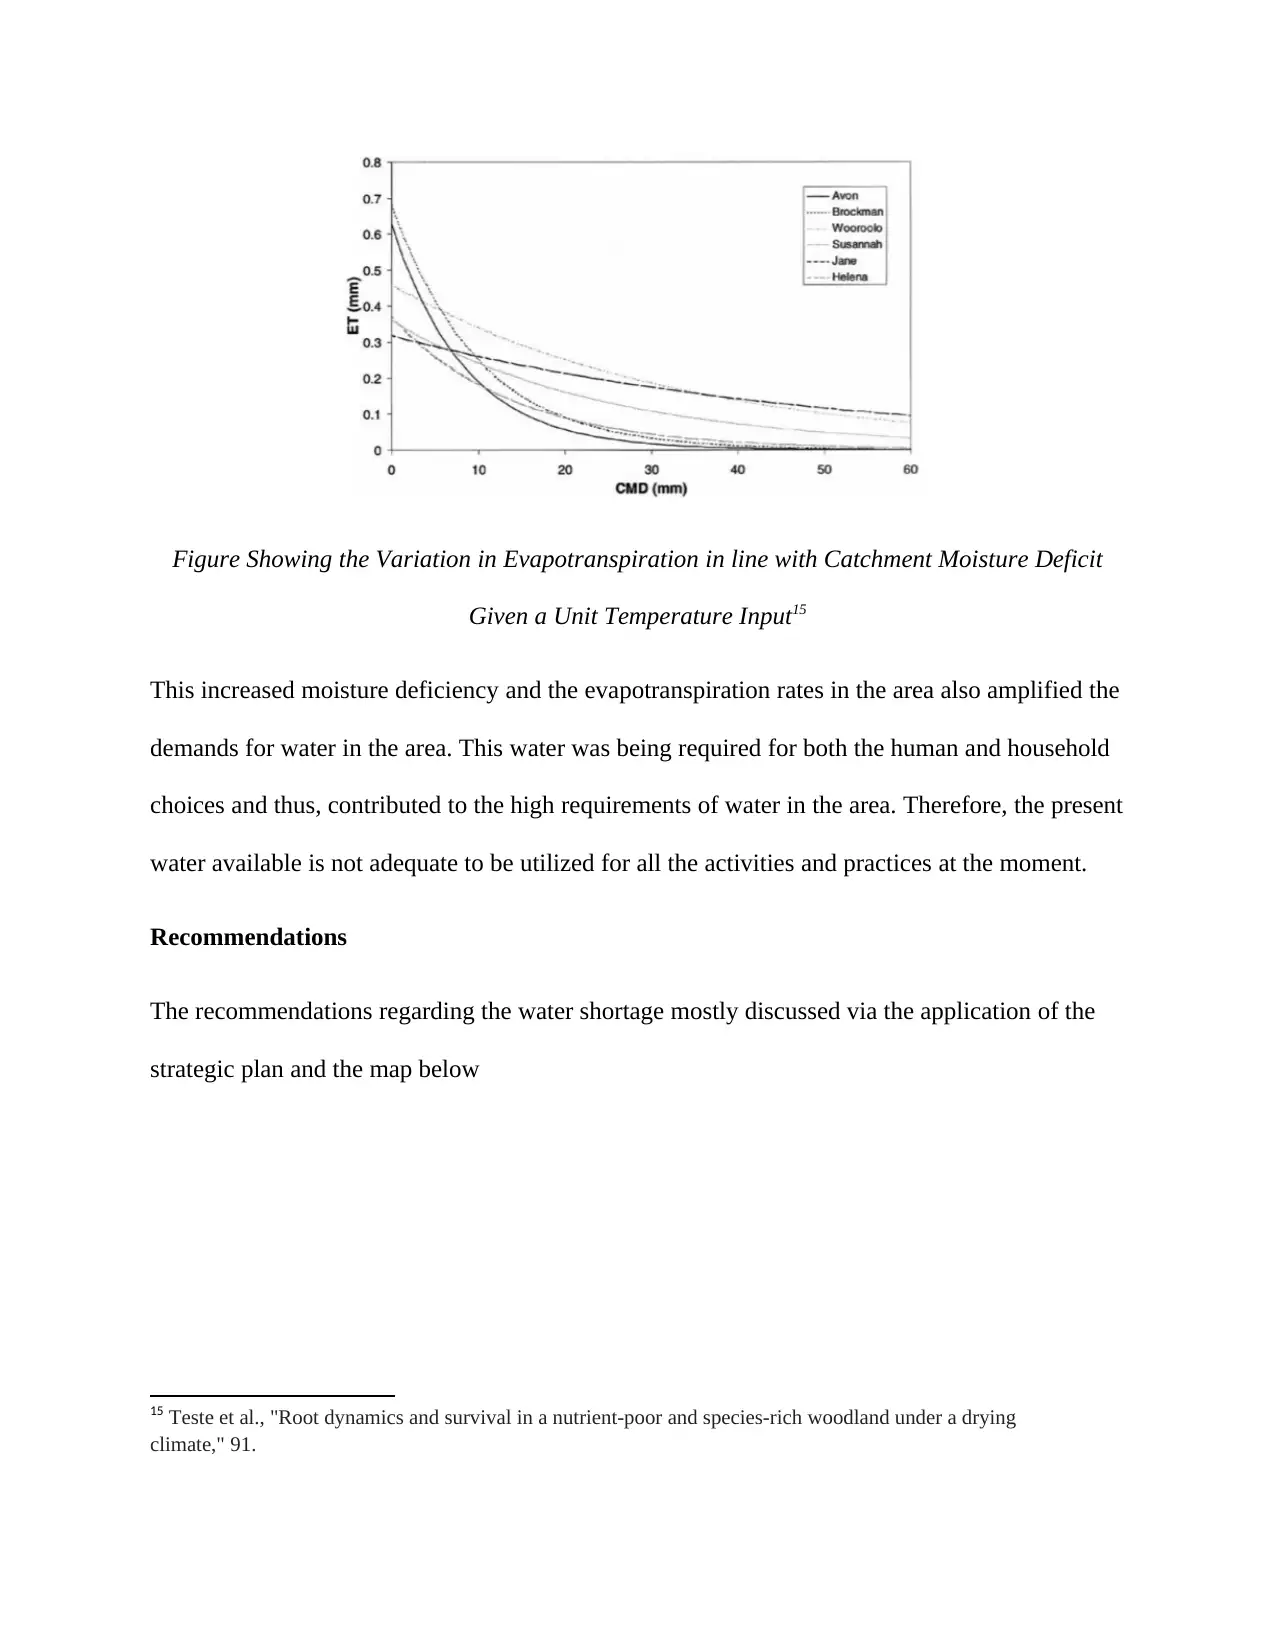
Figure Showing the Variation in Evapotranspiration in line with Catchment Moisture Deficit
Given a Unit Temperature Input15
This increased moisture deficiency and the evapotranspiration rates in the area also amplified the
demands for water in the area. This water was being required for both the human and household
choices and thus, contributed to the high requirements of water in the area. Therefore, the present
water available is not adequate to be utilized for all the activities and practices at the moment.
Recommendations
The recommendations regarding the water shortage mostly discussed via the application of the
strategic plan and the map below
15 Teste et al., "Root dynamics and survival in a nutrient-poor and species-rich woodland under a drying
climate," 91.

Figure Showing the Water Distribution16
Kwinana Industrial Strip is regarded as one of the major companies in the area and the zone as a whole.
The production from the company is often estimated to fetch at least $15.5 billion, and the value is
expected to increase, and the output estimate in terms of the rise is expected to be $28.3 billion. The
annual water usage in the industry is approximated at about 21 GI per year. The water is primarily
sourced from different sources such as scheme water, stormwater, groundwater as well as recycled
wastewater. Preferably, the analysis has indicated that the sewer will provide the best alternative in terms
of the water required to be utilized in the company and therefore, is currently being investigated.
Conclusion
The dwindling rainfall in Perth City caused by climate change is considered as the primary
contributor to the shortage of water in the region. In essence, the dwindling rain has affected and
16 Wardell‐Johnson et al., "Application of a Gondwanan perspective to restore ecological integrity in the south‐
western Australian global biodiversity hotspot," 805.
⊘ This is a preview!⊘
Do you want full access?
Subscribe today to unlock all pages.
Trusted by 1+ million students worldwide
1 out of 16
Related Documents


Your All-in-One AI-Powered Toolkit for Academic Success.
+13062052269
info@desklib.com
Available 24*7 on WhatsApp / Email
![[object Object]](/_next/static/media/star-bottom.7253800d.svg)
Unlock your academic potential
Copyright © 2020–2026 A2Z Services. All Rights Reserved. Developed and managed by ZUCOL.