Analysis and Recommendations for Pete's Cheap Car Sales Business
VerifiedAdded on 2023/06/05
|11
|1997
|378
Report
AI Summary
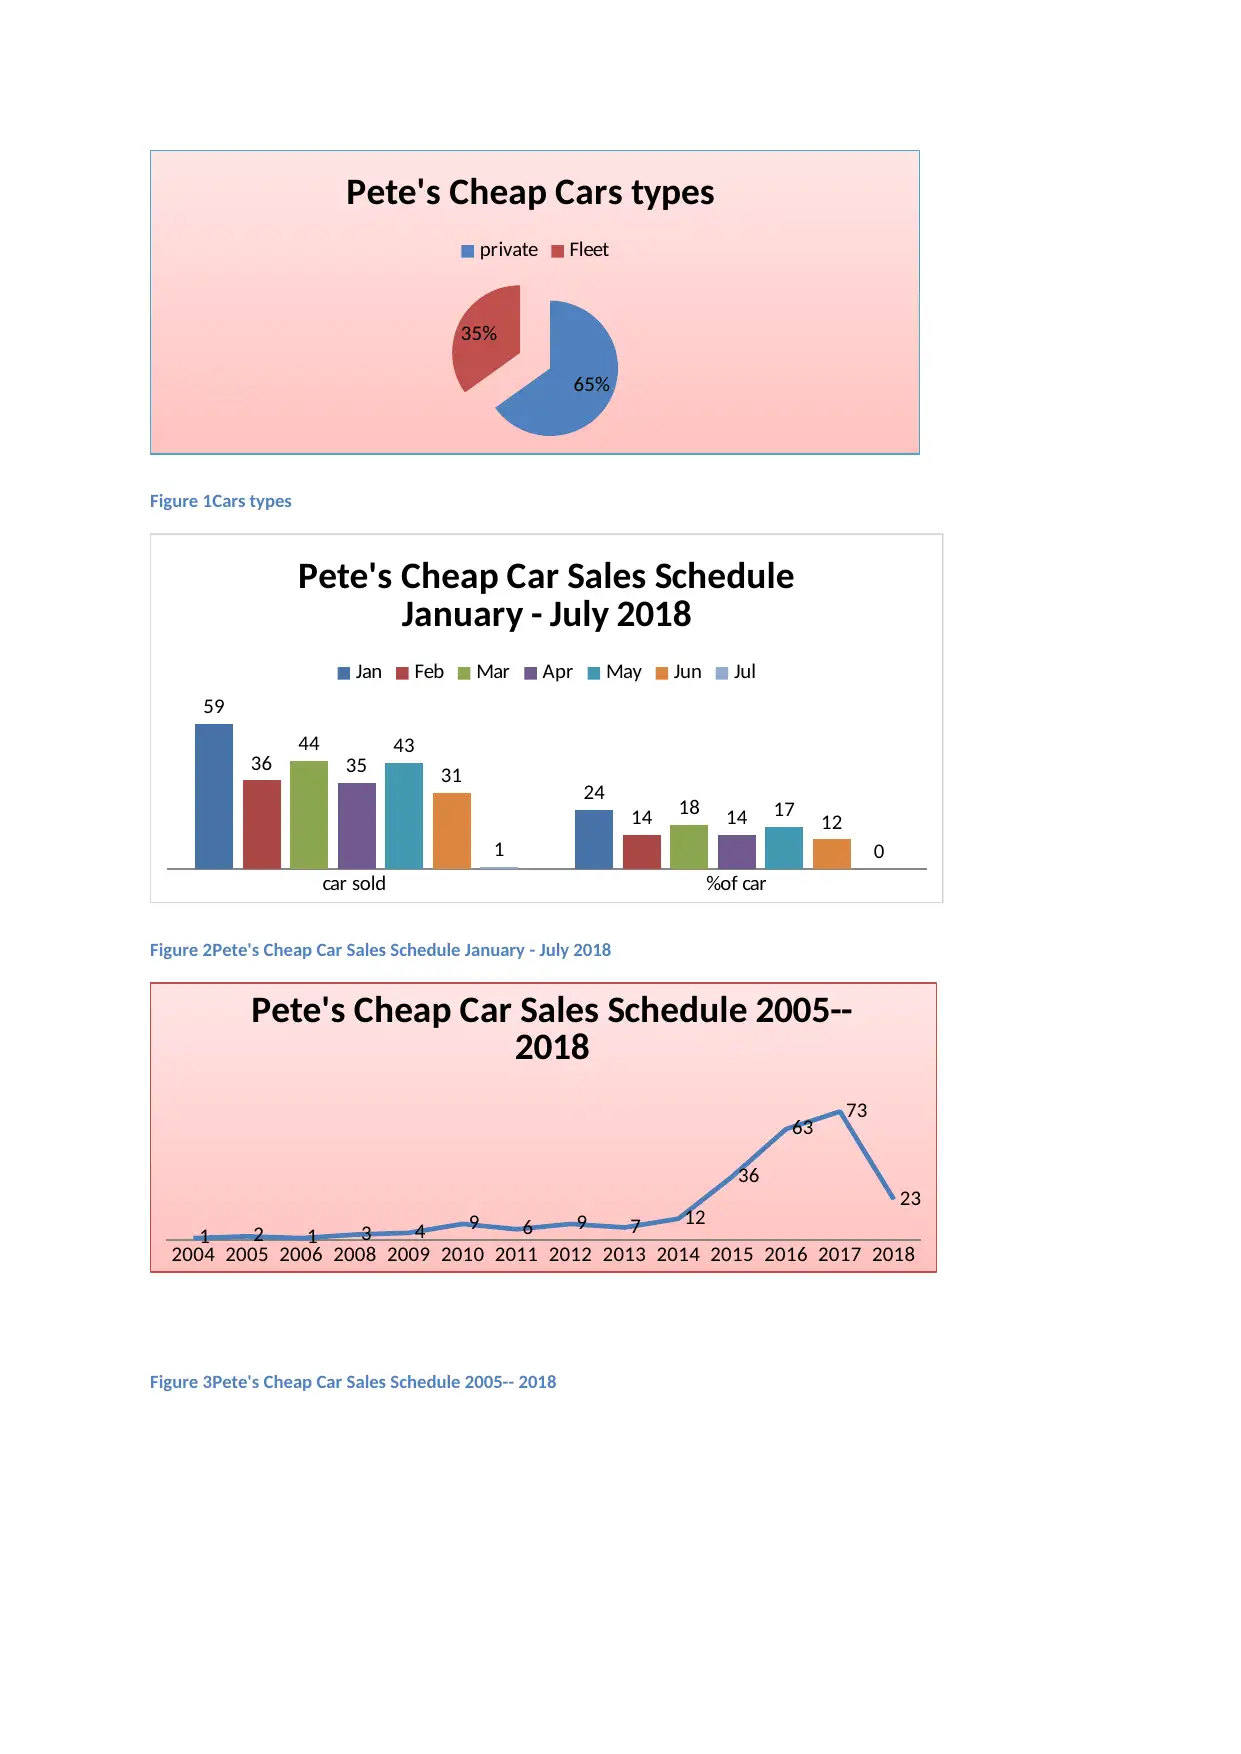
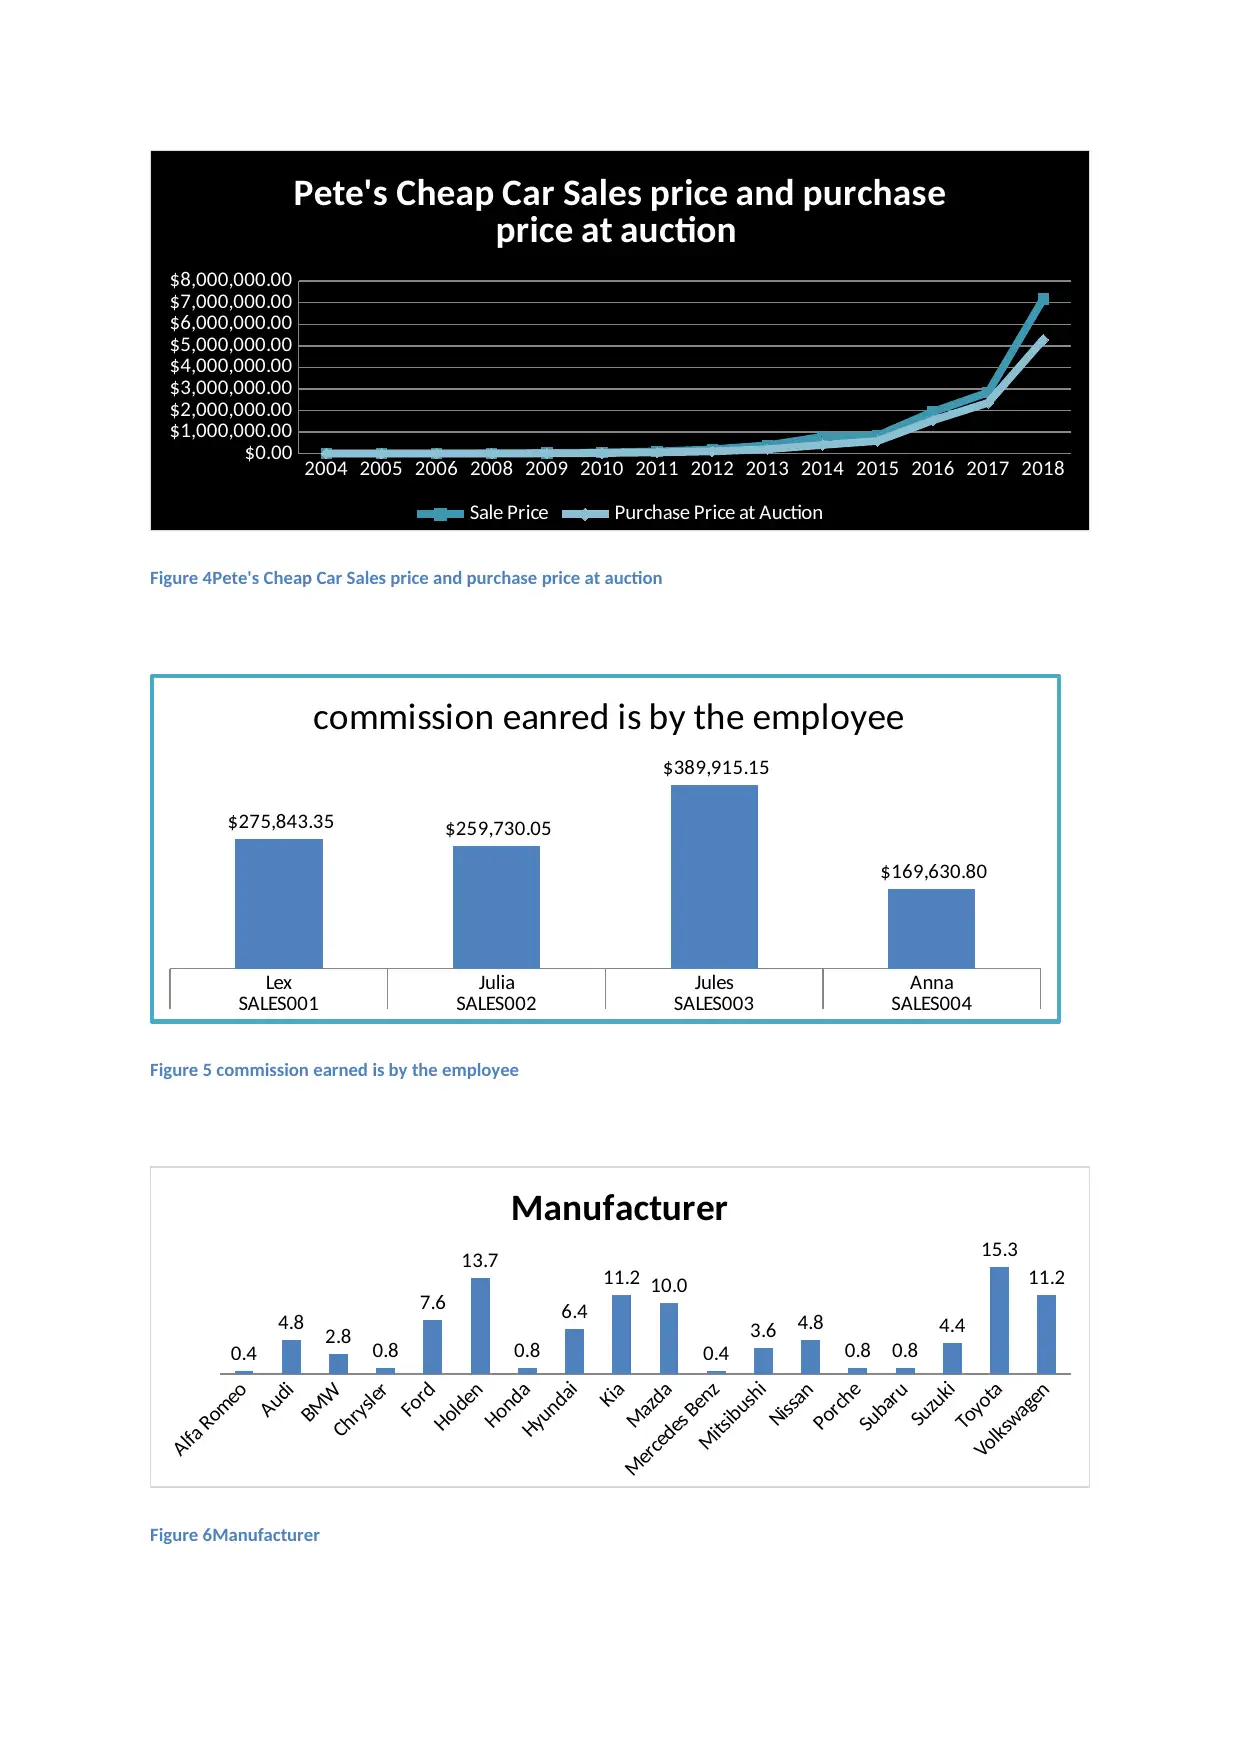
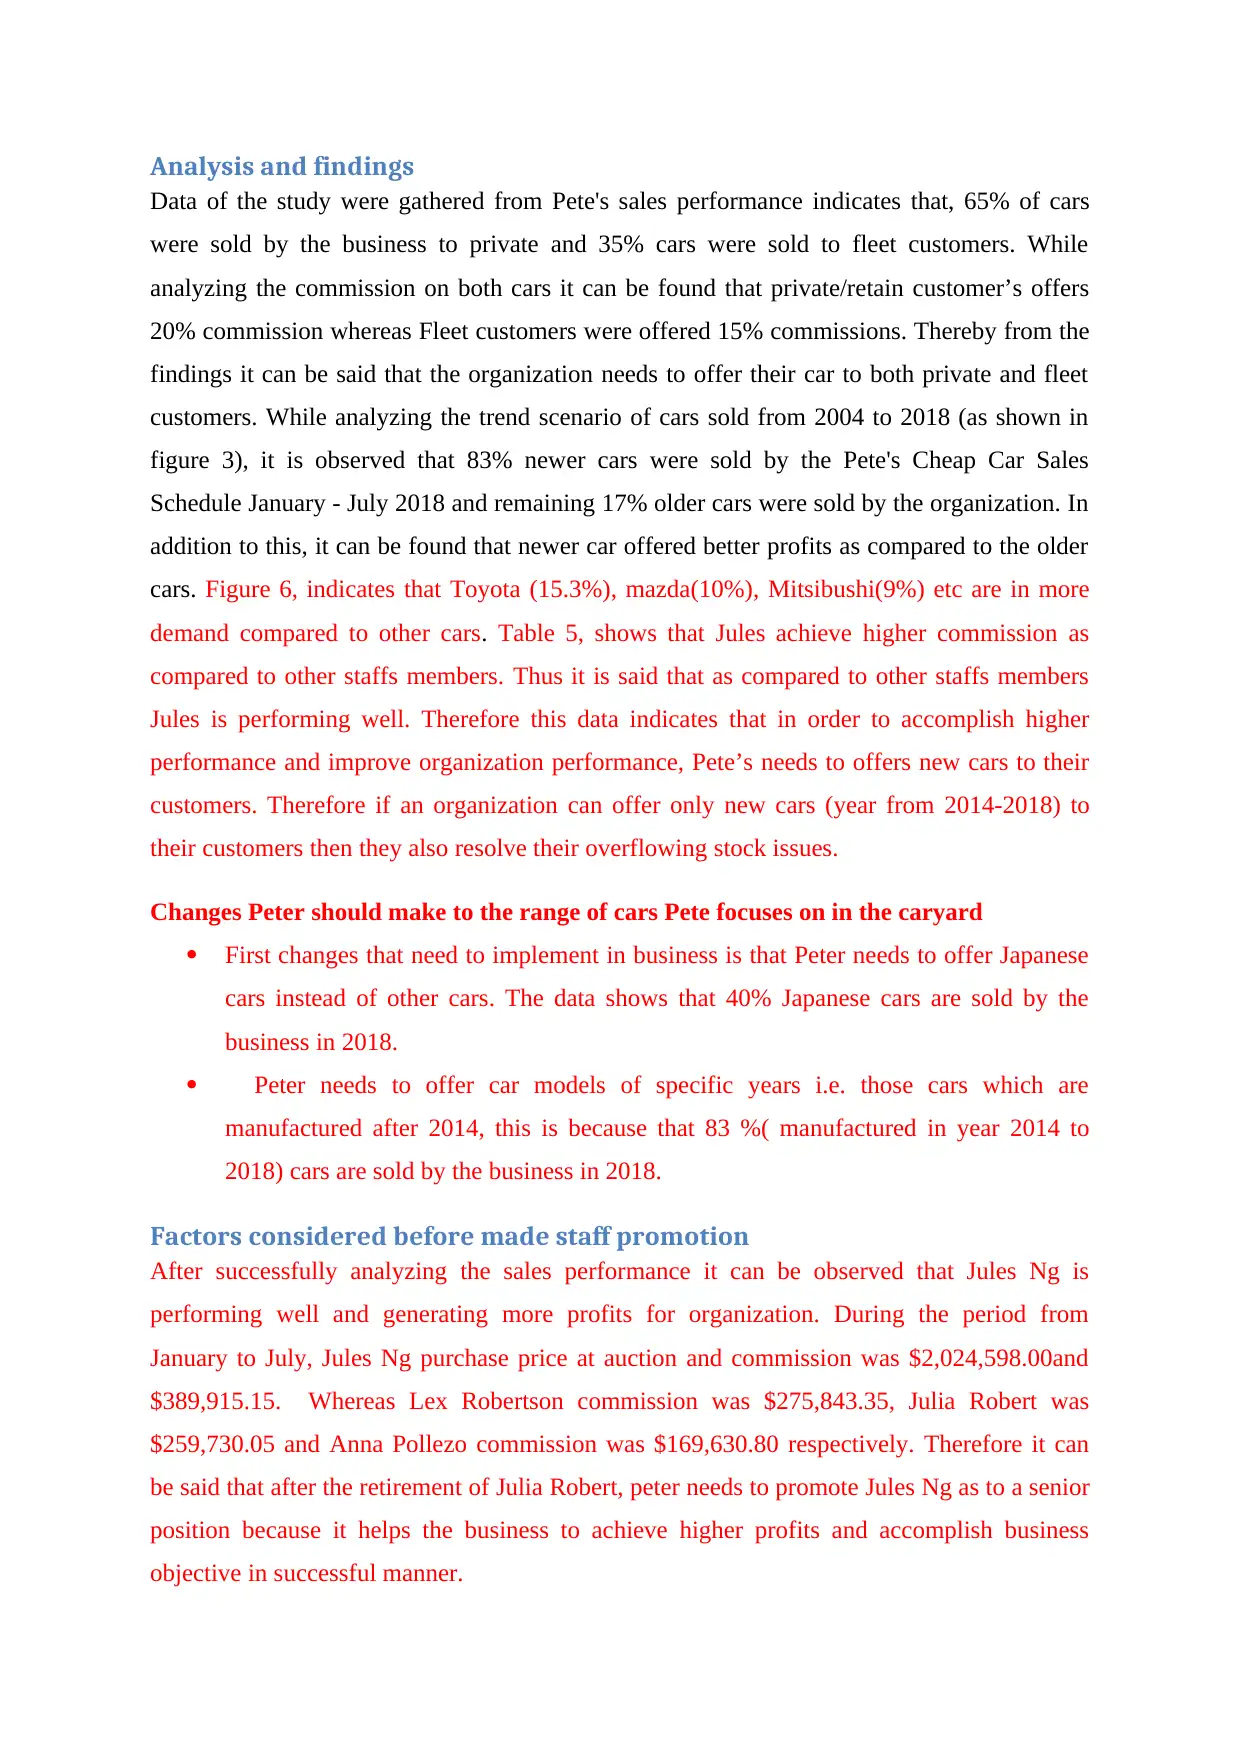
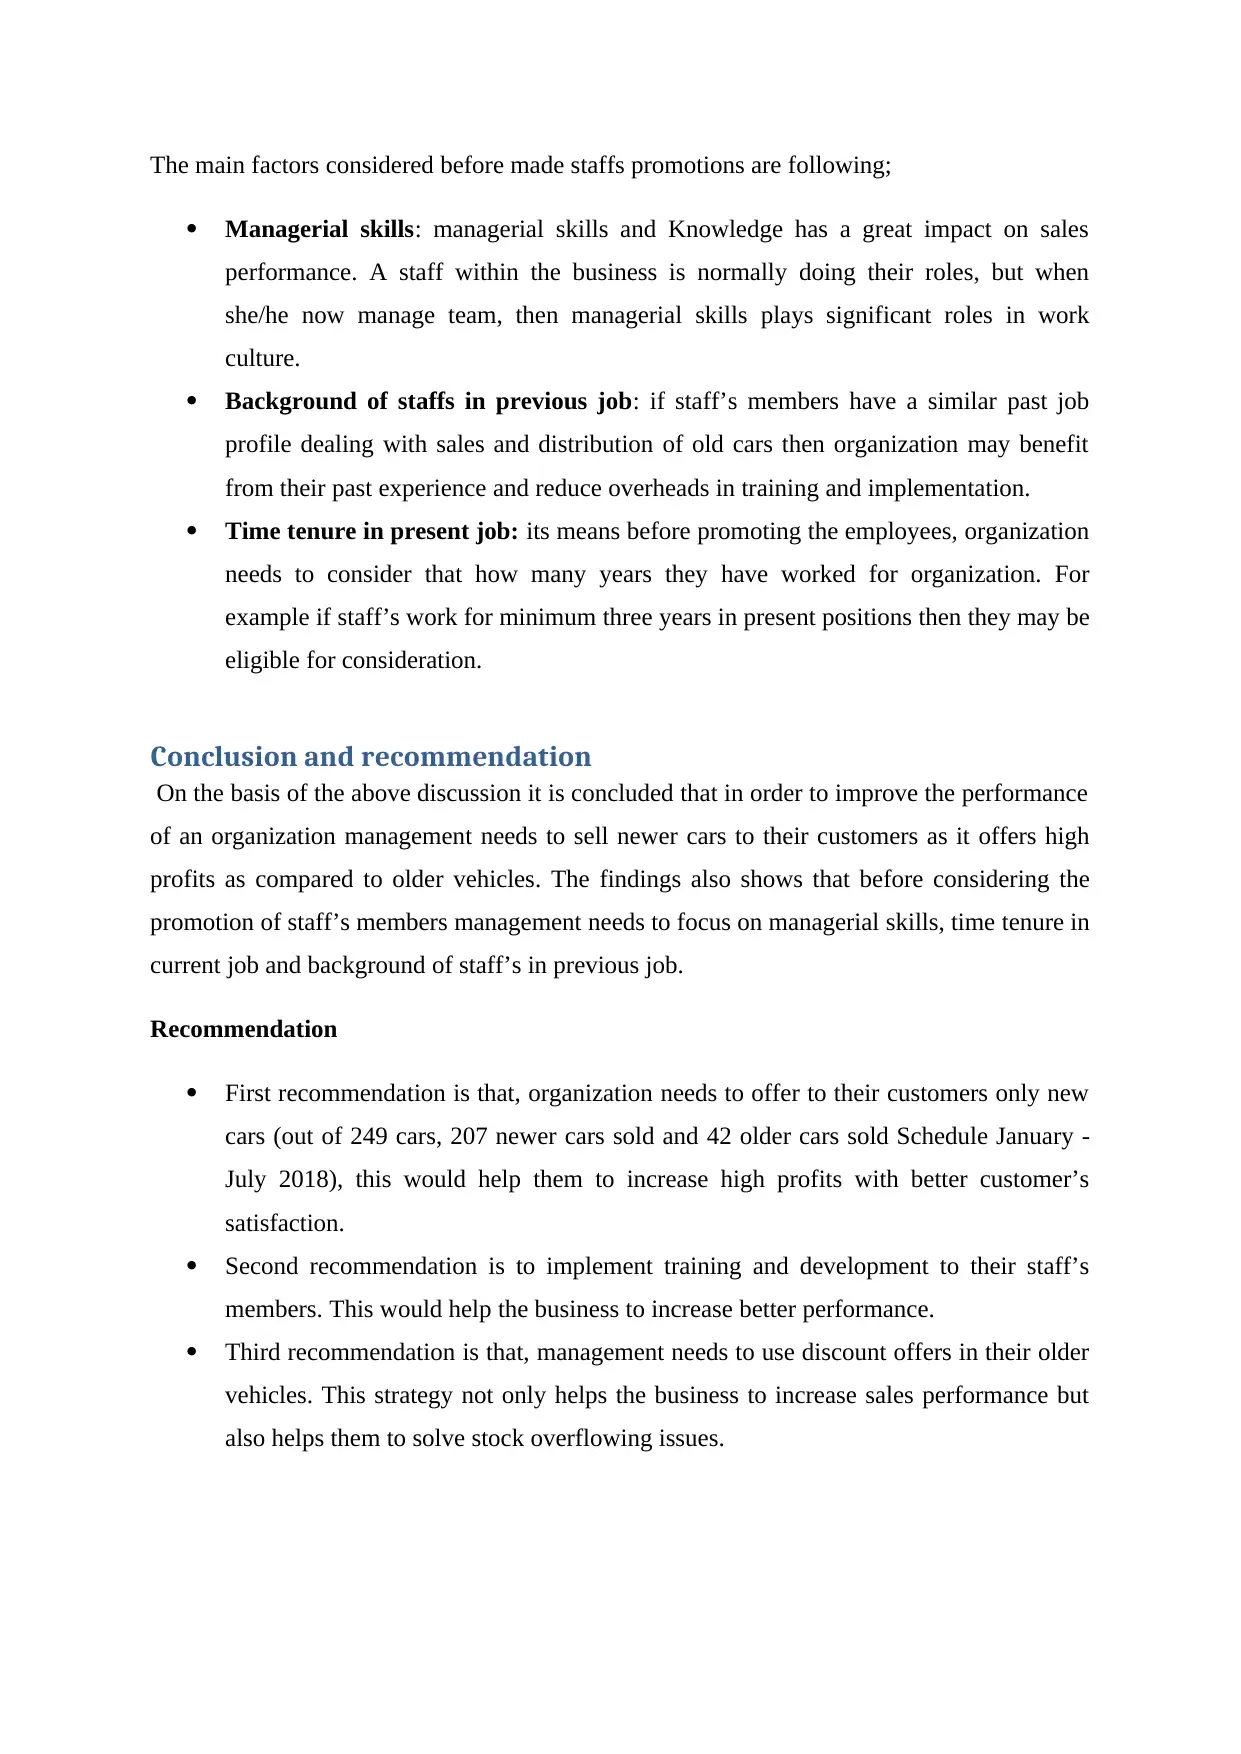
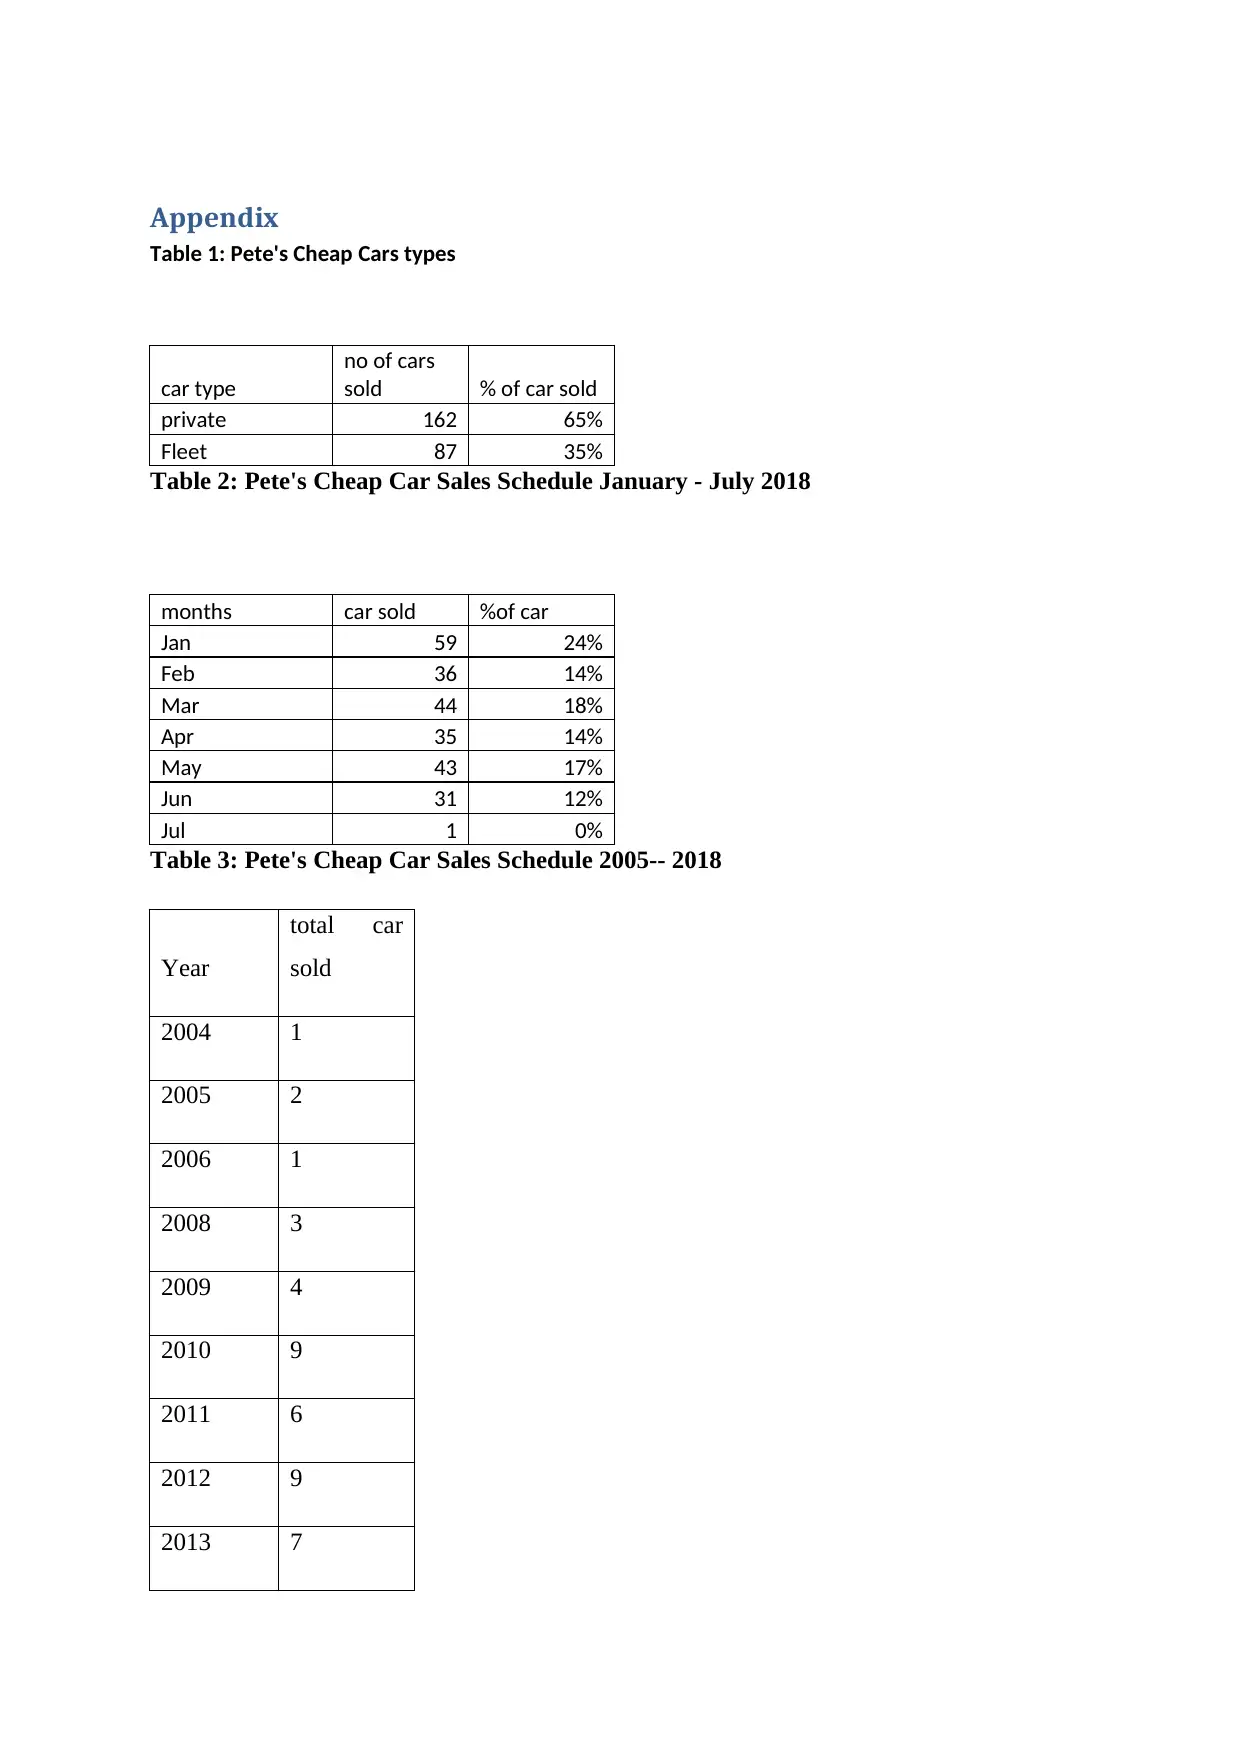
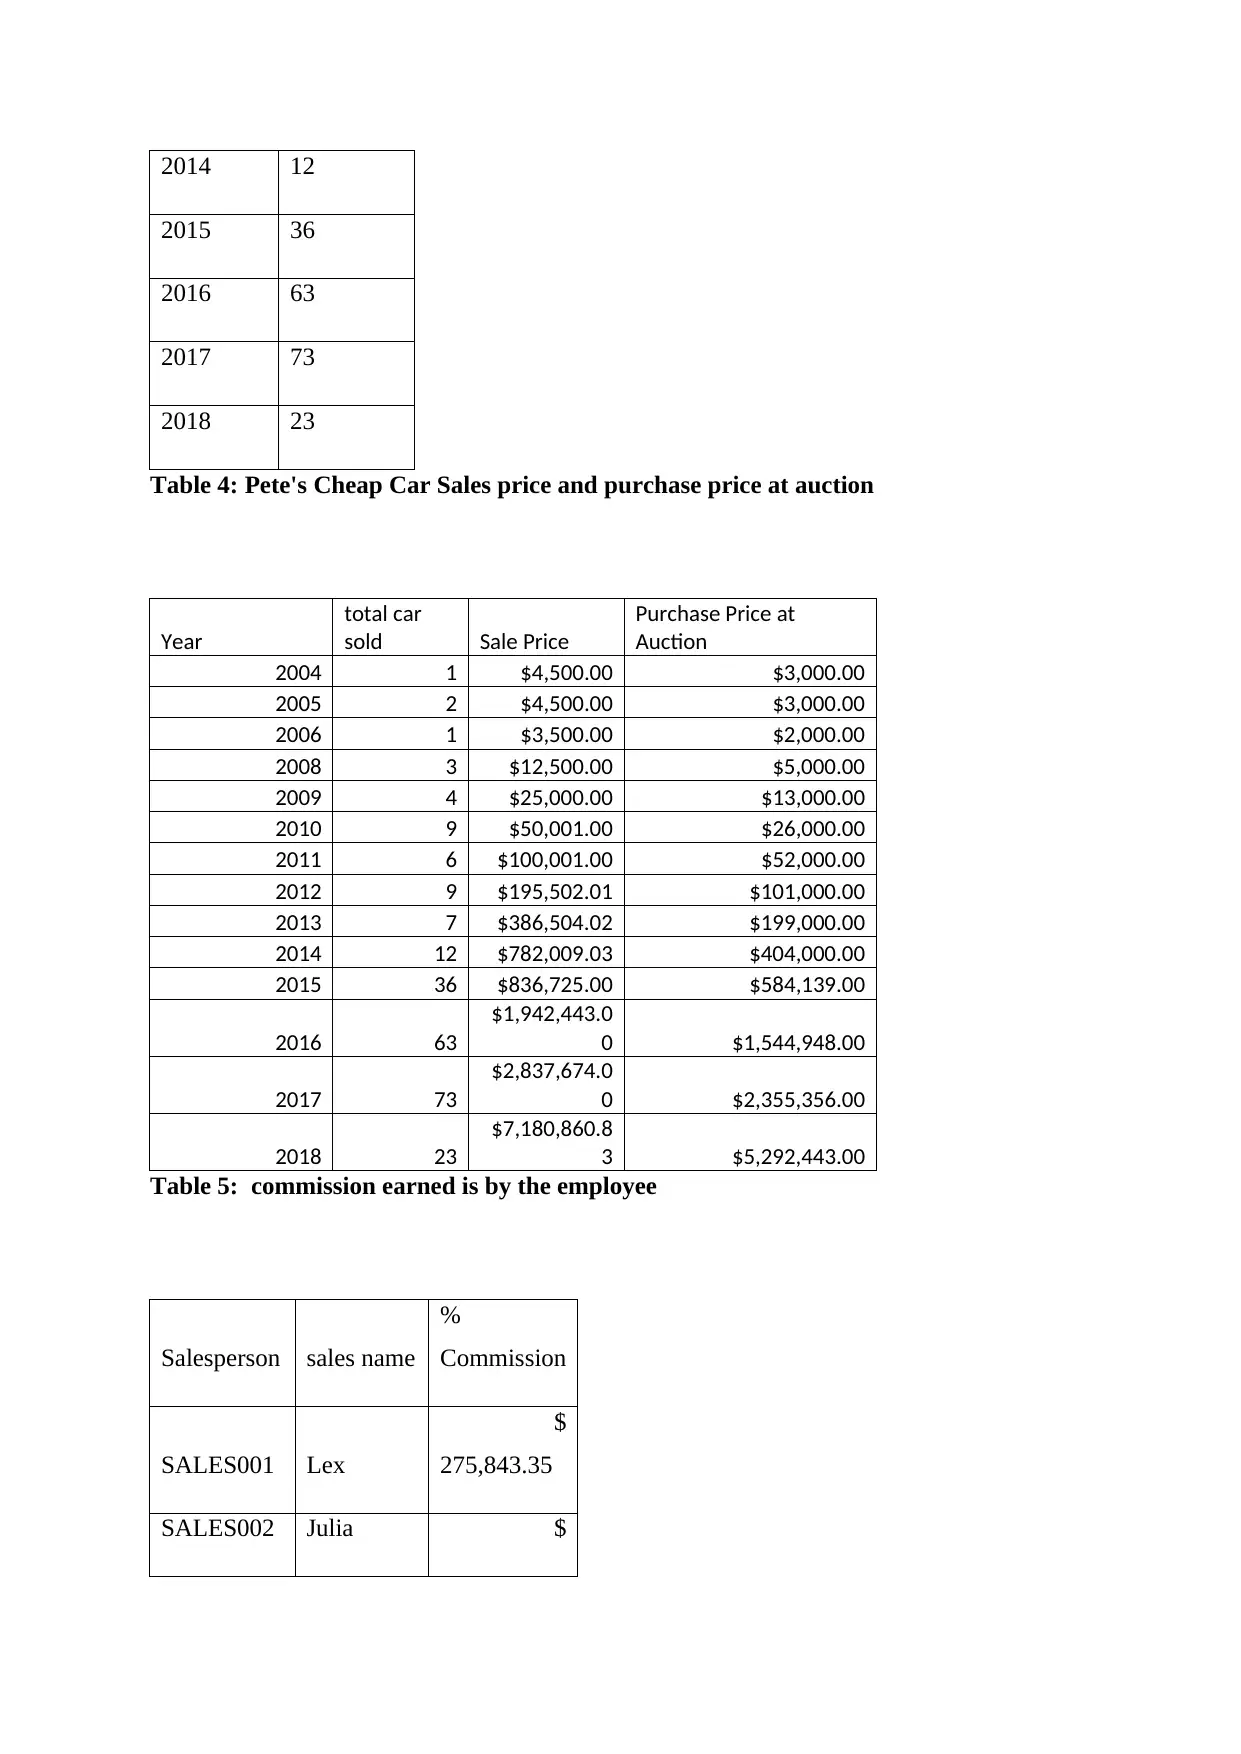
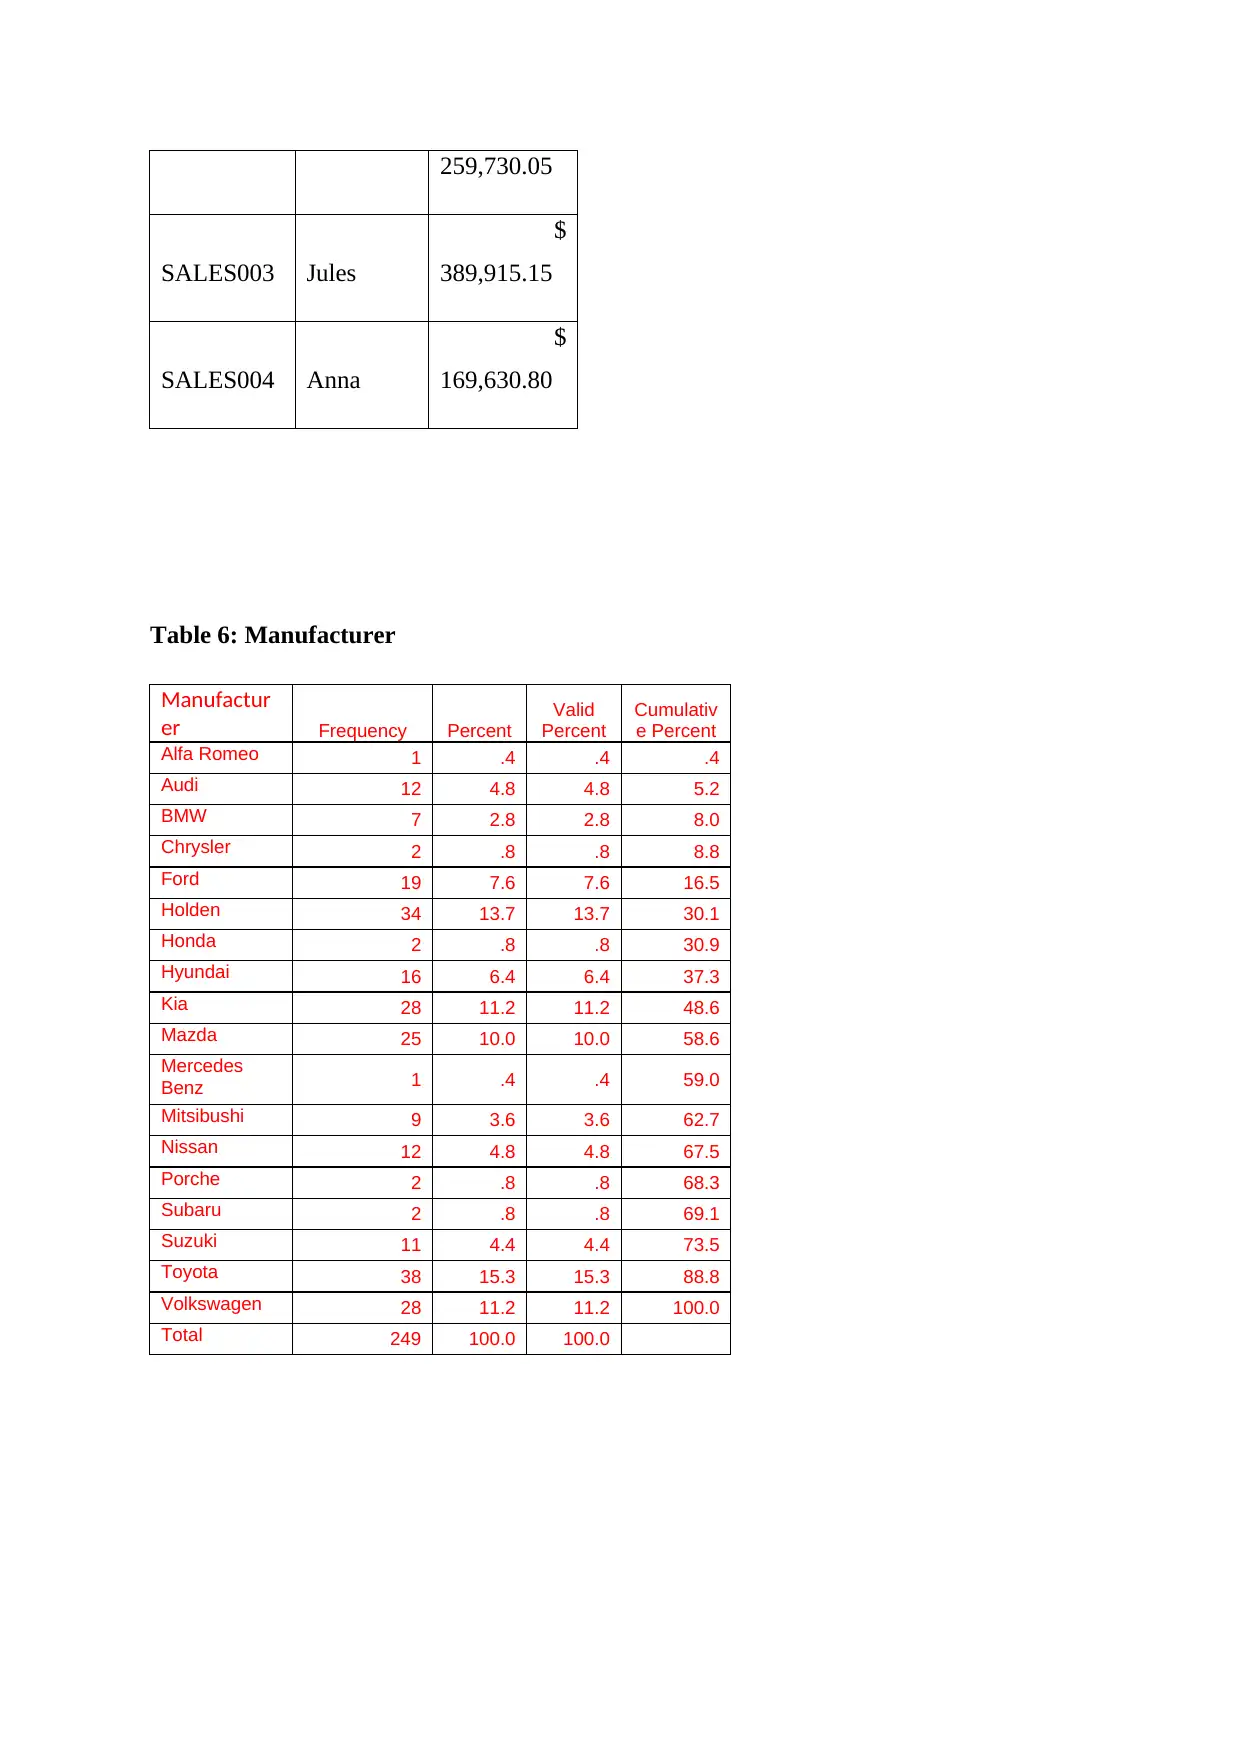
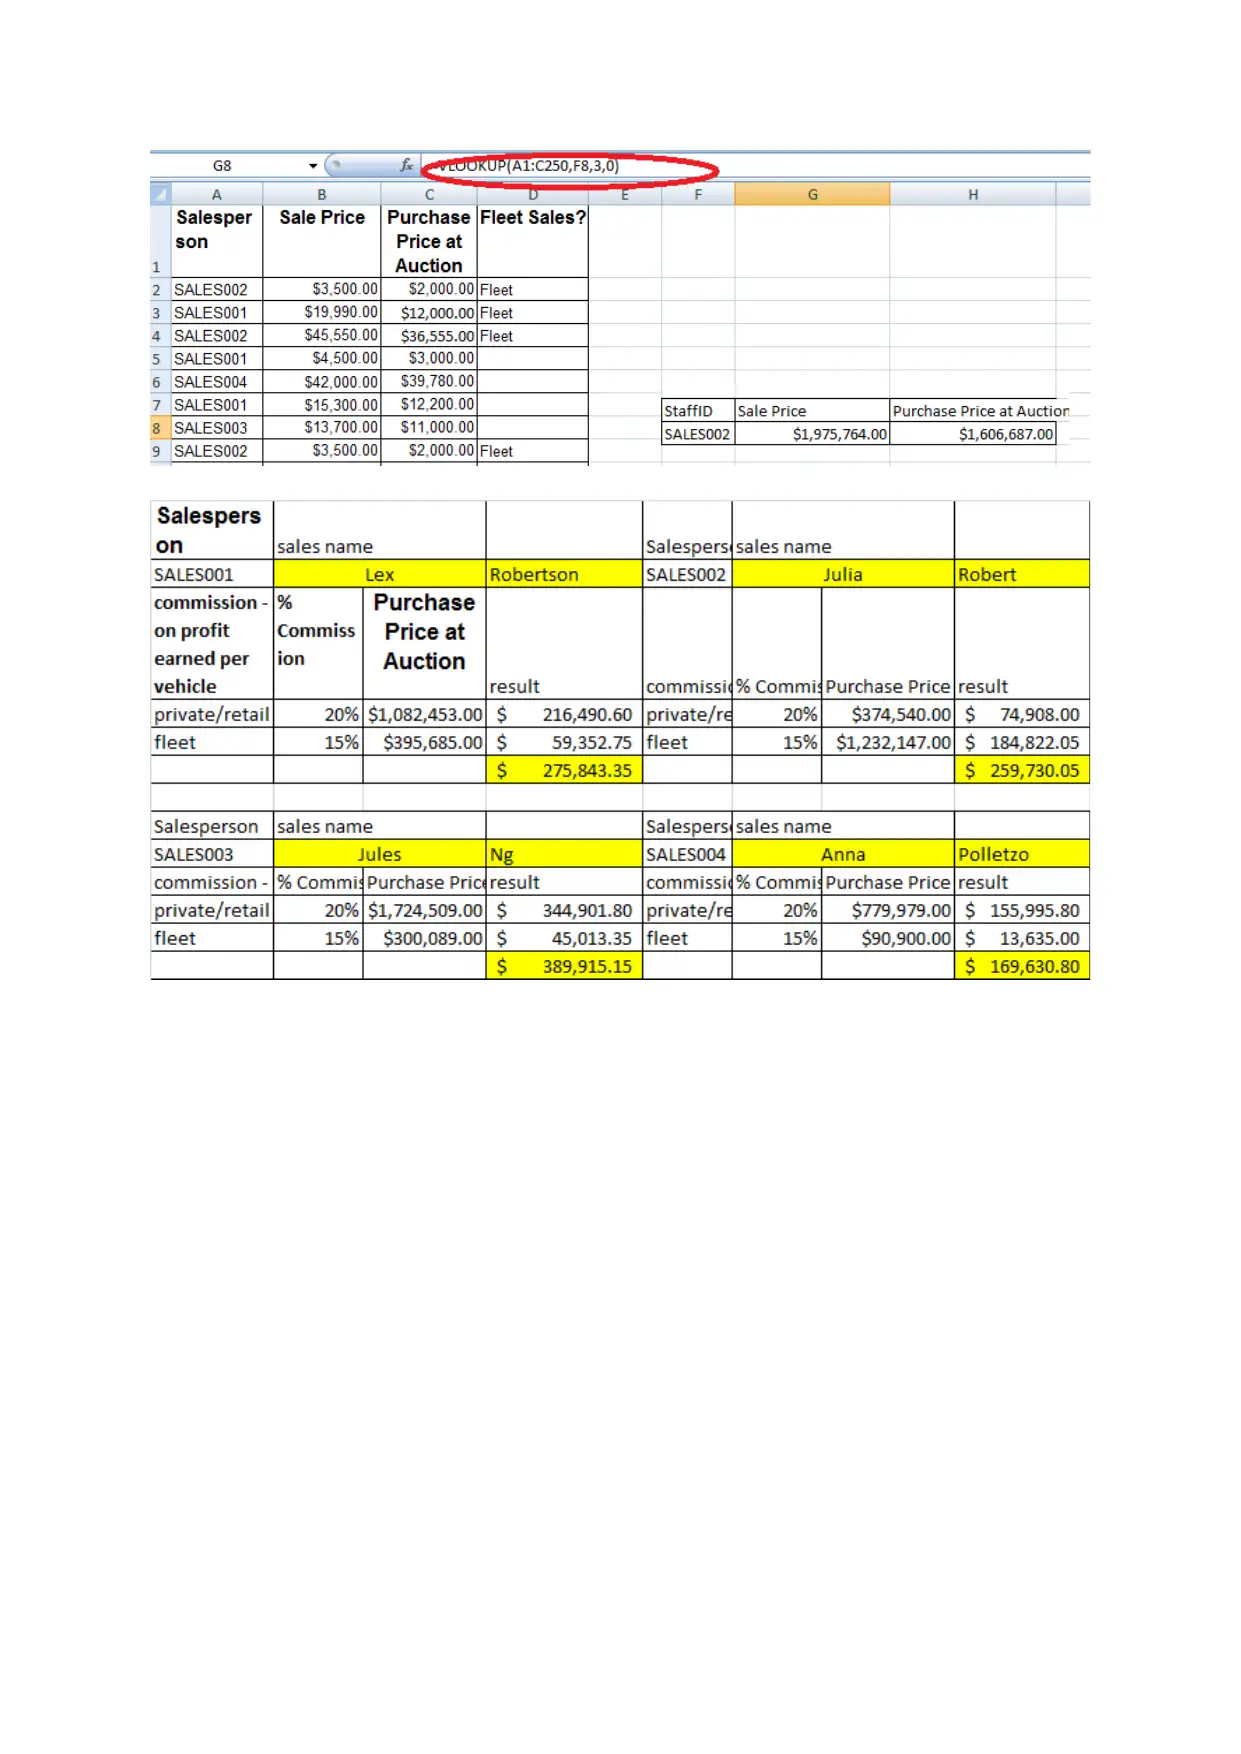
This report provides a detailed analysis of Pete's Cheap Car Sales, a used car resale business experiencing sales and stock overflow issues. The report identifies inappropriate planning strategies as a primary cause of declining sales performance. Data from January to July 2018 indicates that newer vehicles (83%) significantly outperform older vehicles (17%) in sales. The report highlights the importance of managerial skills, job tenure, and prior experience when considering staff promotions. Furthermore, it recommends training, development, and discount offers for older vehicles to boost sales. The analysis covers market trends, sales schedules, pricing, commission structures, and manufacturer preferences, offering specific recommendations for improving sales, managing inventory, and enhancing overall business performance. Key findings include the need to focus on newer car sales, especially Japanese models, and the importance of promoting top-performing staff like Jules Ng.

Executive summery
Pete’s Cheap Car Sales is presently experiencing sales and stock overflow issues. The impact
of sales issues also reduces the profitability of the business. The report shows that main
reason of degradation of the sales performance is inappropriate planning strategies. Data of
the study were gathered from Pete's sales performance indicates that during the period
January to July 2018, 83% newer vehicles sold remaining 17% older vehicles were sold by
business. The reports shows that before making decision to staffs promotion, Pete’s needs to
consider managerial skills, time tenure in current job and background of staff’s in previous
job. Training and development, discount offers in older vehicles helps the business to
increase sales performance.
Paraphrase This Document
Need a fresh take? Get an instant paraphrase of this document with our AI Paraphraser

Table of Contents
Executive summery...............................................................................................................................1
Introduction...........................................................................................................................................3
Objective and scope of the study:.....................................................................................................3
Body......................................................................................................................................................3
Presentation of the analysis..............................................................................................................3
Analysis and findings.........................................................................................................................7
Factors considered before made staff promotion.............................................................................8
Conclusion and recommendation..........................................................................................................8
Appendix.............................................................................................................................................10
List of figures
Figure 1Cars types.................................................................................................................................4
Figure 2Pete's Cheap Car Sales Schedule January - July 2018................................................................5
Figure 3Pete's Cheap Car Sales Schedule 2005-- 2018..........................................................................6
Figure 4Pete's Cheap Car Sales price and purchase price at auction.....................................................7
Figure 5 commission earned is by the employee...................................................................................7
Figure 6Manufacturer...........................................................................................................................8

Introduction
‘Pete’s Cheap Car Sales’is based on the re-sale of used car which is operated Victoria.Peter,
from yards at Melbourne and Alan Moffet. The main objective of this business is to
accomplish higher profits and offer services to customers at competitive low price rate.
Presently the business suffered from the profits issues and stock overflowing issues.
Therefore the present report is aimed at identifying the strategies and techniques organization
needs to enhance its performance and accomplish more profits. In addition to this, present
report also offers the recommendation regarding business enhancement.
Objective and scope of the study:
The main objective of this study is to provide better strategies to improve organization sales
performance and profitability.
Successful completion of the report helps the primary groups that may benefit from this
study. The group includes the management of the organization, may learn to determine the
way that insufficient sales strategies impact their work performance. Determining the
negative impact may help them to make necessary action to cope with insufficient sales
strategies.
Body
Market trends are defined as the increased demands from consumers and similarities of
services and products offers among the providers acting on market. As an outcome, market
trends helps the organization to establish strategies in order to develop and create a
competitive benefits, which successfully lead that the business. This will enhance sales or
offers services and products in more successful manner than its competitors.
Presentation of the analysis
⊘ This is a preview!⊘
Do you want full access?
Subscribe today to unlock all pages.

Trusted by 1+ million students worldwide

65%
35%
Pete's Cheap Cars types
private Fleet
Figure 1Cars types
car sold %of car
59
24
36
14
44
18
35
14
43
17
31
12
1 0
Pete's Cheap Car Sales Schedule
January - July 2018
Jan Feb Mar Apr May Jun Jul
Figure 2Pete's Cheap Car Sales Schedule January - July 2018
2004 2005 2006 2008 2009 2010 2011 2012 2013 2014 2015 2016 2017 2018
1 2 1 3 4 9 6 9 7 12
36
63 73
23
Pete's Cheap Car Sales Schedule 2005--
2018
Figure 3Pete's Cheap Car Sales Schedule 2005-- 2018
Paraphrase This Document
Need a fresh take? Get an instant paraphrase of this document with our AI Paraphraser

2004 2005 2006 2008 2009 2010 2011 2012 2013 2014 2015 2016 2017 2018
$0.00
$1,000,000.00
$2,000,000.00
$3,000,000.00
$4,000,000.00
$5,000,000.00
$6,000,000.00
$7,000,000.00
$8,000,000.00
Pete's Cheap Car Sales price and purchase
price at auction
Sale Price Purchase Price at Auction
Figure 4Pete's Cheap Car Sales price and purchase price at auction
Lex Julia Jules Anna
SALES001 SALES002 SALES003 SALES004
$275,843.35 $259,730.05
$389,915.15
$169,630.80
commission eanred is by the employee
Figure 5 commission earned is by the employee
Alfa Romeo
Audi
BMW
Chrysler
Ford
Holden
Honda
Hyundai
Kia
Mazda
Mercedes Benz
Mitsibushi
Nissan
Porche
Subaru
Suzuki
Toyota
Volkswagen
0.4
4.8 2.8 0.8
7.6
13.7
0.8
6.4
11.2 10.0
0.4
3.6 4.8
0.8 0.8
4.4
15.3
11.2
Manufacturer
Figure 6Manufacturer

Analysis and findings
Data of the study were gathered from Pete's sales performance indicates that, 65% of cars
were sold by the business to private and 35% cars were sold to fleet customers. While
analyzing the commission on both cars it can be found that private/retain customer’s offers
20% commission whereas Fleet customers were offered 15% commissions. Thereby from the
findings it can be said that the organization needs to offer their car to both private and fleet
customers. While analyzing the trend scenario of cars sold from 2004 to 2018 (as shown in
figure 3), it is observed that 83% newer cars were sold by the Pete's Cheap Car Sales
Schedule January - July 2018 and remaining 17% older cars were sold by the organization. In
addition to this, it can be found that newer car offered better profits as compared to the older
cars. Figure 6, indicates that Toyota (15.3%), mazda(10%), Mitsibushi(9%) etc are in more
demand compared to other cars. Table 5, shows that Jules achieve higher commission as
compared to other staffs members. Thus it is said that as compared to other staffs members
Jules is performing well. Therefore this data indicates that in order to accomplish higher
performance and improve organization performance, Pete’s needs to offers new cars to their
customers. Therefore if an organization can offer only new cars (year from 2014-2018) to
their customers then they also resolve their overflowing stock issues.
Changes Peter should make to the range of cars Pete focuses on in the caryard
First changes that need to implement in business is that Peter needs to offer Japanese
cars instead of other cars. The data shows that 40% Japanese cars are sold by the
business in 2018.
Peter needs to offer car models of specific years i.e. those cars which are
manufactured after 2014, this is because that 83 %( manufactured in year 2014 to
2018) cars are sold by the business in 2018.
Factors considered before made staff promotion
After successfully analyzing the sales performance it can be observed that Jules Ng is
performing well and generating more profits for organization. During the period from
January to July, Jules Ng purchase price at auction and commission was $2,024,598.00and
$389,915.15. Whereas Lex Robertson commission was $275,843.35, Julia Robert was
$259,730.05 and Anna Pollezo commission was $169,630.80 respectively. Therefore it can
be said that after the retirement of Julia Robert, peter needs to promote Jules Ng as to a senior
position because it helps the business to achieve higher profits and accomplish business
objective in successful manner.
⊘ This is a preview!⊘
Do you want full access?
Subscribe today to unlock all pages.

Trusted by 1+ million students worldwide

The main factors considered before made staffs promotions are following;
Managerial skills: managerial skills and Knowledge has a great impact on sales
performance. A staff within the business is normally doing their roles, but when
she/he now manage team, then managerial skills plays significant roles in work
culture.
Background of staffs in previous job: if staff’s members have a similar past job
profile dealing with sales and distribution of old cars then organization may benefit
from their past experience and reduce overheads in training and implementation.
Time tenure in present job: its means before promoting the employees, organization
needs to consider that how many years they have worked for organization. For
example if staff’s work for minimum three years in present positions then they may be
eligible for consideration.
Conclusion and recommendation
On the basis of the above discussion it is concluded that in order to improve the performance
of an organization management needs to sell newer cars to their customers as it offers high
profits as compared to older vehicles. The findings also shows that before considering the
promotion of staff’s members management needs to focus on managerial skills, time tenure in
current job and background of staff’s in previous job.
Recommendation
First recommendation is that, organization needs to offer to their customers only new
cars (out of 249 cars, 207 newer cars sold and 42 older cars sold Schedule January -
July 2018), this would help them to increase high profits with better customer’s
satisfaction.
Second recommendation is to implement training and development to their staff’s
members. This would help the business to increase better performance.
Third recommendation is that, management needs to use discount offers in their older
vehicles. This strategy not only helps the business to increase sales performance but
also helps them to solve stock overflowing issues.
Paraphrase This Document
Need a fresh take? Get an instant paraphrase of this document with our AI Paraphraser

Appendix
Table 1: Pete's Cheap Cars types
car type
no of cars
sold % of car sold
private 162 65%
Fleet 87 35%
Table 2: Pete's Cheap Car Sales Schedule January - July 2018
months car sold %of car
Jan 59 24%
Feb 36 14%
Mar 44 18%
Apr 35 14%
May 43 17%
Jun 31 12%
Jul 1 0%
Table 3: Pete's Cheap Car Sales Schedule 2005-- 2018
Year
total car
sold
2004 1
2005 2
2006 1
2008 3
2009 4
2010 9
2011 6
2012 9
2013 7

2014 12
2015 36
2016 63
2017 73
2018 23
Table 4: Pete's Cheap Car Sales price and purchase price at auction
Year
total car
sold Sale Price
Purchase Price at
Auction
2004 1 $4,500.00 $3,000.00
2005 2 $4,500.00 $3,000.00
2006 1 $3,500.00 $2,000.00
2008 3 $12,500.00 $5,000.00
2009 4 $25,000.00 $13,000.00
2010 9 $50,001.00 $26,000.00
2011 6 $100,001.00 $52,000.00
2012 9 $195,502.01 $101,000.00
2013 7 $386,504.02 $199,000.00
2014 12 $782,009.03 $404,000.00
2015 36 $836,725.00 $584,139.00
2016 63
$1,942,443.0
0 $1,544,948.00
2017 73
$2,837,674.0
0 $2,355,356.00
2018 23
$7,180,860.8
3 $5,292,443.00
Table 5: commission earned is by the employee
Salesperson sales name
%
Commission
SALES001 Lex
$
275,843.35
SALES002 Julia $
⊘ This is a preview!⊘
Do you want full access?
Subscribe today to unlock all pages.

Trusted by 1+ million students worldwide

259,730.05
SALES003 Jules
$
389,915.15
SALES004 Anna
$
169,630.80
Table 6: Manufacturer
Manufactur
er Frequency Percent
Valid
Percent
Cumulativ
e Percent
Alfa Romeo 1 .4 .4 .4
Audi 12 4.8 4.8 5.2
BMW 7 2.8 2.8 8.0
Chrysler 2 .8 .8 8.8
Ford 19 7.6 7.6 16.5
Holden 34 13.7 13.7 30.1
Honda 2 .8 .8 30.9
Hyundai 16 6.4 6.4 37.3
Kia 28 11.2 11.2 48.6
Mazda 25 10.0 10.0 58.6
Mercedes
Benz 1 .4 .4 59.0
Mitsibushi 9 3.6 3.6 62.7
Nissan 12 4.8 4.8 67.5
Porche 2 .8 .8 68.3
Subaru 2 .8 .8 69.1
Suzuki 11 4.4 4.4 73.5
Toyota 38 15.3 15.3 88.8
Volkswagen 28 11.2 11.2 100.0
Total 249 100.0 100.0
Paraphrase This Document
Need a fresh take? Get an instant paraphrase of this document with our AI Paraphraser

1 out of 11
Related Documents
Your All-in-One AI-Powered Toolkit for Academic Success.
+13062052269
info@desklib.com
Available 24*7 on WhatsApp / Email
Unlock your academic potential
Copyright © 2020–2026 A2Z Services. All Rights Reserved. Developed and managed by ZUCOL.


