Individual Assignment Report: PetroChina for Non-Financial Directors
VerifiedAdded on 2021/02/22
|19
|4532
|68
Report
AI Summary
This individual assignment report analyzes the financial performance of PetroChina, a state-owned energy giant, focusing on key financial ratios such as liquidity, solvency, profitability, and performance. The report compares PetroChina's performance with its peer, SINOPEC, and examines trends from 2015 to 2016. It delves into the company's challenges, including declining profits and stock performance, and explores the impact of the 2007/2008 financial crisis. The report also discusses the role of independent audits, audit expectations, and the assurance they provide. Furthermore, it provides insights into the global effects of the financial crisis and lessons learned by PetroChina. The report is structured into three parts: ratio analysis, independent audit, and the financial crisis, offering a comprehensive view of PetroChina's financial health and strategic considerations.
Individual Assignment Report to the
Non-Financial Directors of PetroChina
Name:
P Number:
Module Code: ACFI3424
Word Count: 2997
Non-Financial Directors of PetroChina
Name:
P Number:
Module Code: ACFI3424
Word Count: 2997
Paraphrase This Document
Need a fresh take? Get an instant paraphrase of this document with our AI Paraphraser
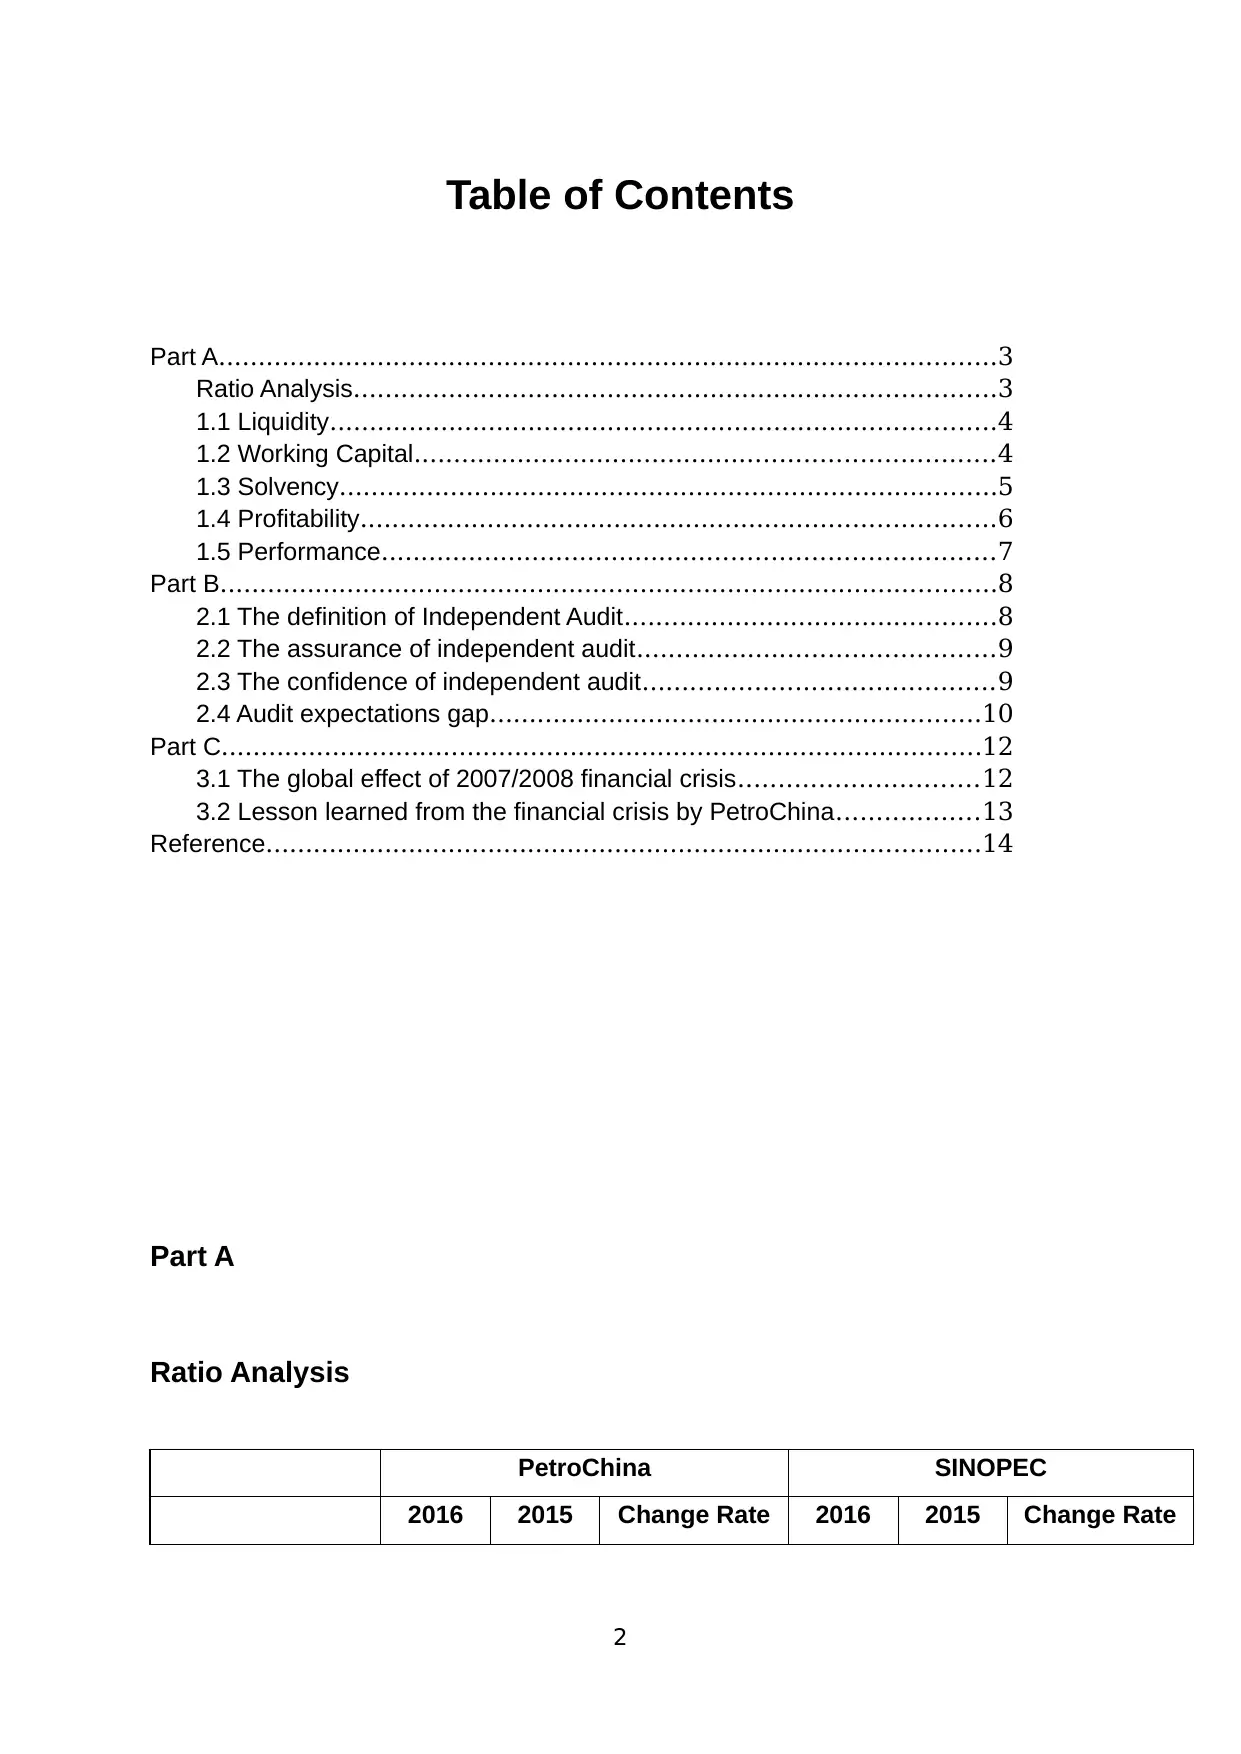
Table of Contents
Part A..................................................................................................3
Ratio Analysis.................................................................................3
1.1 Liquidity....................................................................................4
1.2 Working Capital.........................................................................4
1.3 Solvency...................................................................................5
1.4 Profitability................................................................................6
1.5 Performance.............................................................................7
Part B..................................................................................................8
2.1 The definition of Independent Audit...............................................8
2.2 The assurance of independent audit.............................................9
2.3 The confidence of independent audit............................................9
2.4 Audit expectations gap..............................................................10
Part C................................................................................................12
3.1 The global effect of 2007/2008 financial crisis..............................12
3.2 Lesson learned from the financial crisis by PetroChina..................13
Reference..........................................................................................14
Part A
Ratio Analysis
PetroChina SINOPEC
2016 2015 Change Rate 2016 2015 Change Rate
2
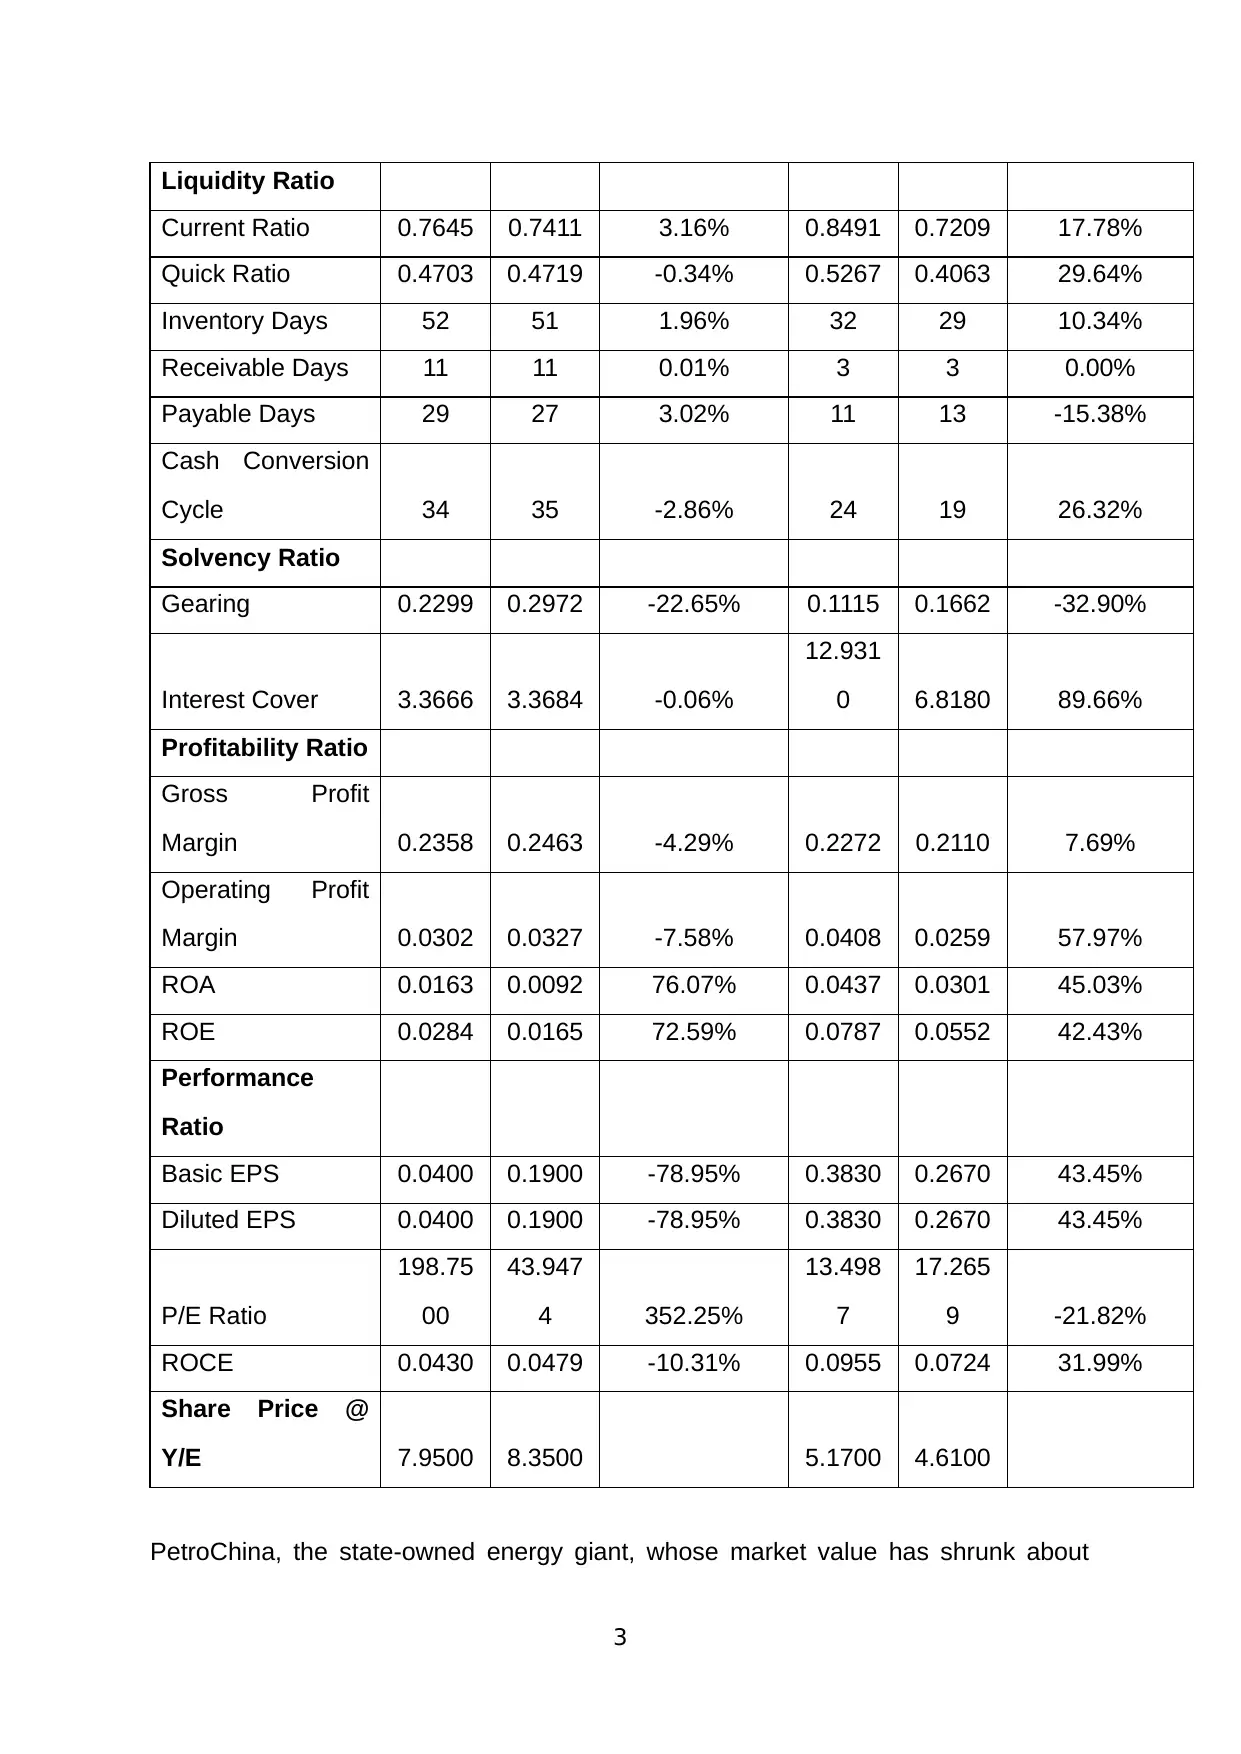
Liquidity Ratio
Current Ratio 0.7645 0.7411 3.16% 0.8491 0.7209 17.78%
Quick Ratio 0.4703 0.4719 -0.34% 0.5267 0.4063 29.64%
Inventory Days 52 51 1.96% 32 29 10.34%
Receivable Days 11 11 0.01% 3 3 0.00%
Payable Days 29 27 3.02% 11 13 -15.38%
Cash Conversion
Cycle 34 35 -2.86% 24 19 26.32%
Solvency Ratio
Gearing 0.2299 0.2972 -22.65% 0.1115 0.1662 -32.90%
Interest Cover 3.3666 3.3684 -0.06%
12.931
0 6.8180 89.66%
Profitability Ratio
Gross Profit
Margin 0.2358 0.2463 -4.29% 0.2272 0.2110 7.69%
Operating Profit
Margin 0.0302 0.0327 -7.58% 0.0408 0.0259 57.97%
ROA 0.0163 0.0092 76.07% 0.0437 0.0301 45.03%
ROE 0.0284 0.0165 72.59% 0.0787 0.0552 42.43%
Performance
Ratio
Basic EPS 0.0400 0.1900 -78.95% 0.3830 0.2670 43.45%
Diluted EPS 0.0400 0.1900 -78.95% 0.3830 0.2670 43.45%
P/E Ratio
198.75
00
43.947
4 352.25%
13.498
7
17.265
9 -21.82%
ROCE 0.0430 0.0479 -10.31% 0.0955 0.0724 31.99%
Share Price @
Y/E 7.9500 8.3500 5.1700 4.6100
PetroChina, the state-owned energy giant, whose market value has shrunk about
3
⊘ This is a preview!⊘
Do you want full access?
Subscribe today to unlock all pages.
Trusted by 1+ million students worldwide
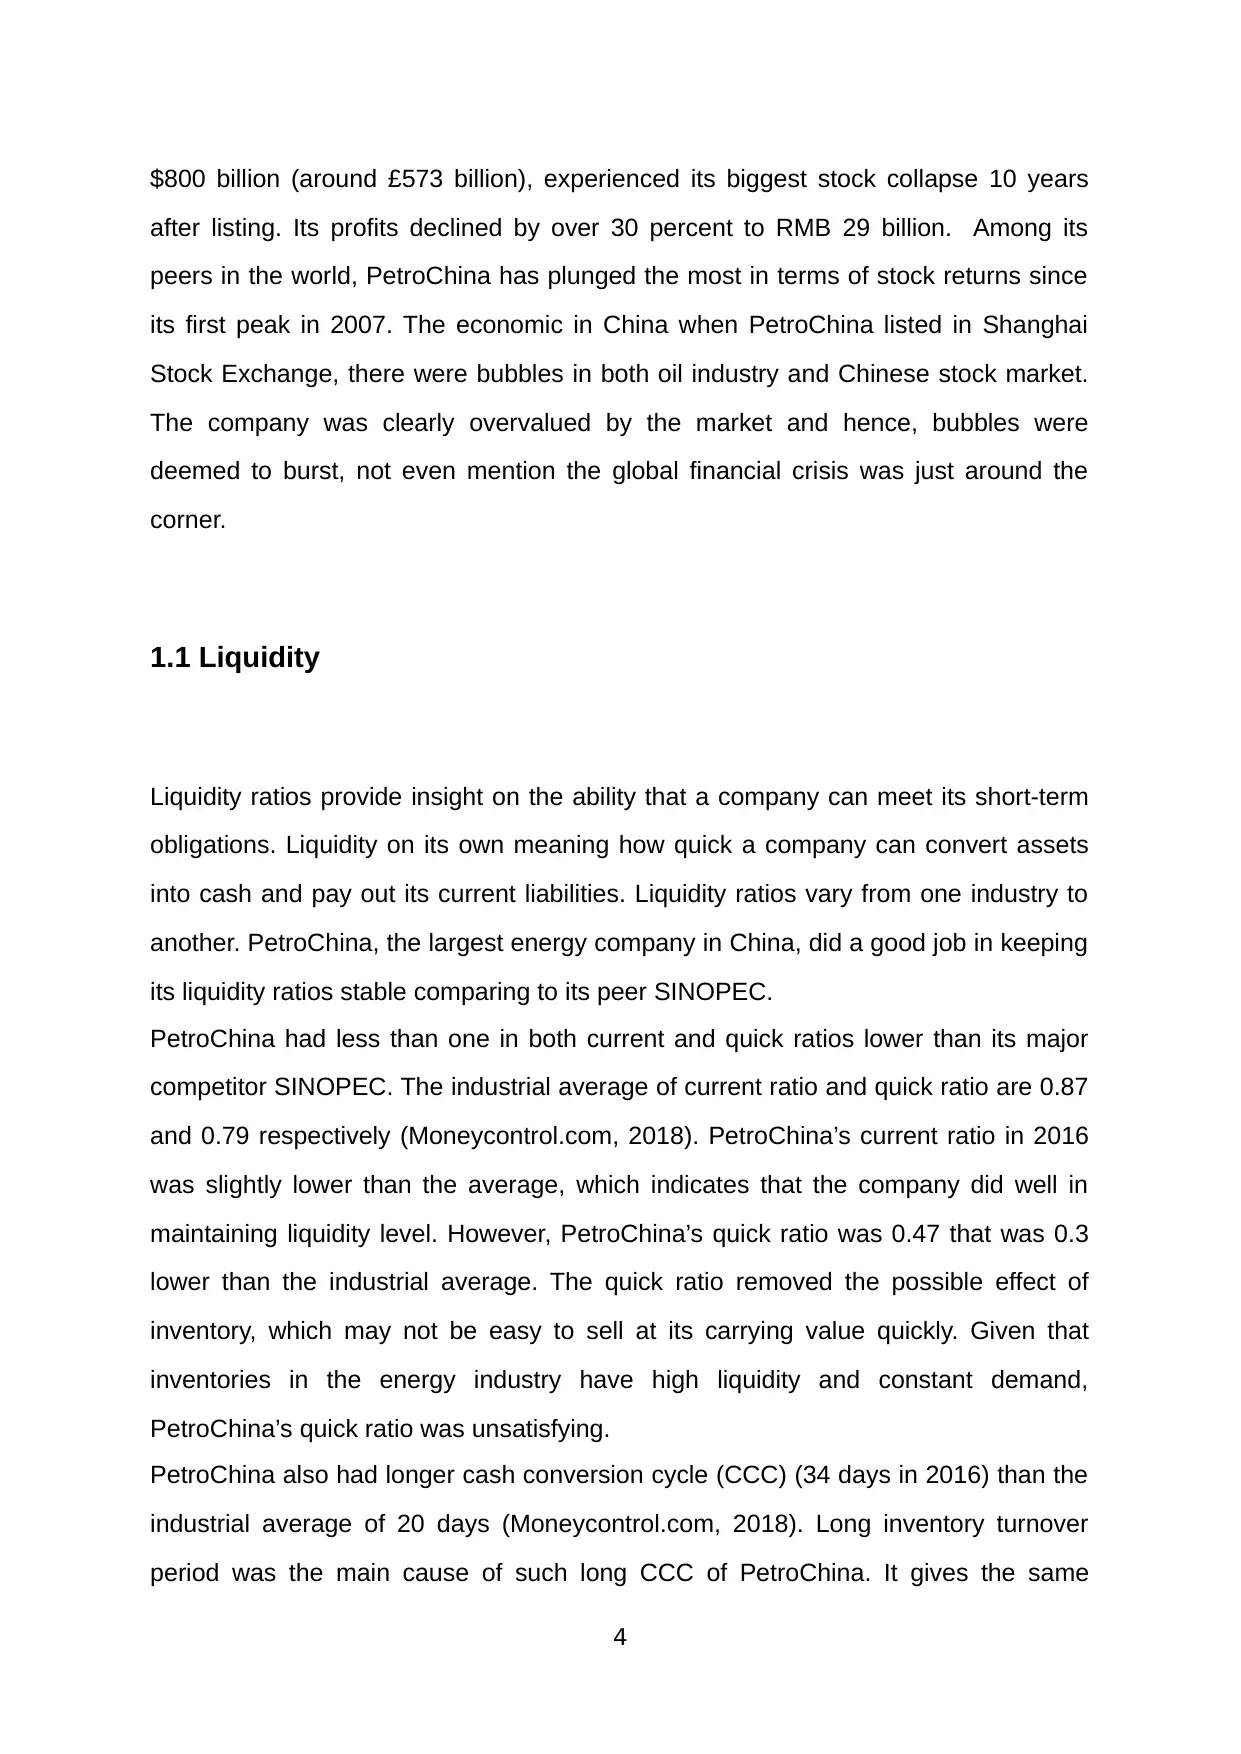
$800 billion (around £573 billion), experienced its biggest stock collapse 10 years
after listing. Its profits declined by over 30 percent to RMB 29 billion. Among its
peers in the world, PetroChina has plunged the most in terms of stock returns since
its first peak in 2007. The economic in China when PetroChina listed in Shanghai
Stock Exchange, there were bubbles in both oil industry and Chinese stock market.
The company was clearly overvalued by the market and hence, bubbles were
deemed to burst, not even mention the global financial crisis was just around the
corner.
1.1 Liquidity
Liquidity ratios provide insight on the ability that a company can meet its short-term
obligations. Liquidity on its own meaning how quick a company can convert assets
into cash and pay out its current liabilities. Liquidity ratios vary from one industry to
another. PetroChina, the largest energy company in China, did a good job in keeping
its liquidity ratios stable comparing to its peer SINOPEC.
PetroChina had less than one in both current and quick ratios lower than its major
competitor SINOPEC. The industrial average of current ratio and quick ratio are 0.87
and 0.79 respectively (Moneycontrol.com, 2018). PetroChina’s current ratio in 2016
was slightly lower than the average, which indicates that the company did well in
maintaining liquidity level. However, PetroChina’s quick ratio was 0.47 that was 0.3
lower than the industrial average. The quick ratio removed the possible effect of
inventory, which may not be easy to sell at its carrying value quickly. Given that
inventories in the energy industry have high liquidity and constant demand,
PetroChina’s quick ratio was unsatisfying.
PetroChina also had longer cash conversion cycle (CCC) (34 days in 2016) than the
industrial average of 20 days (Moneycontrol.com, 2018). Long inventory turnover
period was the main cause of such long CCC of PetroChina. It gives the same
4
Paraphrase This Document
Need a fresh take? Get an instant paraphrase of this document with our AI Paraphraser
picture as quick ratio, that PetroChina had difficulties in converting inventory into
cash. Both receivable days and payable days were longer than other companies in
this industry. One possible reason is that PetroChina as the largest energy company
in China has great bargaining power and reputation. Hence, the company can gain
better terms on trade receivables and payables.
1.2 Working Capital
PetroChina also had longer cash conversion cycle (CCC) (34 days in 2016) than the
industrial average of 20 days (Moneycontrol.com, 2018). Long inventory turnover
period was the main cause of such long CCC of PetroChina. It gives the same
picture as quick ratio, that PetroChina had difficulties in converting inventory into
cash. Both receivable days and payable days were longer than other companies in
this industry. One possible reason is that PetroChina as the largest energy company
in China has great bargaining power and reputation. Hence, the company can gain
better terms on trade receivables and payables.
1.3 Solvency
Solvency refers to the ability than one company can pay off its long-term obligations
(Scott, 2016). The major two ratios for determining the solvency of a company are
debt-to-equity ratio and interest cover ratio. Gearing ratio measures the capital
structure of a company and the higher ratio, the weaker solvency. There are
arguments saying that market values can be a better indicator than book value.
However, the market value of PetroChina’s debt was missing, therefore book values
of debt and equity were used for the purpose of consistency. PetroChina had lower
than 1 leverage ratio which did not change materially. Such result shows that the
5
cash. Both receivable days and payable days were longer than other companies in
this industry. One possible reason is that PetroChina as the largest energy company
in China has great bargaining power and reputation. Hence, the company can gain
better terms on trade receivables and payables.
1.2 Working Capital
PetroChina also had longer cash conversion cycle (CCC) (34 days in 2016) than the
industrial average of 20 days (Moneycontrol.com, 2018). Long inventory turnover
period was the main cause of such long CCC of PetroChina. It gives the same
picture as quick ratio, that PetroChina had difficulties in converting inventory into
cash. Both receivable days and payable days were longer than other companies in
this industry. One possible reason is that PetroChina as the largest energy company
in China has great bargaining power and reputation. Hence, the company can gain
better terms on trade receivables and payables.
1.3 Solvency
Solvency refers to the ability than one company can pay off its long-term obligations
(Scott, 2016). The major two ratios for determining the solvency of a company are
debt-to-equity ratio and interest cover ratio. Gearing ratio measures the capital
structure of a company and the higher ratio, the weaker solvency. There are
arguments saying that market values can be a better indicator than book value.
However, the market value of PetroChina’s debt was missing, therefore book values
of debt and equity were used for the purpose of consistency. PetroChina had lower
than 1 leverage ratio which did not change materially. Such result shows that the
5
company’s capital was mainly equity. However, when compared with the industrial
average (0.01), PetroChina’s debt level seems high.
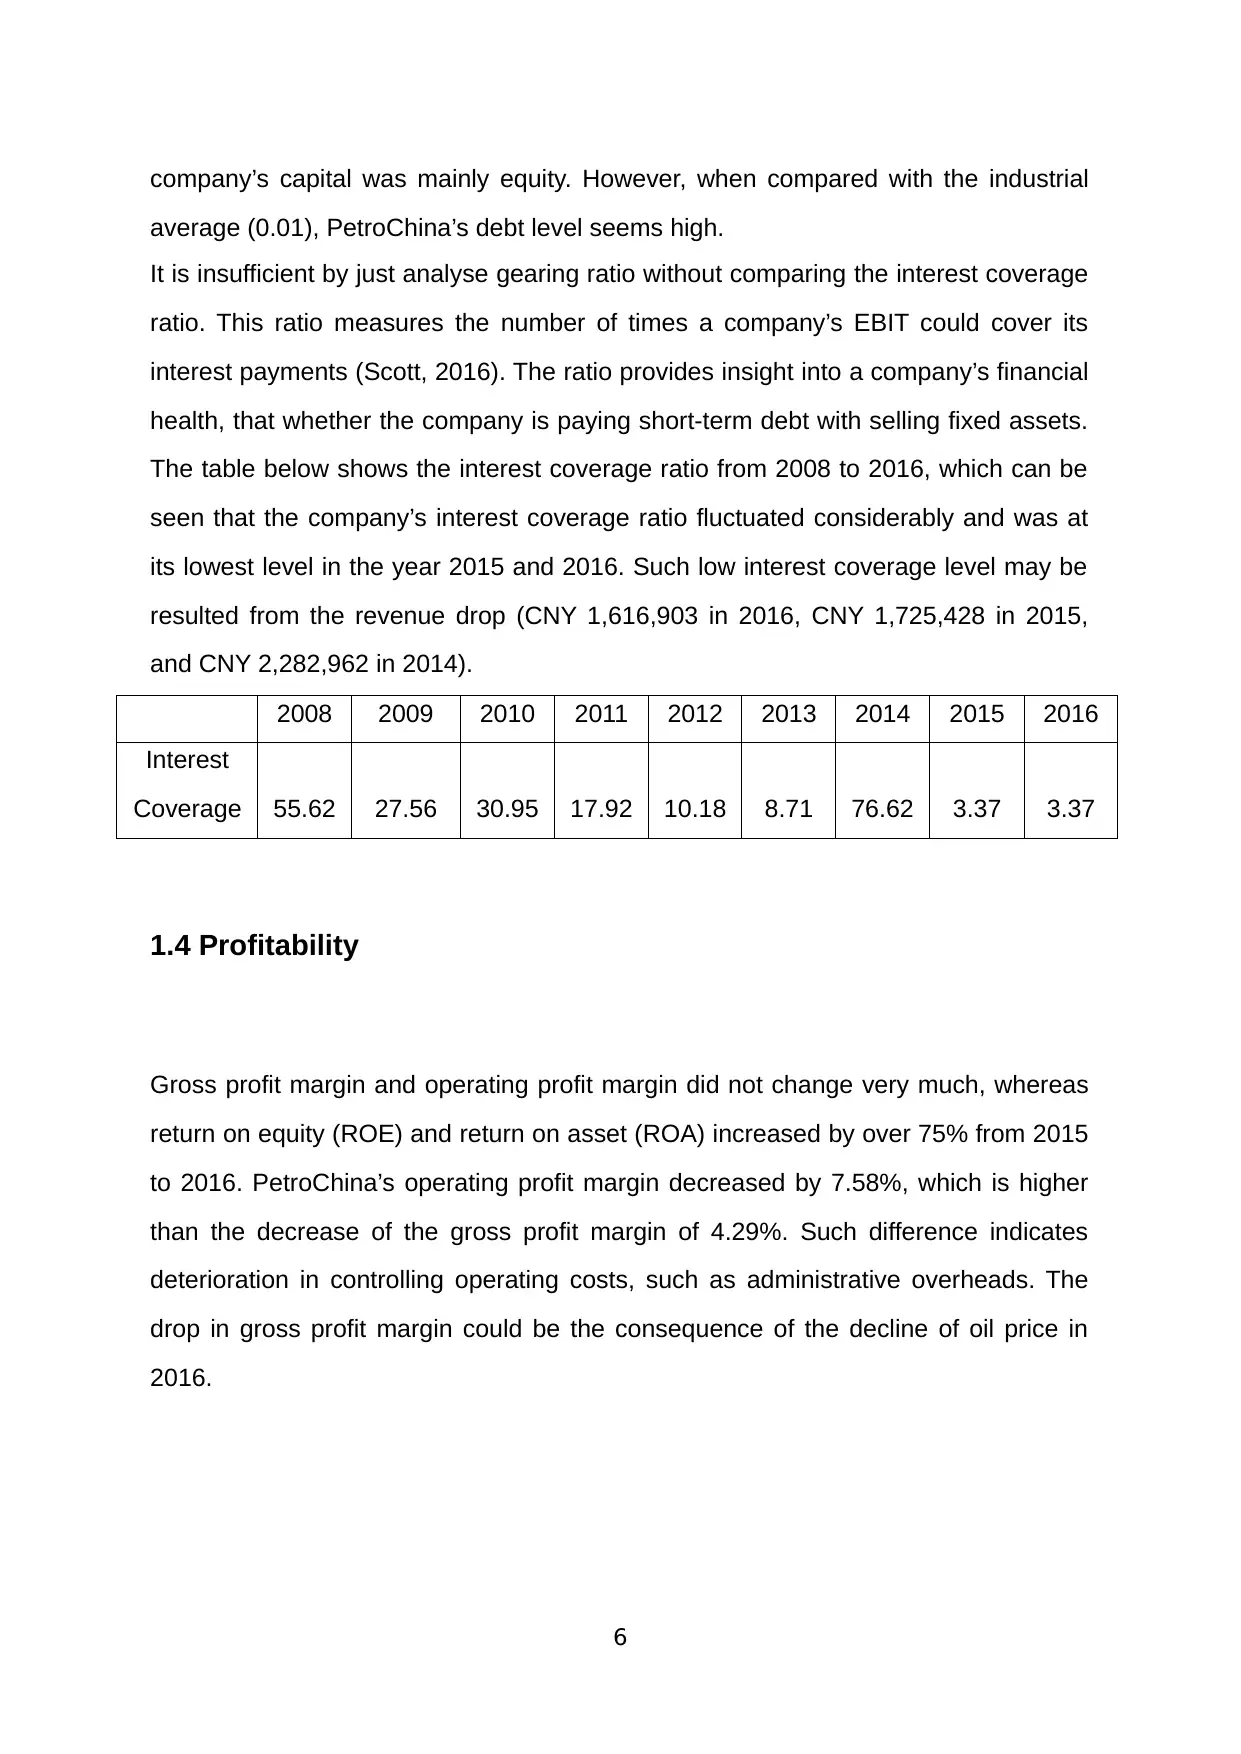
It is insufficient by just analyse gearing ratio without comparing the interest coverage
ratio. This ratio measures the number of times a company’s EBIT could cover its
interest payments (Scott, 2016). The ratio provides insight into a company’s financial
health, that whether the company is paying short-term debt with selling fixed assets.
The table below shows the interest coverage ratio from 2008 to 2016, which can be
seen that the company’s interest coverage ratio fluctuated considerably and was at
its lowest level in the year 2015 and 2016. Such low interest coverage level may be
resulted from the revenue drop (CNY 1,616,903 in 2016, CNY 1,725,428 in 2015,
and CNY 2,282,962 in 2014).
2008 2009 2010 2011 2012 2013 2014 2015 2016
Interest
Coverage 55.62 27.56 30.95 17.92 10.18 8.71 76.62 3.37 3.37
1.4 Profitability
Gross profit margin and operating profit margin did not change very much, whereas
return on equity (ROE) and return on asset (ROA) increased by over 75% from 2015
to 2016. PetroChina’s operating profit margin decreased by 7.58%, which is higher
than the decrease of the gross profit margin of 4.29%. Such difference indicates
deterioration in controlling operating costs, such as administrative overheads. The
drop in gross profit margin could be the consequence of the decline of oil price in
2016.
6
average (0.01), PetroChina’s debt level seems high.
It is insufficient by just analyse gearing ratio without comparing the interest coverage
ratio. This ratio measures the number of times a company’s EBIT could cover its
interest payments (Scott, 2016). The ratio provides insight into a company’s financial
health, that whether the company is paying short-term debt with selling fixed assets.
The table below shows the interest coverage ratio from 2008 to 2016, which can be
seen that the company’s interest coverage ratio fluctuated considerably and was at
its lowest level in the year 2015 and 2016. Such low interest coverage level may be
resulted from the revenue drop (CNY 1,616,903 in 2016, CNY 1,725,428 in 2015,
and CNY 2,282,962 in 2014).
2008 2009 2010 2011 2012 2013 2014 2015 2016
Interest
Coverage 55.62 27.56 30.95 17.92 10.18 8.71 76.62 3.37 3.37
1.4 Profitability
Gross profit margin and operating profit margin did not change very much, whereas
return on equity (ROE) and return on asset (ROA) increased by over 75% from 2015
to 2016. PetroChina’s operating profit margin decreased by 7.58%, which is higher
than the decrease of the gross profit margin of 4.29%. Such difference indicates
deterioration in controlling operating costs, such as administrative overheads. The
drop in gross profit margin could be the consequence of the decline of oil price in
2016.
6
⊘ This is a preview!⊘
Do you want full access?
Subscribe today to unlock all pages.
Trusted by 1+ million students worldwide
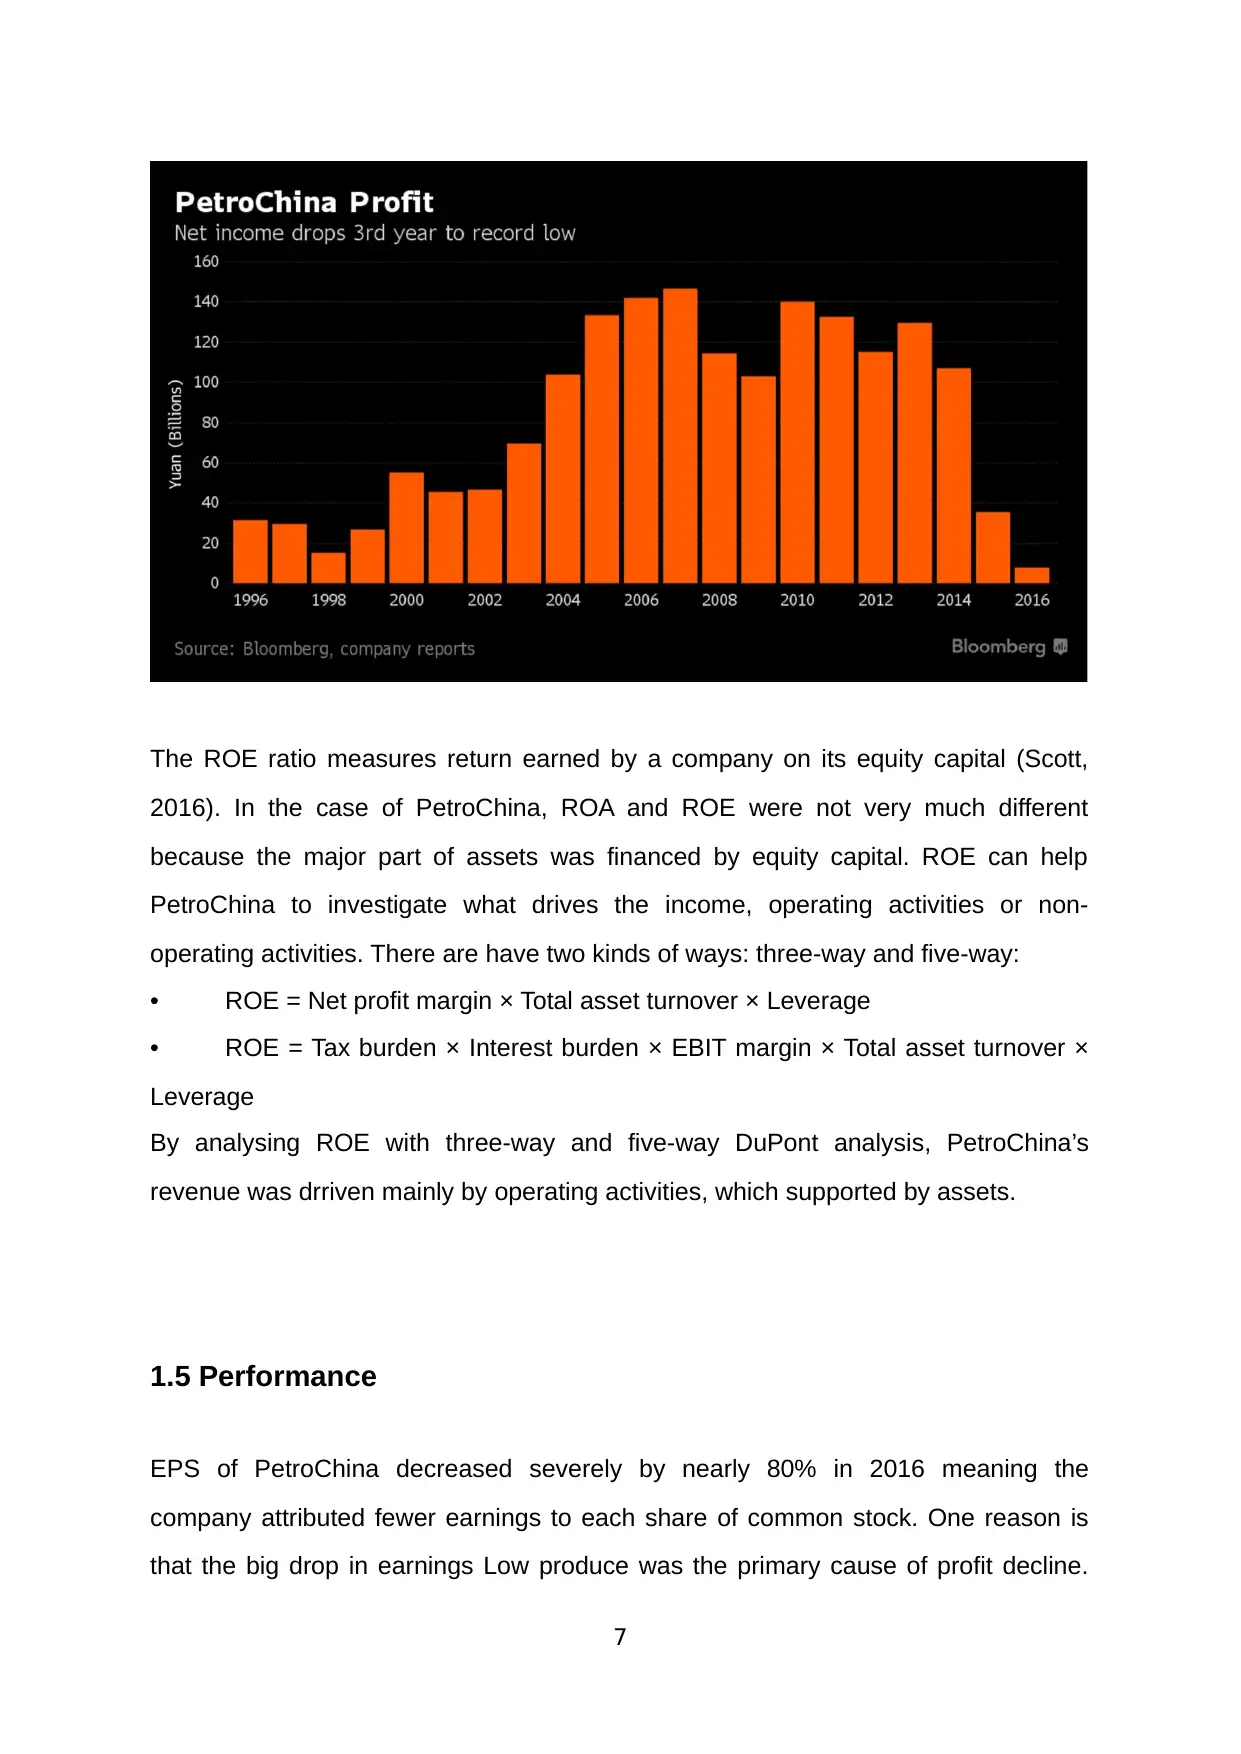
The ROE ratio measures return earned by a company on its equity capital (Scott,
2016). In the case of PetroChina, ROA and ROE were not very much different
because the major part of assets was financed by equity capital. ROE can help
PetroChina to investigate what drives the income, operating activities or non-
operating activities. There are have two kinds of ways: three-way and five-way:
• ROE = Net profit margin × Total asset turnover × Leverage
• ROE = Tax burden × Interest burden × EBIT margin × Total asset turnover ×
Leverage
By analysing ROE with three-way and five-way DuPont analysis, PetroChina’s
revenue was drriven mainly by operating activities, which supported by assets.
1.5 Performance
EPS of PetroChina decreased severely by nearly 80% in 2016 meaning the
company attributed fewer earnings to each share of common stock. One reason is
that the big drop in earnings Low produce was the primary cause of profit decline.
7
Paraphrase This Document
Need a fresh take? Get an instant paraphrase of this document with our AI Paraphraser
Total crude oil output in the first three quarters declined by 3.6%, to 697m barrels of
oil (Megaw, 2016). Like its peers, PetroChina has cut high-cost production in order to
stay profitable. However, such actions met political difficulties due to Beijing prioritise
production targets.
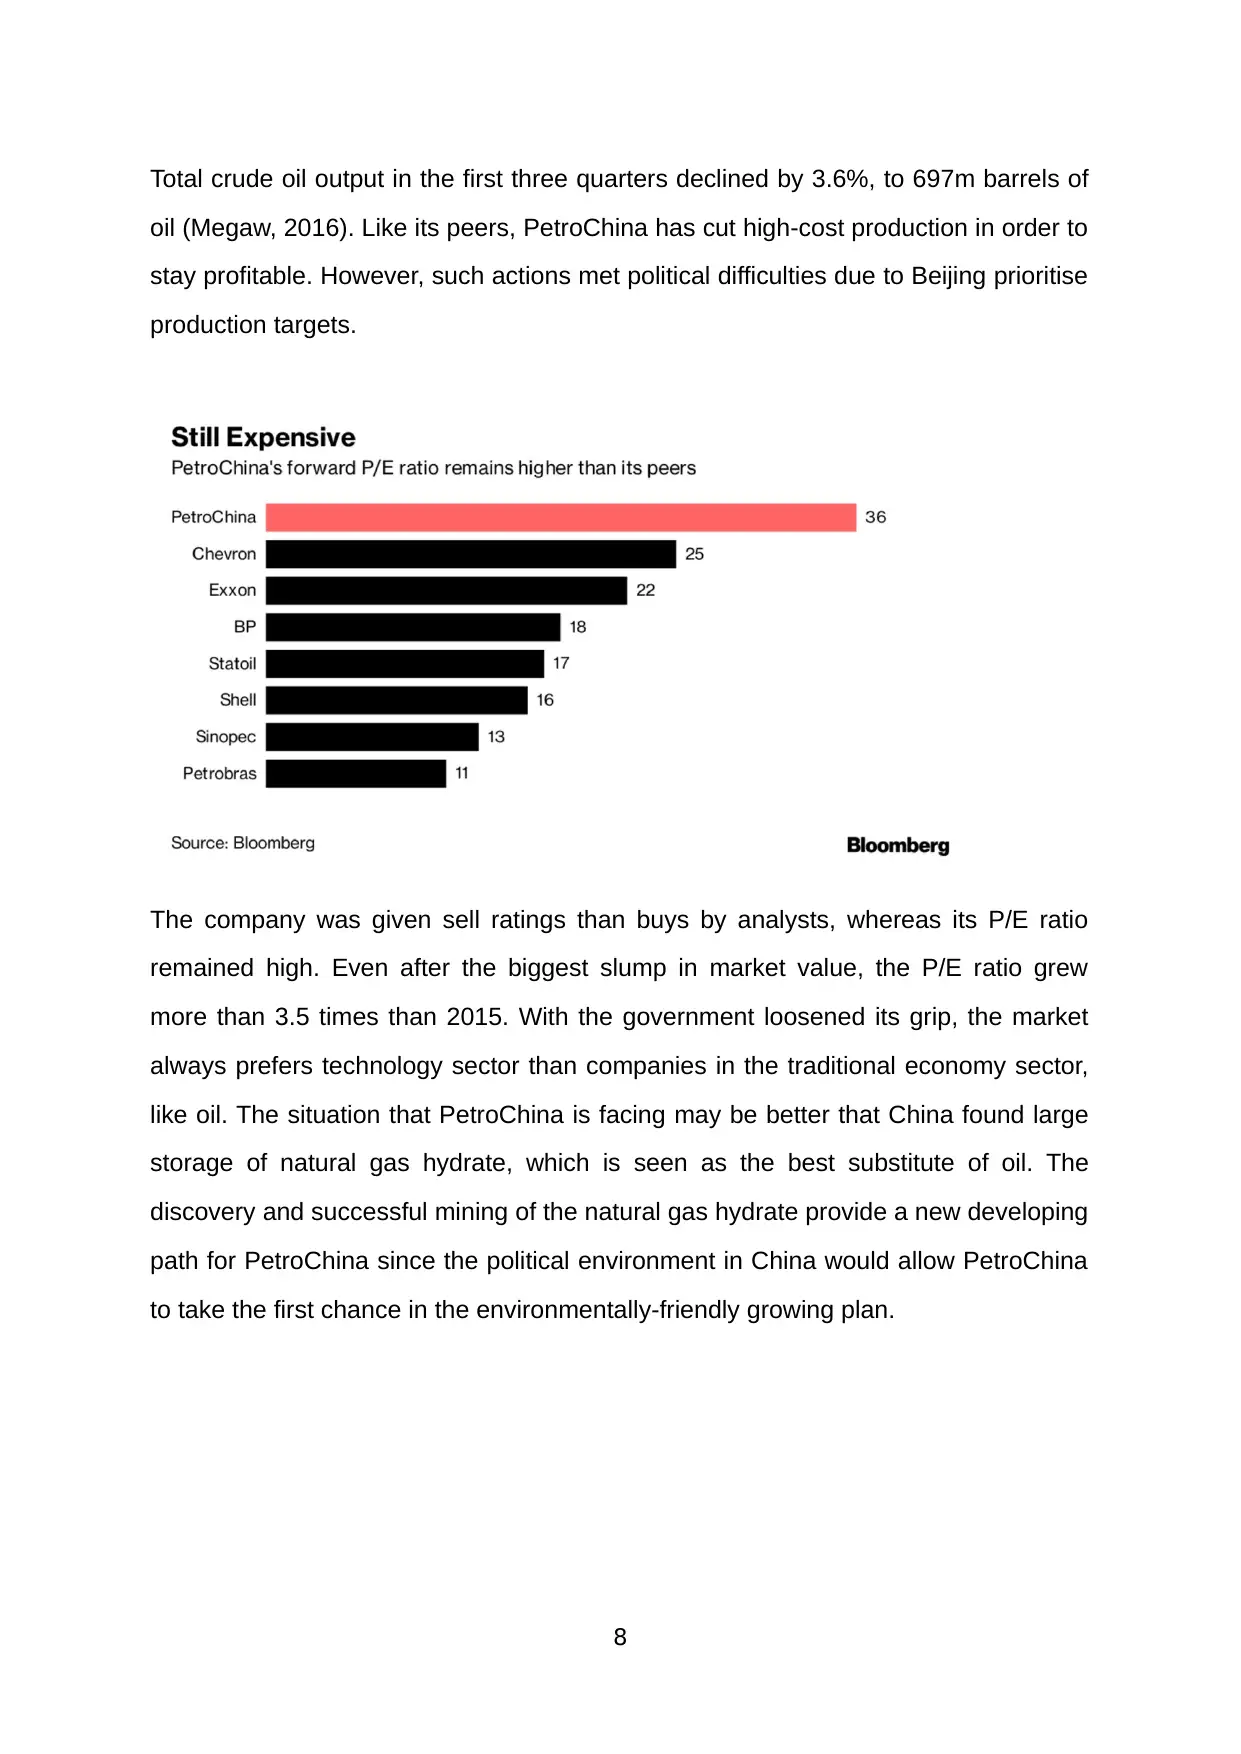
The company was given sell ratings than buys by analysts, whereas its P/E ratio
remained high. Even after the biggest slump in market value, the P/E ratio grew
more than 3.5 times than 2015. With the government loosened its grip, the market
always prefers technology sector than companies in the traditional economy sector,
like oil. The situation that PetroChina is facing may be better that China found large
storage of natural gas hydrate, which is seen as the best substitute of oil. The
discovery and successful mining of the natural gas hydrate provide a new developing
path for PetroChina since the political environment in China would allow PetroChina
to take the first chance in the environmentally-friendly growing plan.
8
oil (Megaw, 2016). Like its peers, PetroChina has cut high-cost production in order to
stay profitable. However, such actions met political difficulties due to Beijing prioritise
production targets.
The company was given sell ratings than buys by analysts, whereas its P/E ratio
remained high. Even after the biggest slump in market value, the P/E ratio grew
more than 3.5 times than 2015. With the government loosened its grip, the market
always prefers technology sector than companies in the traditional economy sector,
like oil. The situation that PetroChina is facing may be better that China found large
storage of natural gas hydrate, which is seen as the best substitute of oil. The
discovery and successful mining of the natural gas hydrate provide a new developing
path for PetroChina since the political environment in China would allow PetroChina
to take the first chance in the environmentally-friendly growing plan.
8
Part B
2.1 The definition of Independent Audit
Independent auditors are expected to provide the expression of an opinion on the
fairness of a company’s financial reporting with accounting standards, which requires
auditors to state opinions on whether the company’s financial reporting comply with
accounting principles independently. Auditors do not have the responsibility to
prepare financial statements for the company. However, the independent auditor
may utilise his professional knowledge to make comments on the form or content of
the financial reporting. It relies on the auditor himself to decide which auditing
procedure needed to be exercise and his judgements should not be affected in any
circumstances. In the US, audit reports are legally required for statements provided
to SEC. Many companies who are not subject to rules of SEC also prepare audit
report to enhance the credibility of their statements.
Evidence shows that companies who get their reports audited can get loans at lower
interest rates than their peer otherwise (Blackwell, Noland, and Winters, 1998). That
is because auditors, especially independent auditors, serve the purpose of
increasing stakeholders’ confidence in the reliability of financial statements and the
company’s stability. Hence, creditors do not require high interest to cover the risk of
loss. Requirements for getting the professional qualification including certain amount
and level of education and defined the length of practical experience give
independent auditors credibility. Independent auditors are often nominated by the
audit committee that is appointed by the board of directors, which is consist of
shareholders and represent the interests of shareholders.
The audit process starts before accepting an engagement. The auditor needs to
assess the potential risks, the nature and complexity of client’s business and
whether the firm has required resources and expertise to perform required activities.
9
⊘ This is a preview!⊘
Do you want full access?
Subscribe today to unlock all pages.
Trusted by 1+ million students worldwide
In addition, audit firms also conduct detailed due diligence checks on senior
managements and the audit committee as part of client acceptance procedure,
which further increases the accountability of their final products (Kueppers and
Sullivan, 2010). The auditor takes many movements to analysis the company’s
present and past reports, press releases, and its industry in order to gain a whole
picture of the company and to shed light on the risks and material misstatements.
Movements also include consideration of new transactions which are unusual or
significantly different from the past as well as consideration of past audit report on
misstatements.
2.2 The assurance of independent audit
According to the PCAOB (1972), an auditor is required to plan and perform audit ‘to
obtain reasonable assurance about whether the financial statements are free of
material misstatement, whether caused by error or fraud’. Reasonable assurance
means a high level, but not absolute, of assurance. Absolute assurance is
considered impossible due to the fact that auditors cannot test every detail of the
company because there is not enough time or budget. The confidence that an
auditor attains is subjective and is the foundation for expressing an audit opinion,
whereas users of financial statements derive their own confidence in the audited
financial statements. Users of financial statements may gain confidence in the
management of a company that they are operating with knowledge of
consequences.
10
Paraphrase This Document
Need a fresh take? Get an instant paraphrase of this document with our AI Paraphraser
2.3 The confidence of independent audit
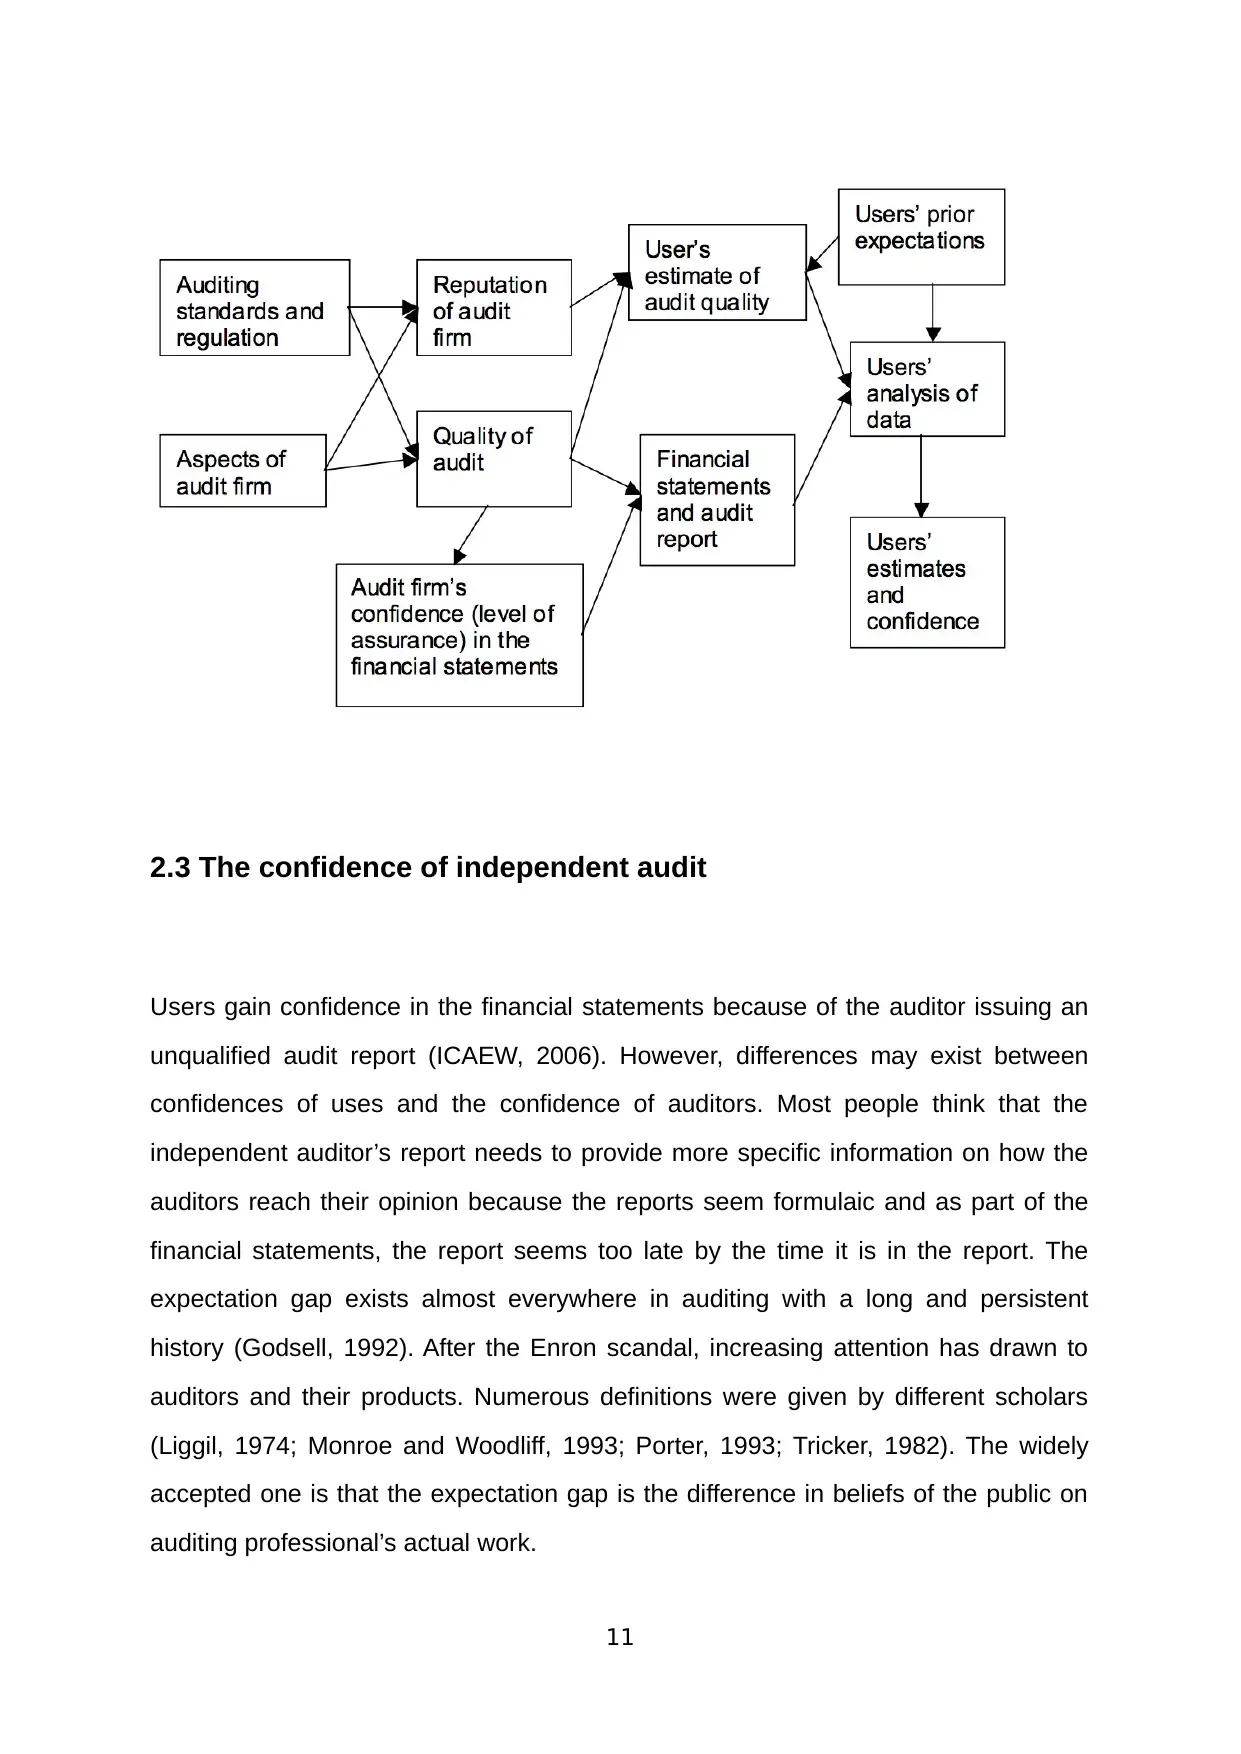
Users gain confidence in the financial statements because of the auditor issuing an
unqualified audit report (ICAEW, 2006). However, differences may exist between
confidences of uses and the confidence of auditors. Most people think that the
independent auditor’s report needs to provide more specific information on how the
auditors reach their opinion because the reports seem formulaic and as part of the
financial statements, the report seems too late by the time it is in the report. The
expectation gap exists almost everywhere in auditing with a long and persistent
history (Godsell, 1992). After the Enron scandal, increasing attention has drawn to
auditors and their products. Numerous definitions were given by different scholars
(Liggil, 1974; Monroe and Woodliff, 1993; Porter, 1993; Tricker, 1982). The widely
accepted one is that the expectation gap is the difference in beliefs of the public on
auditing professional’s actual work.
11
2.4 Audit expectations gap
Most of the studies determine the gap between auditors’ and public’s view of the
responsibilities of auditors via surveys. Findings show that the public expects
auditors to be more active in detecting and reporting wrongdoings and frauds, which
are not in the principals of audit work. The level of assurance an audit is expected to
provide is also significantly different. The public hold auditors to provide a very high
level of assurance which is simply unable to achieve (Epstein and Geiger, 1994).
Other aspects such as the extent of auditors’ responsibilities to third parties, the
nature of balance sheet assessments, and the validation of and on-going hazards to
auditors’ independence also contain differences.
Several ways can be taken to reduce the expectation gap: expanding audit report,
education, structuring audit methodologies, expansion of auditor’s responsibilities
and enhancement of auditor independence, and so on (Chye Koh and Woo, 1998),
among which education is believed to be the most effective solution. Users tend to
have a higher expectation in auditors’ responsibilities than what auditors themselves
believe reasonable. Such difference resulted in dissatisfaction and criticism on
auditing work. One major criticism addresses the issue that auditors spend extremely
long time with their clients. Hence many suspects the actual independence of
external auditors. The accounting professions have taken measures to address such
gap to the public and try to narrow down the gap by increasing audit quality.
Taking the audit reports of PetroChina’s financial statement as an example, KPMG
issued qualified audit report saying that the company’s 2016 financial statements
present fairly, in all material respects, in accordance with the requirements of
Accounting Standards for Business Enterprises issued by the Ministry of Finance of
the People’s Republic of China. The reports also gave opinions on issues that need
to be noticed by stakeholders along with why the auditor think those issues matter.
The audit report allows users of the financial statement to develop a rather
comprehensive idea of how useful is the financial statement and what issues require
12
⊘ This is a preview!⊘
Do you want full access?
Subscribe today to unlock all pages.
Trusted by 1+ million students worldwide
1 out of 19
Related Documents


Your All-in-One AI-Powered Toolkit for Academic Success.
+13062052269
info@desklib.com
Available 24*7 on WhatsApp / Email
![[object Object]](/_next/static/media/star-bottom.7253800d.svg)
Unlock your academic potential
Copyright © 2020–2026 A2Z Services. All Rights Reserved. Developed and managed by ZUCOL.