ECON 1008: Demand, Supply, and Petrol Price Analysis in Australia
VerifiedAdded on  2023/06/11
|9
|1575
|86
Report
AI Summary
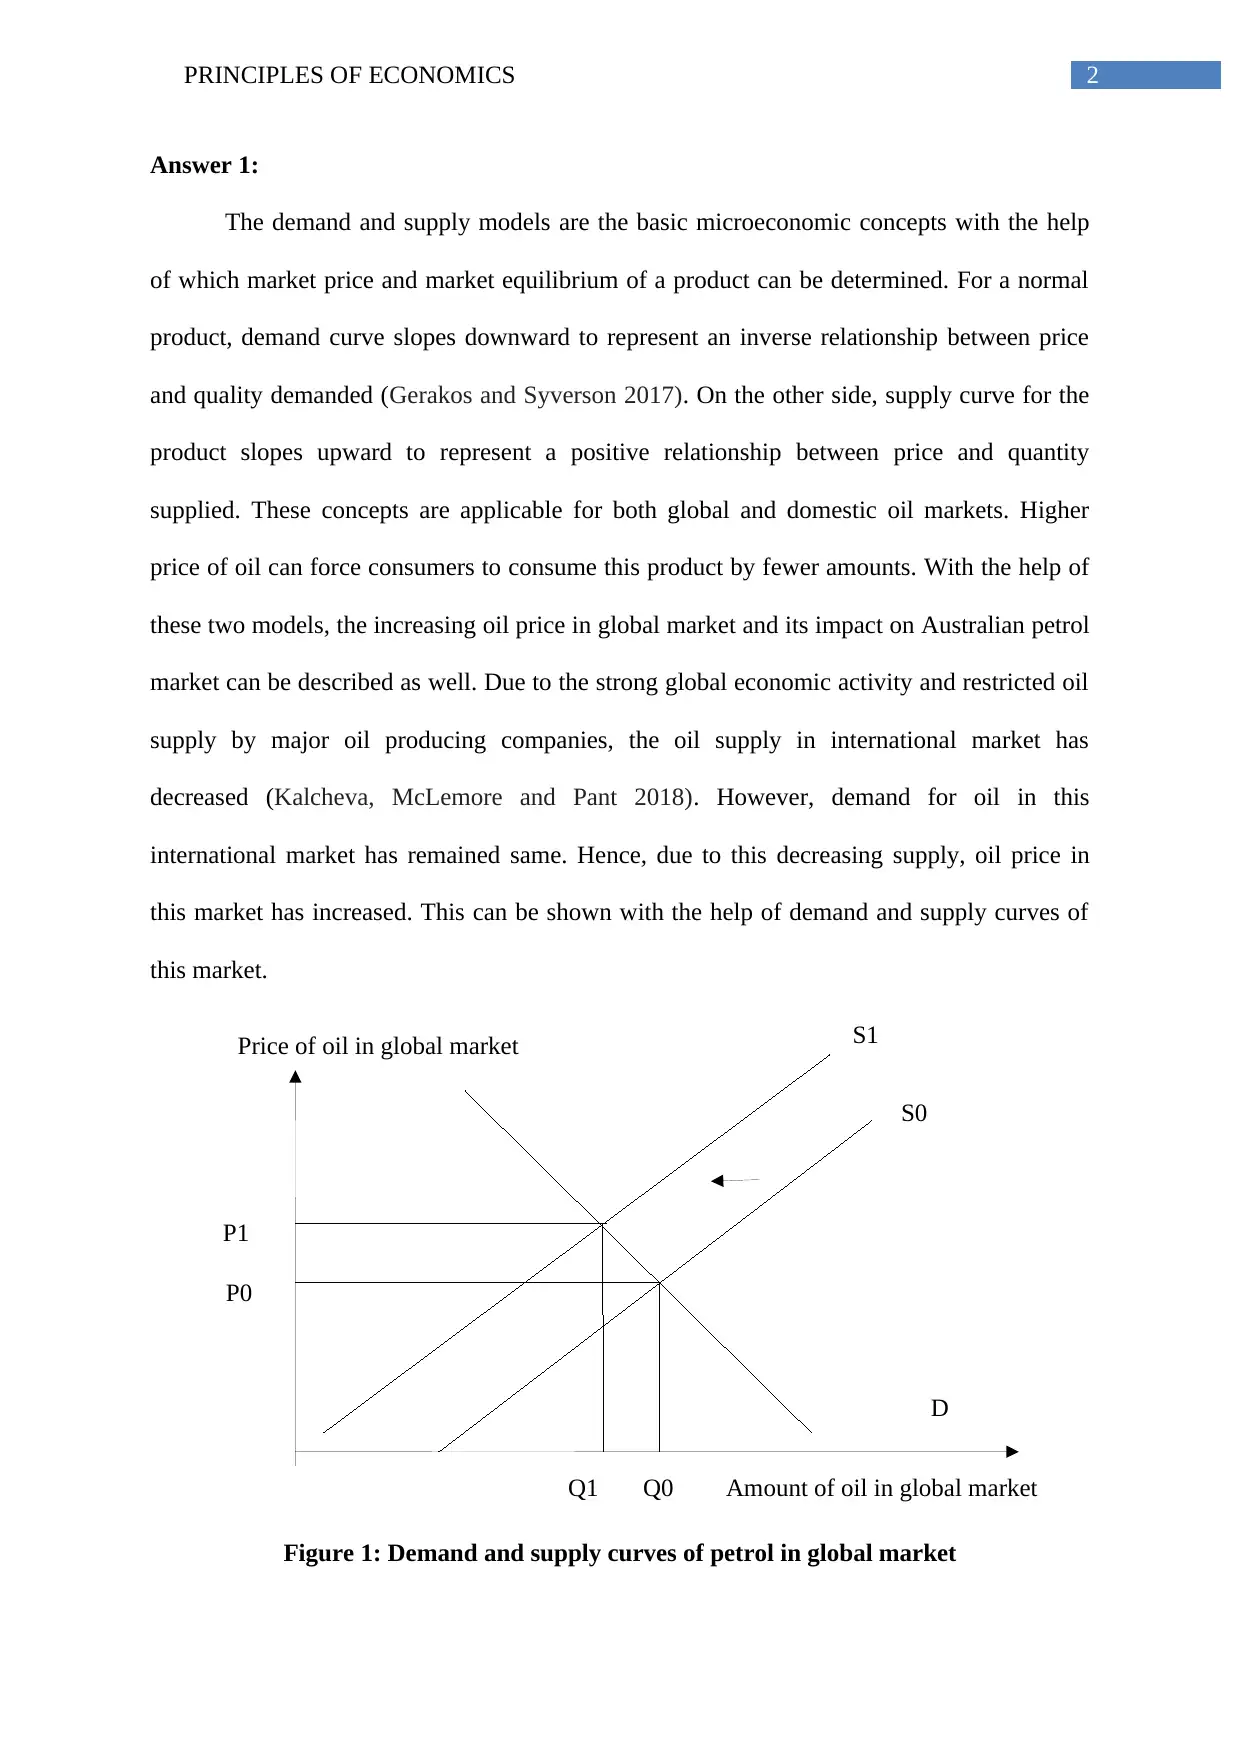
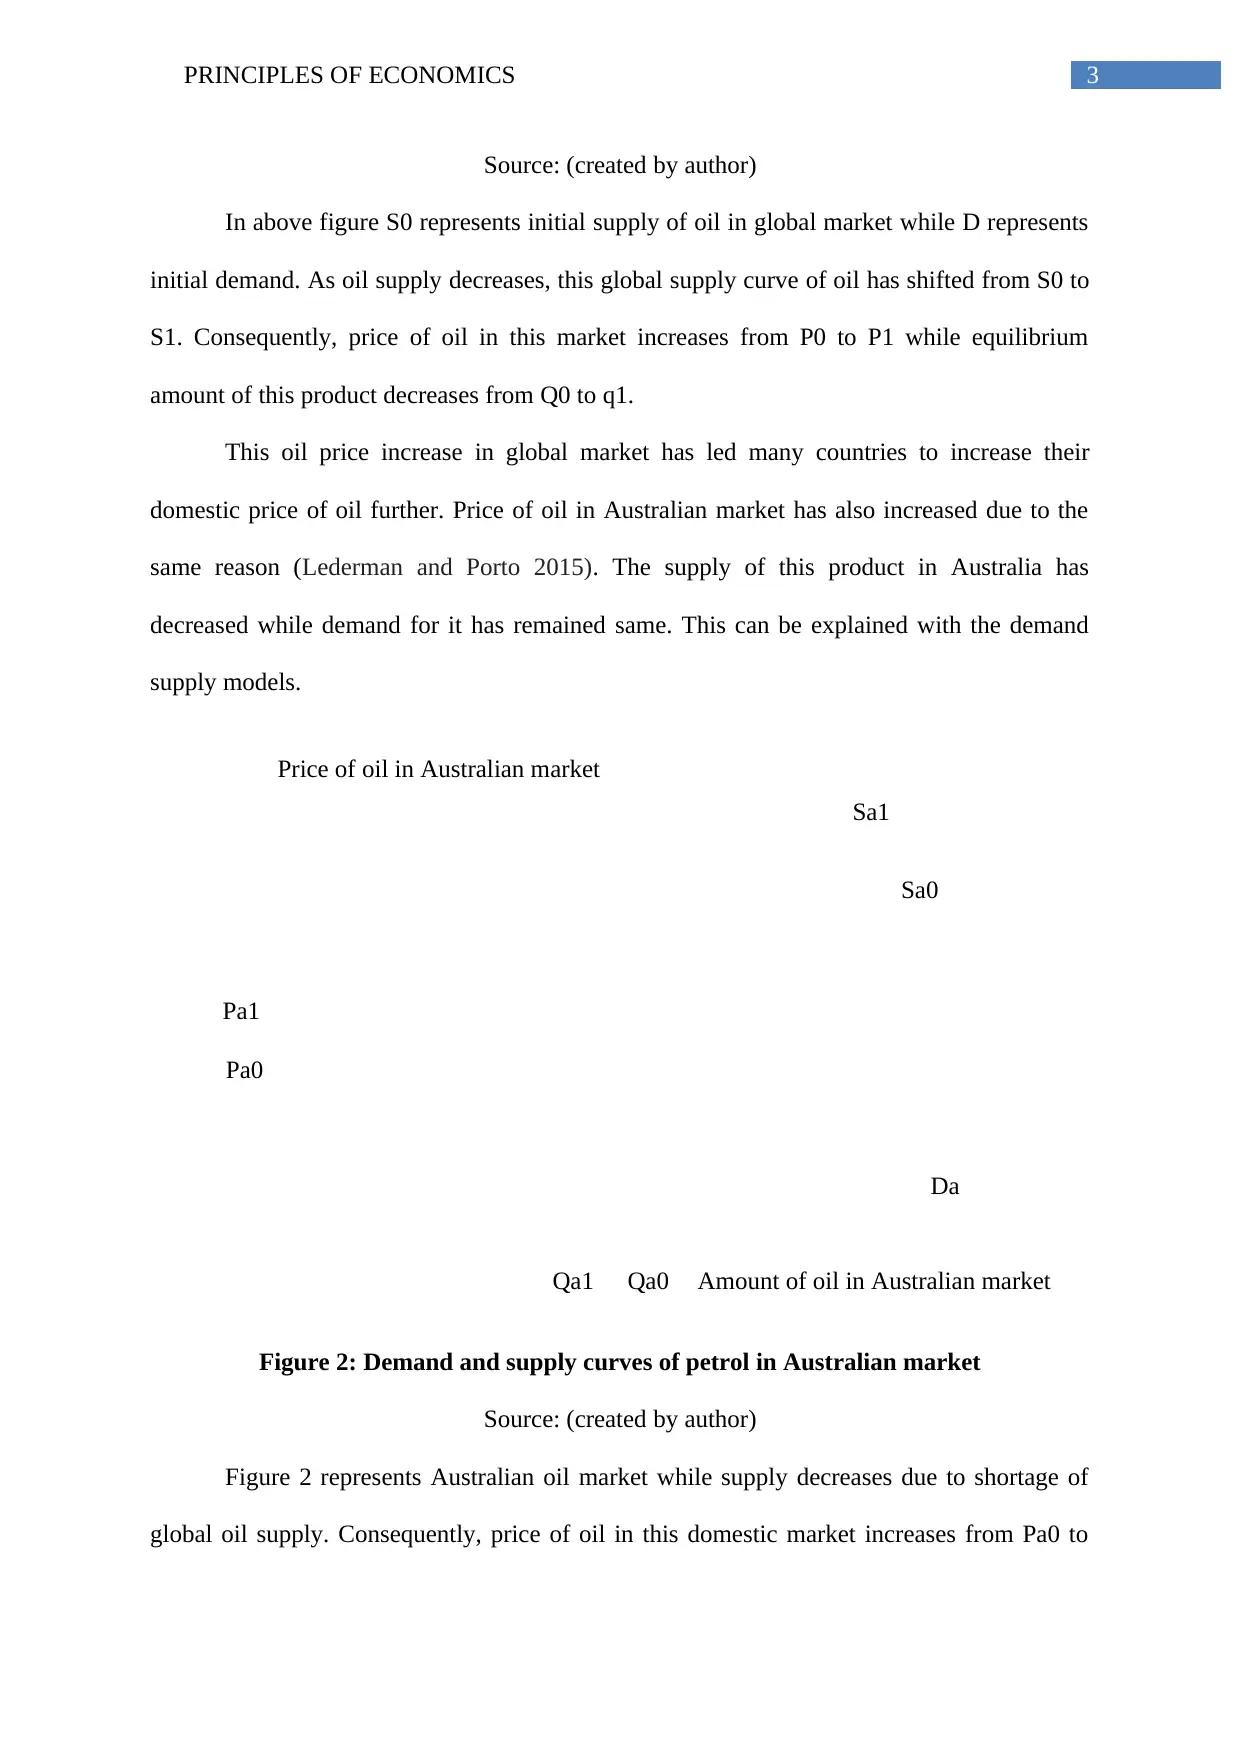
This report analyzes the factors influencing petrol prices in the Australian market, drawing on the principles of economics. It utilizes demand and supply models to explain how global oil market dynamics impact domestic petrol prices, focusing on the effects of restricted oil supply and strong economic activity. The report also examines the price elasticity of demand for petrol in Australia, arguing that petrol is an inelastic product with a steep demand curve, leading to increased revenue for petrol stations despite price increases. Furthermore, it discusses the impact of government-imposed taxes on petrol, illustrating how these taxes shift the supply curve, increase market prices, and decrease both consumer and producer surplus. The analysis is supported by relevant diagrams and references to provide a comprehensive understanding of the economic forces at play in the Australian petrol market. Desklib provides more solved assignments and past papers for students.

Running head: PRINCIPLES OF ECONOMICS
Principles of Economics
Name of the student
Name of the university
Author Note
Principles of Economics
Name of the student
Name of the university
Author Note
Paraphrase This Document
Need a fresh take? Get an instant paraphrase of this document with our AI Paraphraser

1PRINCIPLES OF ECONOMICS
Table of Contents
Answer 1:...................................................................................................................................2
Answer 2:...................................................................................................................................5
Answer 3:...................................................................................................................................7
References:.................................................................................................................................8

2PRINCIPLES OF ECONOMICS
D
S0
S1
P0
P1
Q1 Q0
Price of oil in global market
Amount of oil in global market
Answer 1:
The demand and supply models are the basic microeconomic concepts with the help
of which market price and market equilibrium of a product can be determined. For a normal
product, demand curve slopes downward to represent an inverse relationship between price
and quality demanded (Gerakos and Syverson 2017). On the other side, supply curve for the
product slopes upward to represent a positive relationship between price and quantity
supplied. These concepts are applicable for both global and domestic oil markets. Higher
price of oil can force consumers to consume this product by fewer amounts. With the help of
these two models, the increasing oil price in global market and its impact on Australian petrol
market can be described as well. Due to the strong global economic activity and restricted oil
supply by major oil producing companies, the oil supply in international market has
decreased (Kalcheva, McLemore and Pant 2018). However, demand for oil in this
international market has remained same. Hence, due to this decreasing supply, oil price in
this market has increased. This can be shown with the help of demand and supply curves of
this market.
Figure 1: Demand and supply curves of petrol in global market
⊘ This is a preview!⊘
Do you want full access?
Subscribe today to unlock all pages.

Trusted by 1+ million students worldwide

3PRINCIPLES OF ECONOMICS
Da
Sa0
Sa1
Pa0
Pa1
Qa1 Qa0
Price of oil in Australian market
Amount of oil in Australian market
Source: (created by author)
In above figure S0 represents initial supply of oil in global market while D represents
initial demand. As oil supply decreases, this global supply curve of oil has shifted from S0 to
S1. Consequently, price of oil in this market increases from P0 to P1 while equilibrium
amount of this product decreases from Q0 to q1.
This oil price increase in global market has led many countries to increase their
domestic price of oil further. Price of oil in Australian market has also increased due to the
same reason (Lederman and Porto 2015). The supply of this product in Australia has
decreased while demand for it has remained same. This can be explained with the demand
supply models.
Figure 2: Demand and supply curves of petrol in Australian market
Source: (created by author)
Figure 2 represents Australian oil market while supply decreases due to shortage of
global oil supply. Consequently, price of oil in this domestic market increases from Pa0 to
Paraphrase This Document
Need a fresh take? Get an instant paraphrase of this document with our AI Paraphraser

4PRINCIPLES OF ECONOMICS
Pa1. OPEC and Non-OPEC countries have restricted oil supply to increase their revenue
(ABC News. 2017).
Pa1. OPEC and Non-OPEC countries have restricted oil supply to increase their revenue
(ABC News. 2017).

5PRINCIPLES OF ECONOMICS
Price
Amount of Petrol
D
Answer 2:
Price elasticity of demand for a product can be determined with the help of its own
price. If the product is elastic then a small change in price can change the demand for this
product by large amount. In this situation demand curve becomes flatter. On the contrary,
inelastic product implies that a small change in price cannot change the demand for this
product significantly. Hence, the main determinant of price elasticity is the own price of the
product. With the help of this concept, it can be analyzed that whether demand for oil in
domestic market of Australia is elastic or not. In this country, petrol is the single product that
consumers purchase by maximum amount (Olmstead et al. 2015). Therefore, this product can
be referred as necessary one that each household and business origination demands every day
to meet their requirements. Thus, increase in price of petrol affects the budget of each
household and cost of production for each company, adversely. Consequently, to offset this
budget deficit, those consumers decrease their consumptions of other products significantly
(Murjani 2017). According to this statement, it can be said that petrol is an inelastic product
and consequently it has stepper demand curve.
Figure 3: Inelastic demand curve for Petrol
Source: (created by author)
Figure 3 represent inelastic demand curve for petrol in Australian market. Due to this
type of demand curve, revenue of petrol station has increased significantly. This is because
⊘ This is a preview!⊘
Do you want full access?
Subscribe today to unlock all pages.

Trusted by 1+ million students worldwide

6PRINCIPLES OF ECONOMICS
Dp D
Sp0
Sp1
S0
S1
Pp0
Pp1 P1
O
Price of Petrol Price
Output of Petrol Output
(a)Elastic demand curve of Petrol (b)Inelastic demand curve
people cannot reduce their consumption of this oil. Hence, they can buy same amount of oil
with comparatively higher prices and consequently total revenue of a petrol station can
increase by comparatively higher amount. This is not possible for an elastic product as higher
price of product can decrease its demand by large amount. In this context, revenue of seller
can be decreased further compare to before.
Figure 4: Amount of revenue for both elastic and inelastic product
Source: (created by author)
Figure 4 (a) represents elastic demand curve for Petrol. As price of oil increases in
Australia from Pp0 to Pp1, revenue of petrol station increases as well. Figure 4 (b) represents
an elastic supply curve with similar economic phenomenon. However, in this figure, increase
in price is low compare. Hence, the amount of revenue for a product with elastic demand
curve is low compare to the amount of revenue of an inelastic demand curve.
Paraphrase This Document
Need a fresh take? Get an instant paraphrase of this document with our AI Paraphraser

7PRINCIPLES OF ECONOMICS
O
Price
Amount of Petrol
S0
S0+t
P0
P1
B
C
A
F
D
Answer 3:
As the government imposes tax on Petrol, producers can reduce their supply. Thus,
the curve can shift towards left and consequently market price of this product can increase
further. This tax is considered as indirect one. Thus, the government imposes this tax on the
sellers though consumers pay the ultimate amount of tax (Coglianese, Davis, Kilian and
Stock 2017). Hence, the amount of consumer’s surplus decreases. On the other side,
producers reduce their supply of due to higher prices (Appleyard and Chesbrough 2017).
Thus, producer’s surplus can be decreased as well.
Figure 5: Consumer surplus and producer surplus
Source: (created by author)
After imposition of tax, supply curve of petrol shifts from S0 to S0+t in figure 5. The
initial amount of consumer surplus is AFP0. However, after tax imposition, this amount
becomes AFP1 while AFP1 < AFP2. On the other side, initial amount of producer surplus is
CDP0. After tax, this amount becomes BFP1 while BFP1< CDP0. Hence, from above
diagram it can be said that both consumer and producer surplus decrease after tax.

8PRINCIPLES OF ECONOMICS
References:
ABC News. 2017. Why is petrol so expensive? Global oil deals and the Reserve Bank's
dilemma. [online] Available at: http://www.abc.net.au/news/2017-12-27/why-petrol-
expensive-global-oil-deal-opec-reserve-bank-dilemma/9287666 [Accessed 5 Jul. 2018].
Appleyard, M.M. and Chesbrough, H.W., 2017. The dynamics of open strategy: from
adoption to reversion. Long Range Planning, 50(3), pp.310-321.
Coglianese, J., Davis, L.W., Kilian, L. and Stock, J.H., 2017. Anticipation, tax avoidance,
and the price elasticity of gasoline demand. Journal of Applied Econometrics, 32(1), pp.1-15.
Gerakos, J. and Syverson, C., 2017. Audit firms face downward-sloping demand curves and
the audit market is far from perfectly competitive. Review of Accounting Studies, 22(4),
pp.1582-1594.
Kalcheva, I., McLemore, P. and Pant, S., 2018. Innovation: The interplay between demand-
side shock and supply-side environment. Research Policy, 47(2), pp.440-461.
Lederman, D. and Porto, G., 2015. The price is not always right: on the impacts of
commodity prices on households (and countries). The World Bank Research Observer, 31(1),
pp.168-197.
Murjani, A., 2017. Energy Goods Demand in Tabalong Regency. Jurnal Bina Praja: Journal
of Home Affairs Governance, 9(2), pp.307-319.
Olmstead, T.A., Alessi, S.M., Kline, B., Pacula, R.L. and Petry, N.M., 2015. The price
elasticity of demand for heroin: matched longitudinal and experimental evidence. Journal of
health economics, 41, pp.59-71.
⊘ This is a preview!⊘
Do you want full access?
Subscribe today to unlock all pages.

Trusted by 1+ million students worldwide
1 out of 9
Related Documents

Your All-in-One AI-Powered Toolkit for Academic Success.
 +13062052269
info@desklib.com
Available 24*7 on WhatsApp / Email
Unlock your academic potential
Copyright © 2020–2025 A2Z Services. All Rights Reserved. Developed and managed by ZUCOL.