Comprehensive Financial Analysis Report of PETRONAS Dagangan Berhad
VerifiedAdded on 2023/06/10
|21
|3825
|73
Report
AI Summary
This report presents a financial analysis of PETRONAS Dagangan Berhad (PDB), a Malaysian retailer in the oil and gas sector. The analysis employs ratio analysis, examining liquidity, profitability, asset efficiency, capital structure, and market value ratios for 2016 and 2017. The report reveals improvements in PDB's current ratio, quick ratio, ROE, asset efficiency, and capital structure in 2017. A peer comparison indicates that PETRONAS performs well against competitors, but needs to focus on profitability and liquidity to outperform Exxon Mobil. The report concludes with recommendations based on the analysis.
RUNNING HEAD: ACCOUNTING FOR MANAGERS
Financial analysis
Financial analysis
Paraphrase This Document
Need a fresh take? Get an instant paraphrase of this document with our AI Paraphraser
Accounting for managers 2
Executive summary
The report provides a brief summary about the financial analysis of PETRONAS Dagangan
Berhad (PDB). First part of the report deals with the brief introduction of the company and
explains that it is a Malaysian retailer which is involved in the marketing and distribution of oil
and gas products. Further, the report discusses about the financial analysis technique named as
ratio analysis. It includes the calculation of several categorized ratios such as liquidity,
profitability and many more. It is observed that in 2017, the current ratio of the company
increased to 1.69 times along with the increase in its quick ratio worth 1.44 times. The
profitability position of the company has also improved overall during the same year as its ROE
turned out to be 25.58% in 2017, which was more than the ratio reported in 2016. The asset
efficiency and capital structure of the company has also improved and increased during the year.
In later part, the report compares the performance of PETRONAS with its key competitors. It is
observed that the firm has performed better as compare to its competitors but it has to focus more
on its profitability and liquidity position to beat and outperform its competitor Exxon Mobil. The
last part of the report deals with conclusion and recommendation made as per the whole analysis
done in the above sections.
Accounting for managers 3
Contents
Introduction.................................................................................................................................................4
Overview of the company............................................................................................................................4
Ratio analysis..............................................................................................................................................5
Liquidity ratio..........................................................................................................................................5
Profitability ratio.....................................................................................................................................7
Asset efficiency ratio...............................................................................................................................9
Capital structure ratio............................................................................................................................11
Market value ratio..................................................................................................................................12
Peer-entity comparison..............................................................................................................................14
Recommendation and Conclusion.............................................................................................................15
References.................................................................................................................................................16
Appendix...................................................................................................................................................18
⊘ This is a preview!⊘
Do you want full access?
Subscribe today to unlock all pages.
Trusted by 1+ million students worldwide
Accounting for managers 4
Introduction
Financial statement analysis deals with evaluation of company’s financial data presented in its
annual reports in order to measure and assess its position and performance during a specific
accounting period. It includes the assessment of past year data on the basis of which the future
growth of the organization is estimated and projected by the management.
The report contains a financial analysis of a Malaysian company named as PETRONAS
Dagangan Berhad (PDB). A brief introduction about the firm is provided in the first part of the
report followed by the ratio analysis in second. The report explains the calculation and
interpretation of various categories of ratios based on the financial data of PETRONAS for year
2016 and 2017. In the later part, peer review analysis is also conducted where the selected
organization is compared with its competitors in the industry to measure and evaluate its
performance against them. In the last, a recommendation is provided regarding the financial
position of PETRONAS followed by the conclusion in the end.
Overview of the company
PETRONAS Dagangan Berhad is a Malaysia based company that deals in the retailing and
marketing of oil and gas products. The company operates through commercial, retail and other
segments. It also offers petroleum products including aviation fuel, kerosene, diesel, fuel oil,
motor gasoline and many others. Further, the firm is also engaged in providing lubricants to its
customers across the country. The products include passenger car motor oils, marine lubricants,
automotive functional fluids, automotive gear oils and many others. Other business of the
Paraphrase This Document
Need a fresh take? Get an instant paraphrase of this document with our AI Paraphraser
Accounting for managers 5
company includes supermarkets, banking facility, food and restaurant services, courier and car
wash services (Bloomberg 2018).
The company was found in 1982 and is almost seventy percent owned by Malaysia’s national oil
company, PETRONAS (Petroliam Nasional Berhad). The products and services are sold and
offered through approximately 1000 PETRONAS stations and 760 Kedai Mesra convenience
stores. It owns a network of infrastructure assets which is located throughout the country to
stimulate the distribution of its oil products including pipelines, petroleum gases and many
others. Mainly the firm supplies motor gasoline and diesel to the retail market and commercially
it distributes jet fuel along with the products of smaller volume such as bitumen, sulphur and
petroleum coke. It is listed on Malaysian stock exchange and has its headquarters situated at
Kuala Lumpur, Malaysia (Bloomberg. 2018).
Ratio analysis
It is a technique of financial analysis which focuses on reflecting the entire performance of the
enterprise in a nutshell to the potential investors and management of the company. It deals with
the calculation of several ratios that covers all the aspects in financial terms. Ratio analysis is
performed on the basis of the quantitative data presented in the financial statements of the
company. Usually, many investors look up to the key ratios of the entity to measure and evaluate
its past performance so as to forecast its future growth and position (Bragg, 2012). There are five
categories of ratios which are been calculated and interpreted further in the section and they help
understanding the position of PETRONAS easily.
Accounting for managers 6
Liquidity ratio
This category deals with the measurement of company’s liquidity position by analysing the fact
that how efficiently it manages and utilize its liquid assets to meet its short term debt. The ratios
show the working capital management of the firm (Godwin & Alderman, 2012).
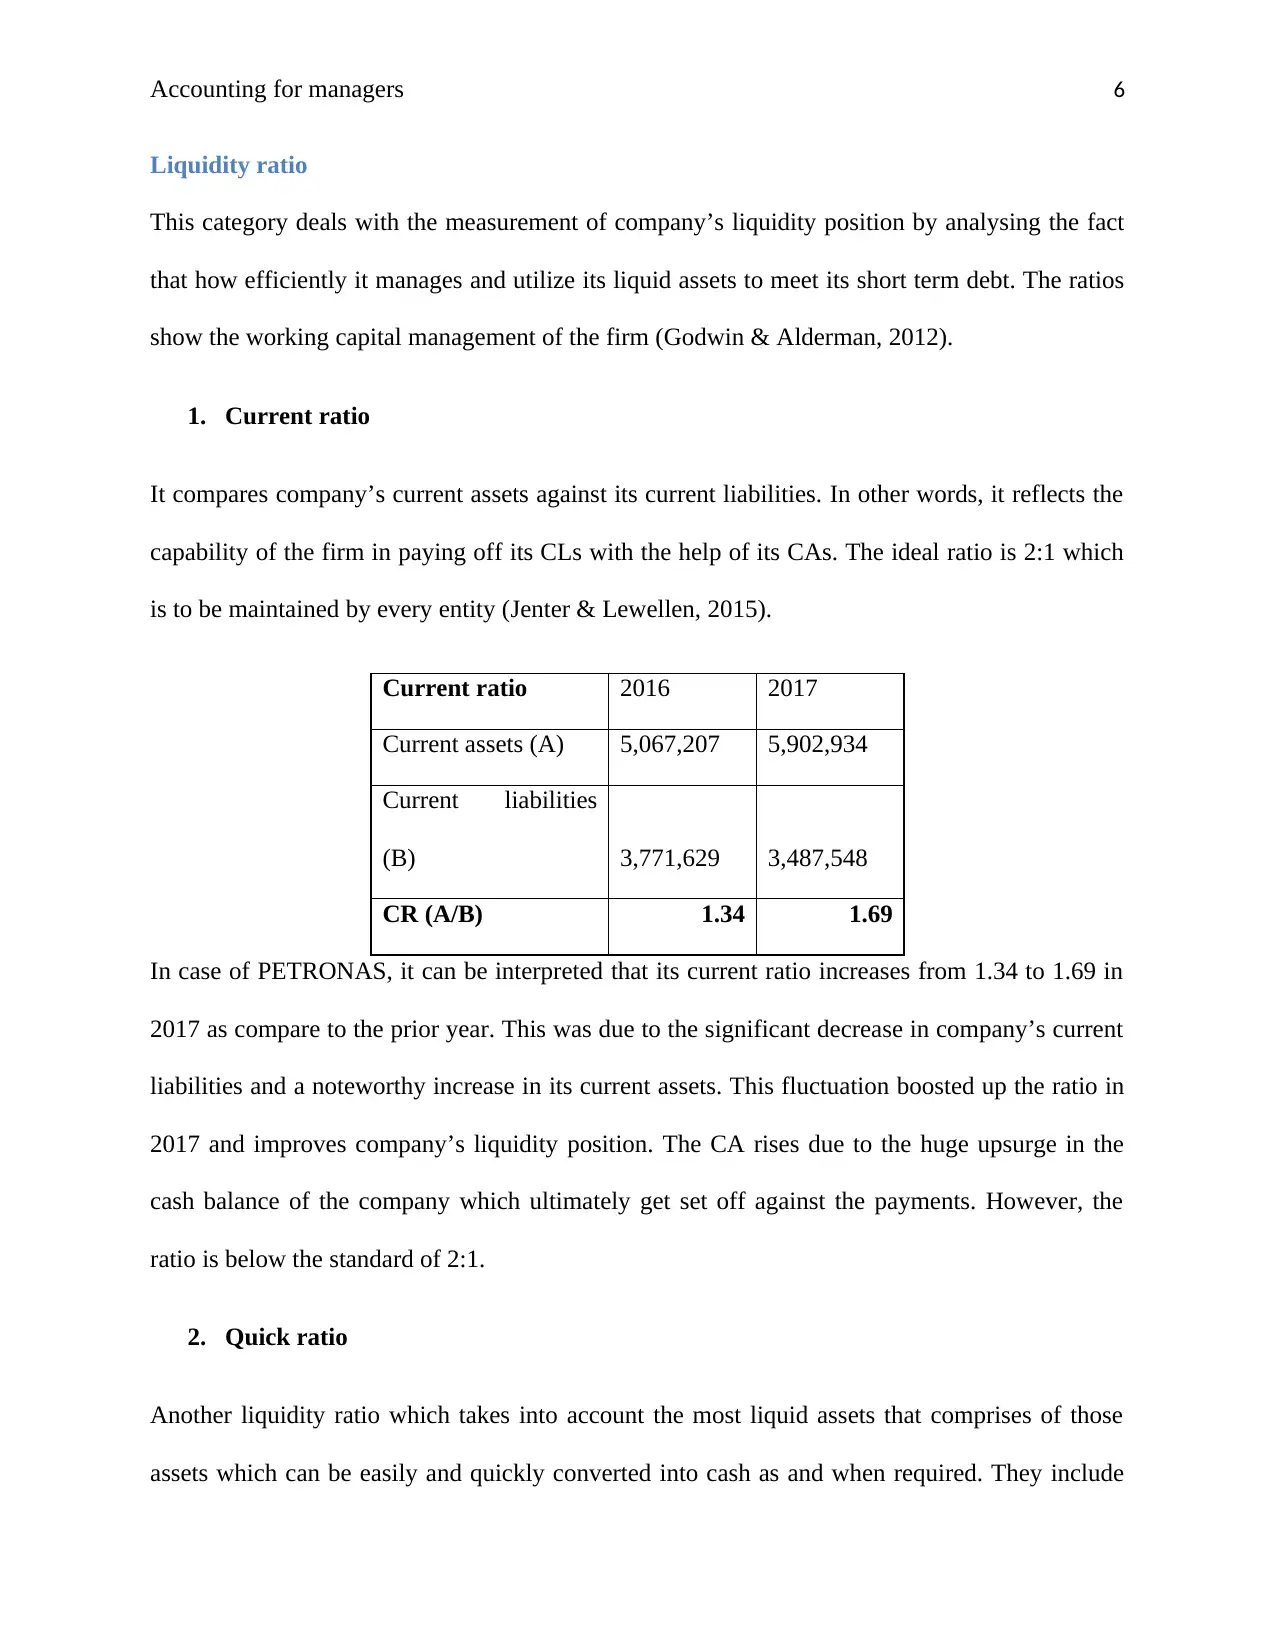
1. Current ratio
It compares company’s current assets against its current liabilities. In other words, it reflects the
capability of the firm in paying off its CLs with the help of its CAs. The ideal ratio is 2:1 which
is to be maintained by every entity (Jenter & Lewellen, 2015).
Current ratio 2016 2017
Current assets (A) 5,067,207 5,902,934
Current liabilities
(B) 3,771,629 3,487,548
CR (A/B) 1.34 1.69
In case of PETRONAS, it can be interpreted that its current ratio increases from 1.34 to 1.69 in
2017 as compare to the prior year. This was due to the significant decrease in company’s current
liabilities and a noteworthy increase in its current assets. This fluctuation boosted up the ratio in
2017 and improves company’s liquidity position. The CA rises due to the huge upsurge in the
cash balance of the company which ultimately get set off against the payments. However, the
ratio is below the standard of 2:1.
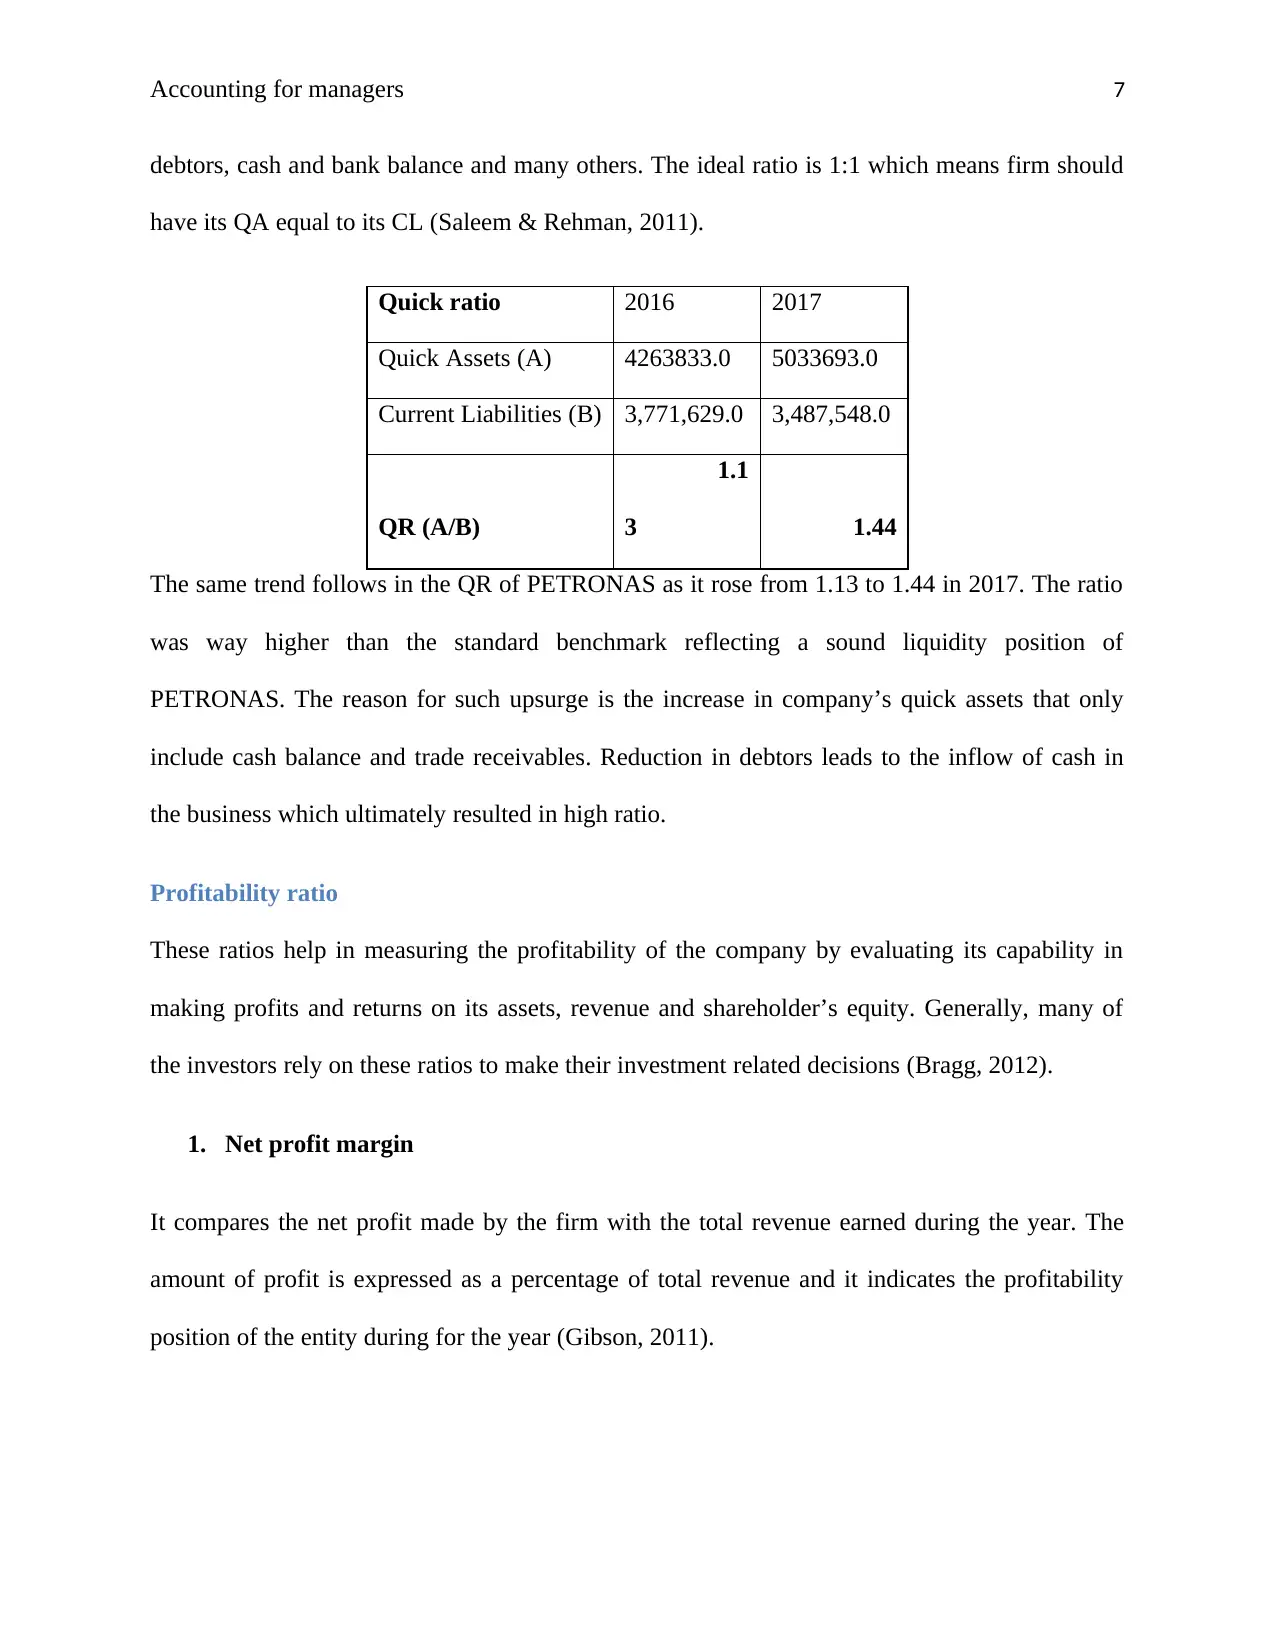
2. Quick ratio
Another liquidity ratio which takes into account the most liquid assets that comprises of those
assets which can be easily and quickly converted into cash as and when required. They include
Liquidity ratio
This category deals with the measurement of company’s liquidity position by analysing the fact
that how efficiently it manages and utilize its liquid assets to meet its short term debt. The ratios
show the working capital management of the firm (Godwin & Alderman, 2012).
1. Current ratio
It compares company’s current assets against its current liabilities. In other words, it reflects the
capability of the firm in paying off its CLs with the help of its CAs. The ideal ratio is 2:1 which
is to be maintained by every entity (Jenter & Lewellen, 2015).
Current ratio 2016 2017
Current assets (A) 5,067,207 5,902,934
Current liabilities
(B) 3,771,629 3,487,548
CR (A/B) 1.34 1.69
In case of PETRONAS, it can be interpreted that its current ratio increases from 1.34 to 1.69 in
2017 as compare to the prior year. This was due to the significant decrease in company’s current
liabilities and a noteworthy increase in its current assets. This fluctuation boosted up the ratio in
2017 and improves company’s liquidity position. The CA rises due to the huge upsurge in the
cash balance of the company which ultimately get set off against the payments. However, the
ratio is below the standard of 2:1.
2. Quick ratio
Another liquidity ratio which takes into account the most liquid assets that comprises of those
assets which can be easily and quickly converted into cash as and when required. They include
⊘ This is a preview!⊘
Do you want full access?
Subscribe today to unlock all pages.
Trusted by 1+ million students worldwide
Accounting for managers 7
debtors, cash and bank balance and many others. The ideal ratio is 1:1 which means firm should
have its QA equal to its CL (Saleem & Rehman, 2011).
Quick ratio 2016 2017
Quick Assets (A) 4263833.0 5033693.0
Current Liabilities (B) 3,771,629.0 3,487,548.0
QR (A/B)
1.1
3 1.44
The same trend follows in the QR of PETRONAS as it rose from 1.13 to 1.44 in 2017. The ratio
was way higher than the standard benchmark reflecting a sound liquidity position of
PETRONAS. The reason for such upsurge is the increase in company’s quick assets that only
include cash balance and trade receivables. Reduction in debtors leads to the inflow of cash in
the business which ultimately resulted in high ratio.
Profitability ratio
These ratios help in measuring the profitability of the company by evaluating its capability in
making profits and returns on its assets, revenue and shareholder’s equity. Generally, many of
the investors rely on these ratios to make their investment related decisions (Bragg, 2012).
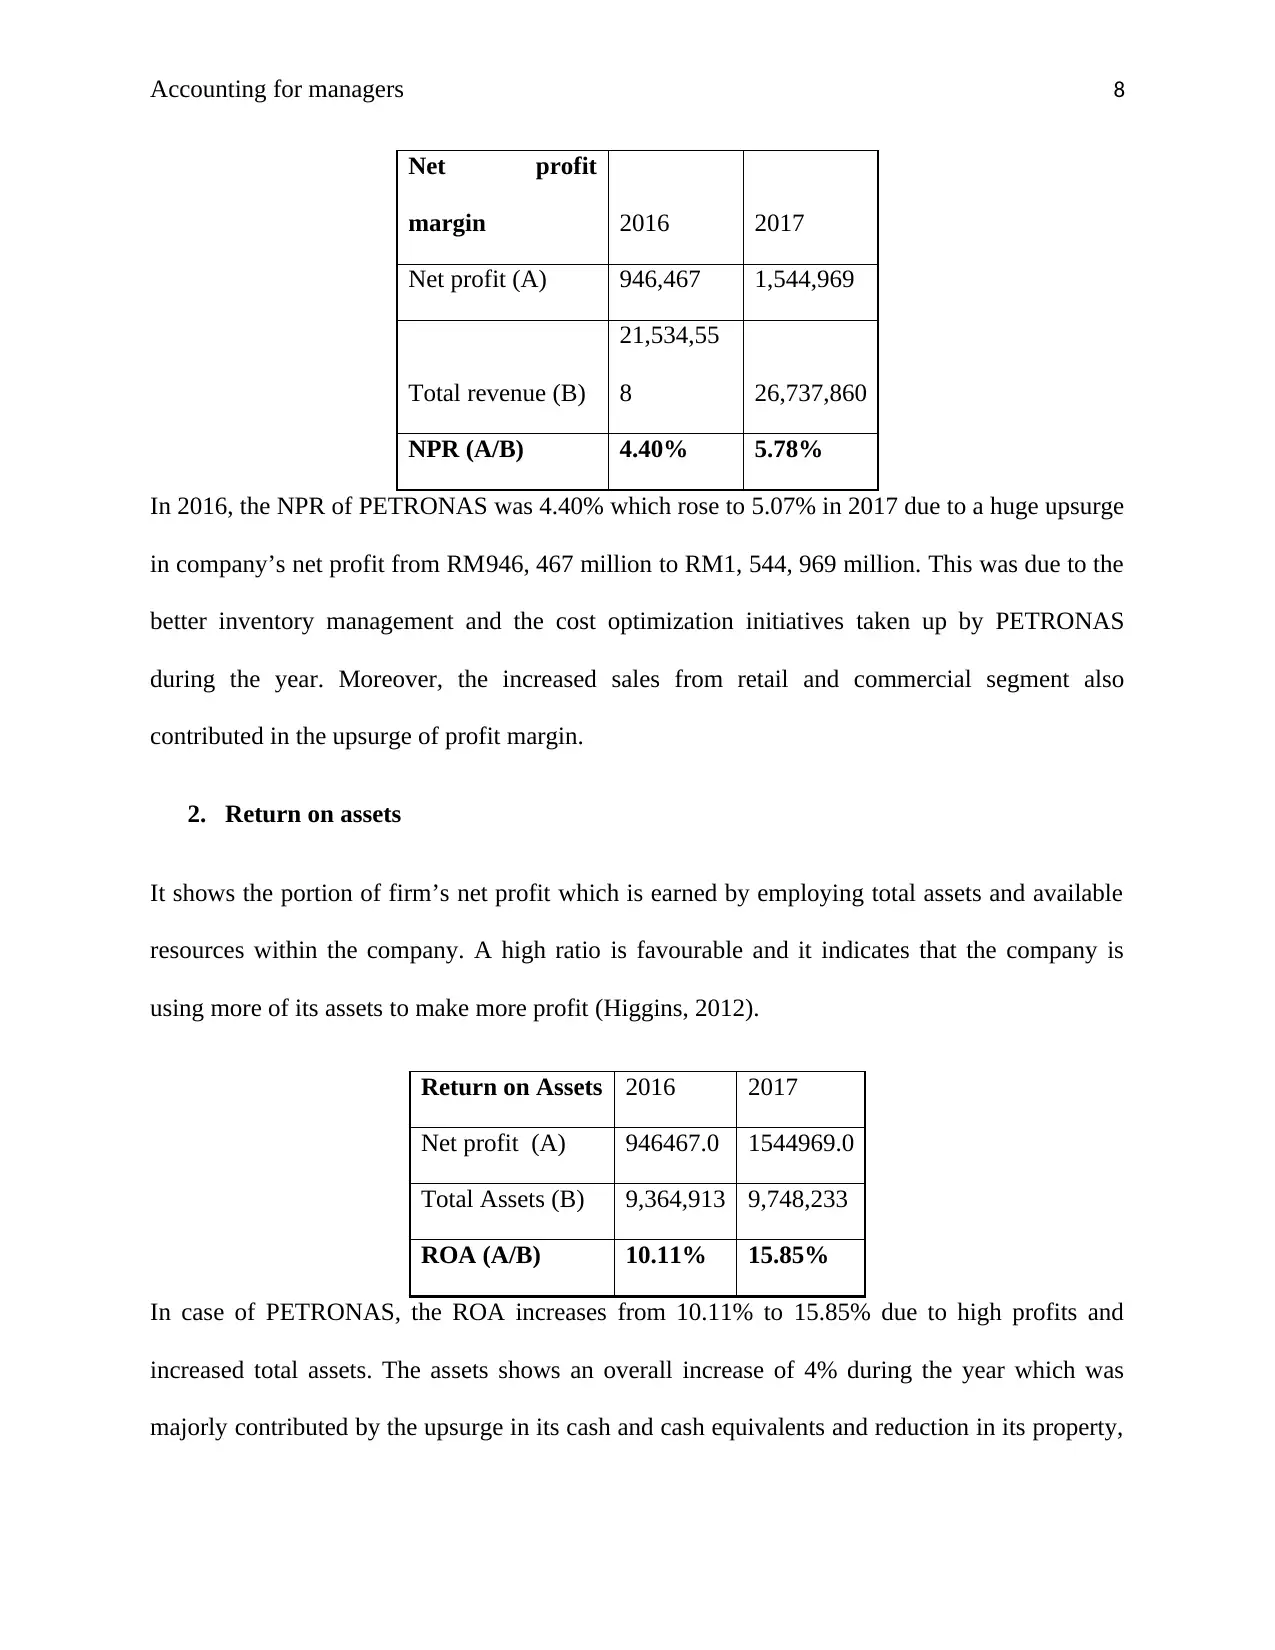
1. Net profit margin
It compares the net profit made by the firm with the total revenue earned during the year. The
amount of profit is expressed as a percentage of total revenue and it indicates the profitability
position of the entity during for the year (Gibson, 2011).
debtors, cash and bank balance and many others. The ideal ratio is 1:1 which means firm should
have its QA equal to its CL (Saleem & Rehman, 2011).
Quick ratio 2016 2017
Quick Assets (A) 4263833.0 5033693.0
Current Liabilities (B) 3,771,629.0 3,487,548.0
QR (A/B)
1.1
3 1.44
The same trend follows in the QR of PETRONAS as it rose from 1.13 to 1.44 in 2017. The ratio
was way higher than the standard benchmark reflecting a sound liquidity position of
PETRONAS. The reason for such upsurge is the increase in company’s quick assets that only
include cash balance and trade receivables. Reduction in debtors leads to the inflow of cash in
the business which ultimately resulted in high ratio.
Profitability ratio
These ratios help in measuring the profitability of the company by evaluating its capability in
making profits and returns on its assets, revenue and shareholder’s equity. Generally, many of
the investors rely on these ratios to make their investment related decisions (Bragg, 2012).
1. Net profit margin
It compares the net profit made by the firm with the total revenue earned during the year. The
amount of profit is expressed as a percentage of total revenue and it indicates the profitability
position of the entity during for the year (Gibson, 2011).
Paraphrase This Document
Need a fresh take? Get an instant paraphrase of this document with our AI Paraphraser
Accounting for managers 8
Net profit
margin 2016 2017
Net profit (A) 946,467 1,544,969
Total revenue (B)
21,534,55
8 26,737,860
NPR (A/B) 4.40% 5.78%
In 2016, the NPR of PETRONAS was 4.40% which rose to 5.07% in 2017 due to a huge upsurge
in company’s net profit from RM946, 467 million to RM1, 544, 969 million. This was due to the
better inventory management and the cost optimization initiatives taken up by PETRONAS
during the year. Moreover, the increased sales from retail and commercial segment also
contributed in the upsurge of profit margin.
2. Return on assets
It shows the portion of firm’s net profit which is earned by employing total assets and available
resources within the company. A high ratio is favourable and it indicates that the company is
using more of its assets to make more profit (Higgins, 2012).
Return on Assets 2016 2017
Net profit (A) 946467.0 1544969.0
Total Assets (B) 9,364,913 9,748,233
ROA (A/B) 10.11% 15.85%
In case of PETRONAS, the ROA increases from 10.11% to 15.85% due to high profits and
increased total assets. The assets shows an overall increase of 4% during the year which was
majorly contributed by the upsurge in its cash and cash equivalents and reduction in its property,

Accounting for managers 9
plant and equipment. The disposal of subsidiary’s property also increased company’s total assets.
All such events led to the hike in PETRONAS’s ROA for the year 2017 (PETRONAS. 2017).
3. Return on equity
It measures the amount of return offered by the company to its shareholders on the portion of
their capital invested in the business. A high ROE is considered more favourable than the lower
one from investors’ view point (Krantz & Johnson, 2014).
Return on Equity 2016 2017
Net income available to shareholders
(A) 946467.0 1544969.0
Shareholder's equity (B) 5,336,526 6,040,681
ROE (A/B) 17.74% 25.58%
The ROE of PETRONAS has shown a noteworthy increase from 17.74% to 25.58% in the past
two years. The only reason for such hike was the increased profits and equity capital of the firm.
As PETRONAS has made huge profits in 2017, it offer high returns to its shareholders which
ultimately attracted many of the investors towards the company. All this eventually enhances its
profitability position (PETRONAS. 2017).
Asset efficiency ratio
These ratios are also known as turnover or activity ratios which deal with the evaluation and
measurement of company’s efficiency in generating revenue from its assets. The ratios reflect
how efficiently and effectively a firm uses its assets for the purpose of making revenue (Kimmel,
Weygandt & Kieso, 2010).
⊘ This is a preview!⊘
Do you want full access?
Subscribe today to unlock all pages.
Trusted by 1+ million students worldwide
Accounting for managers 10
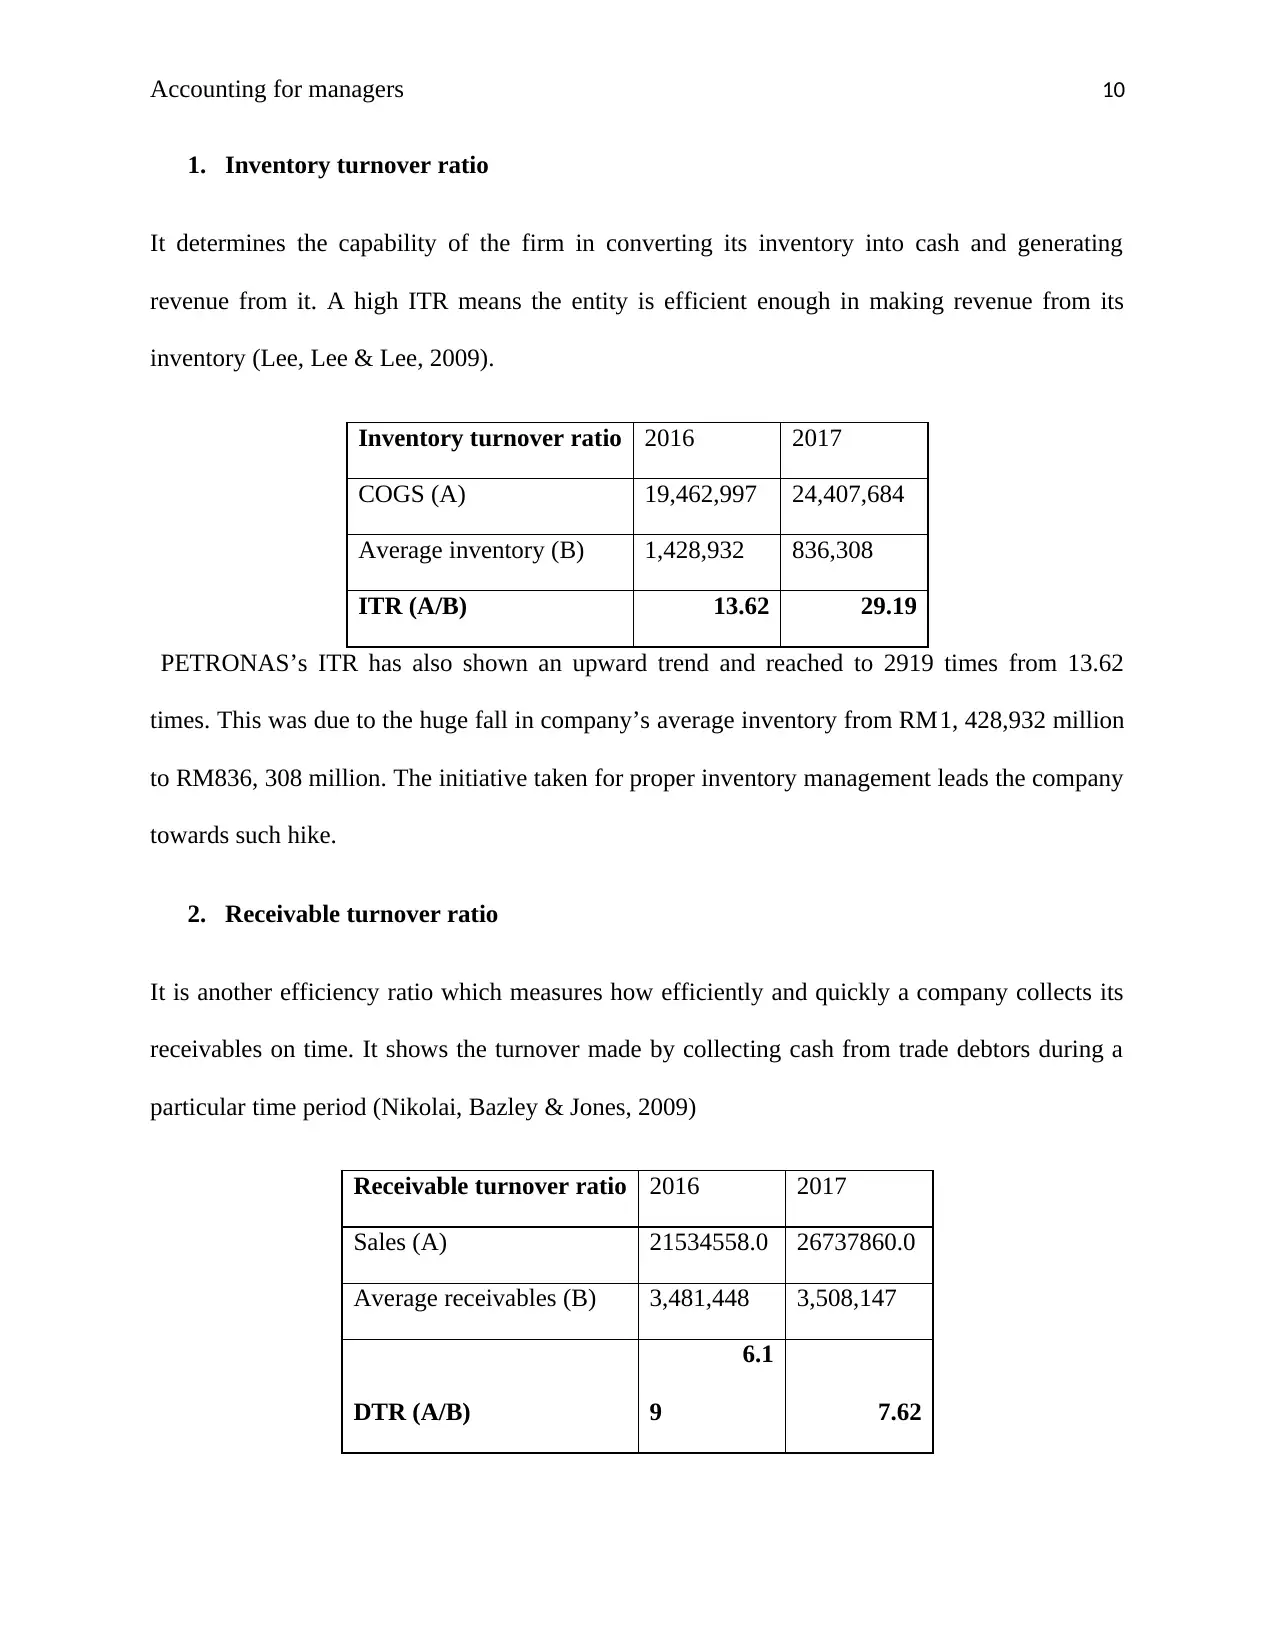
1. Inventory turnover ratio
It determines the capability of the firm in converting its inventory into cash and generating
revenue from it. A high ITR means the entity is efficient enough in making revenue from its
inventory (Lee, Lee & Lee, 2009).
Inventory turnover ratio 2016 2017
COGS (A) 19,462,997 24,407,684
Average inventory (B) 1,428,932 836,308
ITR (A/B) 13.62 29.19
PETRONAS’s ITR has also shown an upward trend and reached to 2919 times from 13.62
times. This was due to the huge fall in company’s average inventory from RM1, 428,932 million
to RM836, 308 million. The initiative taken for proper inventory management leads the company
towards such hike.
2. Receivable turnover ratio
It is another efficiency ratio which measures how efficiently and quickly a company collects its
receivables on time. It shows the turnover made by collecting cash from trade debtors during a
particular time period (Nikolai, Bazley & Jones, 2009)
Receivable turnover ratio 2016 2017
Sales (A) 21534558.0 26737860.0
Average receivables (B) 3,481,448 3,508,147
DTR (A/B)
6.1
9 7.62
Paraphrase This Document
Need a fresh take? Get an instant paraphrase of this document with our AI Paraphraser
Accounting for managers 11
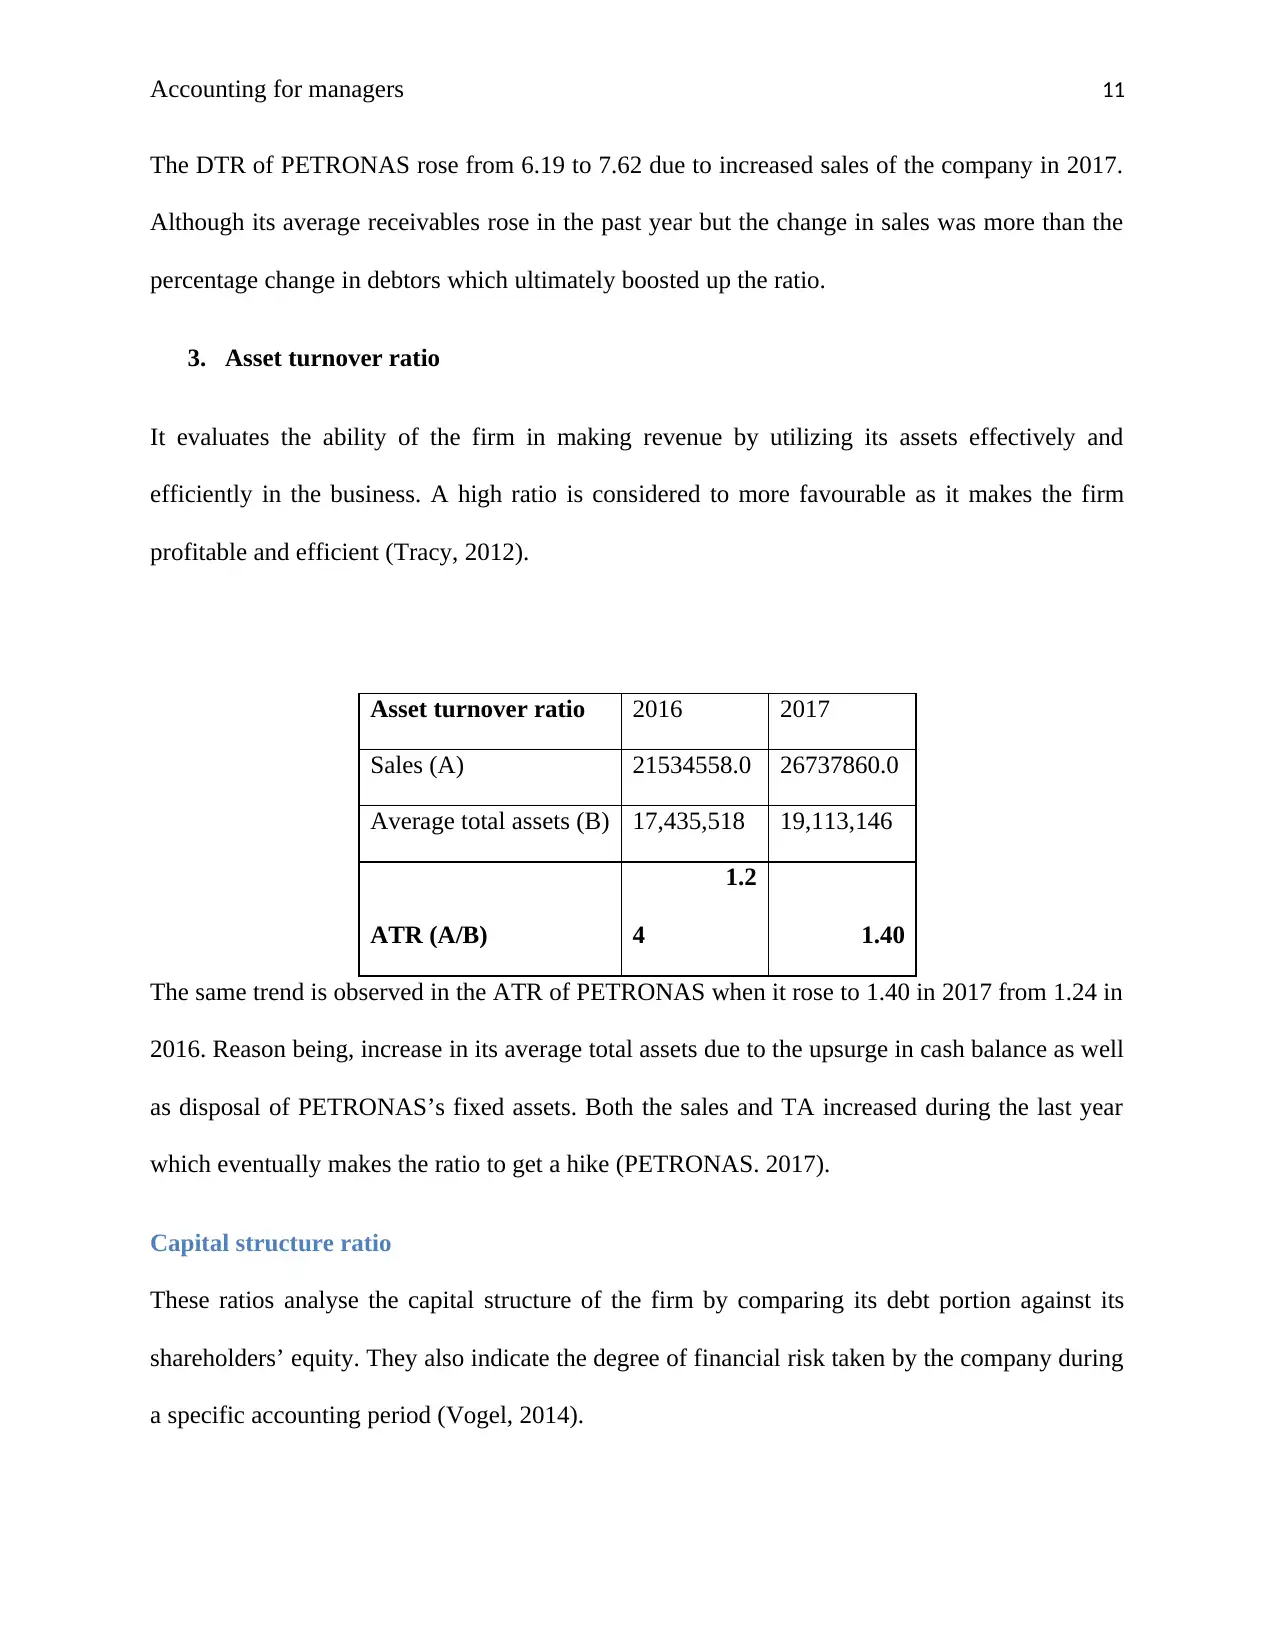
The DTR of PETRONAS rose from 6.19 to 7.62 due to increased sales of the company in 2017.
Although its average receivables rose in the past year but the change in sales was more than the
percentage change in debtors which ultimately boosted up the ratio.
3. Asset turnover ratio
It evaluates the ability of the firm in making revenue by utilizing its assets effectively and
efficiently in the business. A high ratio is considered to more favourable as it makes the firm
profitable and efficient (Tracy, 2012).
Asset turnover ratio 2016 2017
Sales (A) 21534558.0 26737860.0
Average total assets (B) 17,435,518 19,113,146
ATR (A/B)
1.2
4 1.40
The same trend is observed in the ATR of PETRONAS when it rose to 1.40 in 2017 from 1.24 in
2016. Reason being, increase in its average total assets due to the upsurge in cash balance as well
as disposal of PETRONAS’s fixed assets. Both the sales and TA increased during the last year
which eventually makes the ratio to get a hike (PETRONAS. 2017).
Capital structure ratio
These ratios analyse the capital structure of the firm by comparing its debt portion against its
shareholders’ equity. They also indicate the degree of financial risk taken by the company during
a specific accounting period (Vogel, 2014).
Accounting for managers 12
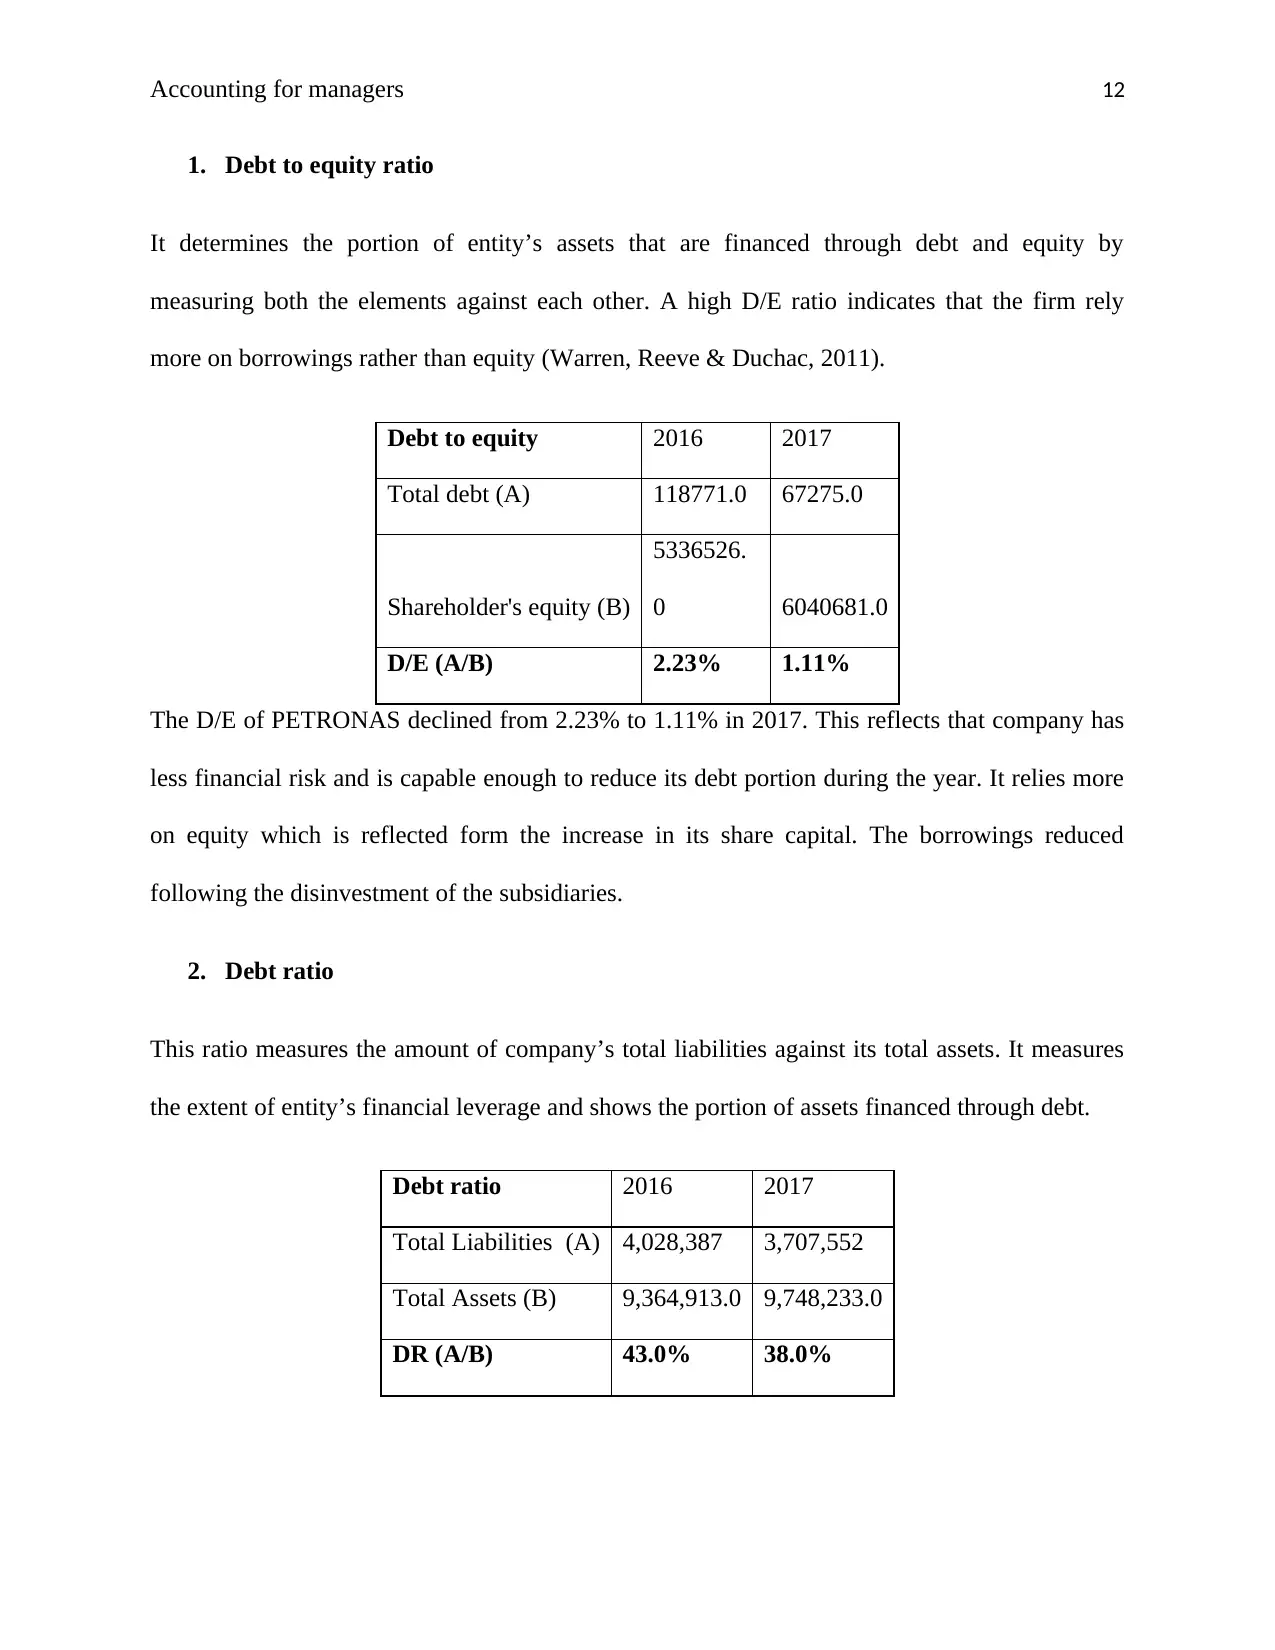
1. Debt to equity ratio
It determines the portion of entity’s assets that are financed through debt and equity by
measuring both the elements against each other. A high D/E ratio indicates that the firm rely
more on borrowings rather than equity (Warren, Reeve & Duchac, 2011).
Debt to equity 2016 2017
Total debt (A) 118771.0 67275.0
Shareholder's equity (B)
5336526.
0 6040681.0
D/E (A/B) 2.23% 1.11%
The D/E of PETRONAS declined from 2.23% to 1.11% in 2017. This reflects that company has
less financial risk and is capable enough to reduce its debt portion during the year. It relies more
on equity which is reflected form the increase in its share capital. The borrowings reduced
following the disinvestment of the subsidiaries.
2. Debt ratio
This ratio measures the amount of company’s total liabilities against its total assets. It measures
the extent of entity’s financial leverage and shows the portion of assets financed through debt.
Debt ratio 2016 2017
Total Liabilities (A) 4,028,387 3,707,552
Total Assets (B) 9,364,913.0 9,748,233.0
DR (A/B) 43.0% 38.0%
⊘ This is a preview!⊘
Do you want full access?
Subscribe today to unlock all pages.
Trusted by 1+ million students worldwide
1 out of 21
Related Documents


Your All-in-One AI-Powered Toolkit for Academic Success.
+13062052269
info@desklib.com
Available 24*7 on WhatsApp / Email
![[object Object]](/_next/static/media/star-bottom.7253800d.svg)
Unlock your academic potential
Copyright © 2020–2026 A2Z Services. All Rights Reserved. Developed and managed by ZUCOL.