BSMAN3009 - Financial Ratio Analysis of Petronas for 2016 and 2017
VerifiedAdded on 2023/06/03
|23
|4207
|231
Report
AI Summary
This report provides a financial ratio analysis of Petronas, a Malaysian oil and gas company, for the years 2016 and 2017. The analysis encompasses profitability ratios (net profit, return on assets, and return on equity), asset efficiency ratios (average collection period and days inventory outstanding), liquidity analysis (current and quick ratios), capital structure analysis (debt-to-equity ratio), and market performance. The study reveals a significant improvement in Petronas' financial performance in 2017 compared to 2016, with increases in profitability and asset efficiency, indicating effective resource management. The report highlights the importance and limitations of ratio analysis, providing valuable insights into Petronas' financial health and operational effectiveness. Data is presented in RM million, and the report references relevant financial accounting literature.
1
Assessment task 2: Individual report
Assessment task 2: Individual report
Paraphrase This Document
Need a fresh take? Get an instant paraphrase of this document with our AI Paraphraser
2
Executive Summary
Financial ratio analysis is the most important part of accounting and finance as it is used
to analyse the performance of entity and also allow the comparison between companies present
report has been drafted to perform the ratio analysis of Petronas, a famous company in Malaysia
that deals in oil and gas production and exploration. In this report, profitability, liquidity
position, capital structure, market performance, and efficiency of company has been evaluated
through use of ratios. It has been found that Petronas has very strong financial performance in
year 2017 as compared to year 2016.
3
Contents
Executive Summary.........................................................................................................................2
Introduction......................................................................................................................................4
Financial Ratio Analysis of Petronas for year 2016 and 2017........................................................4
Meaning, importance and limitations of ratio analysis....................................................................4
Profitability Analysis of Petronas (All data has been presented in RM million)............................5
Asset Efficiency Analysis (All data has been presented in RM million)........................................8
Liquidity Analysis (Short term solvency analysis) (All data has been presented in RM million) 10
Capital Structure Analysis (All data has been presented in RM million)......................................12
Market Performance (All data has been presented in RM million)...............................................14
Conclusion.....................................................................................................................................15
References......................................................................................................................................17
Appendix........................................................................................................................................18
⊘ This is a preview!⊘
Do you want full access?
Subscribe today to unlock all pages.
Trusted by 1+ million students worldwide
4
Introduction
This report is developed for carrying out financial analysis of a recognized public-listed
company by adopting the use of its recently published annual reports. The financial analysis of
the selected company is undertaken with the use of ratio analysis technique that helps in carrying
out an evaluation of the profitability, asset efficiency, liquidity, and capital structure and market
performance. In this context, the company selected is Petronas, an integrated oil and gas
multinational company of Malaysia that has attained higher position within the Fortune Global
list. The financial ratio analysis of the company has been calculated with the use of financial
reports of the company over the last two financial years.
Financial Ratio Analysis of Petronas for year 2016 and 2017
Meaning, importance and limitations of ratio analysis
Ratio analysis is the important method in accounting and finance used to evaluate the
financial performance of an entity through examining and comparing the financial information
provided in the annual report of such entity. The information gathered through performing the
ratio analysis is used by management and investor to make useful decisions. Management use
ratio analysis to evaluate their efficiency, liquidity performance, leverage position and market
performance during the particular period. On the other had investors use information gathered
from the ratio analysis to make investment decisions. Investors are mainly concerned for
organization profitability, holding period return and market performance as main motive is to
maximize their own wealth. So it can be said that ratio analysis is one of best tool measure the
profitability, operational efficiency, liquidity performance, financial strength, and market
performance of the company and also allow the comparison.
There are numerous uses of ratio analysis in business as it helps in simplifying the
complex accounting statement and other financial data into simple ratio that can be easily
understood by the management and investor to take the required decision. Through the
application or use of ratio analysis management can identify the problems and issues in various
areas. In this way management can take appropriate steps to solve the issues at proper time. Ratio
Paraphrase This Document
Need a fresh take? Get an instant paraphrase of this document with our AI Paraphraser
5
analysis allows comparing the financial data with competitors or industry average that helps the
management to rank the company in the respective sector and take steps to improve the
performance (Higgins, 2012).
There are limitations of ratio analysis that comes across while making analysis of
financial statements. Ratio analysis uses historical data to make interpretation of financial
performance. It does not mean that same values of ratio will be carried forward in next year. For
this purpose, forecast financial statement can be used for performing ratio analysis and results
derived can be compared with the historical results for consistency.
Ratio analysis can be divided into five major segments that are underline below:
Profitability analysis
Asset efficiency analysis
Liquidity Analysis
Capital Structure Analysis
Market performance
Profitability Analysis of Petronas (All data has been presented in RM million)
Profitability analysis is the most important ratio analysis that measures the entity ability
to earn the profits in relation to sales, assets and equity. The purpose of profitability analysis is to
check the ability of company to earn the revenue in relation to some metric. Purpose is to check
how much resources have used by the company to earn the revenue. Some of important
profitability ratios are net profit ratio, return on assets, return on equity and return on capital
employed. It means profitability analysis helps to analysis how well company is performing in
generating the profits in relation to certain measure like amount of investment.
Ratios Formula 2016 2017
Profitability Ratios
Net profit Ratio Net profit (After tax)
/Revenue or sales 12.18% 20.35%
Return on assets Net profit (After tax) /
Average Total Assets 3.98% 7.57%
6
Return on equity
Net profit (After tax) /
Average Shareholder's
Equity
5.66% 10.63%
(Annual Report, 2017 and Annual Report, 2016)
(Note: Financial Data can be located at appendix section of this report)
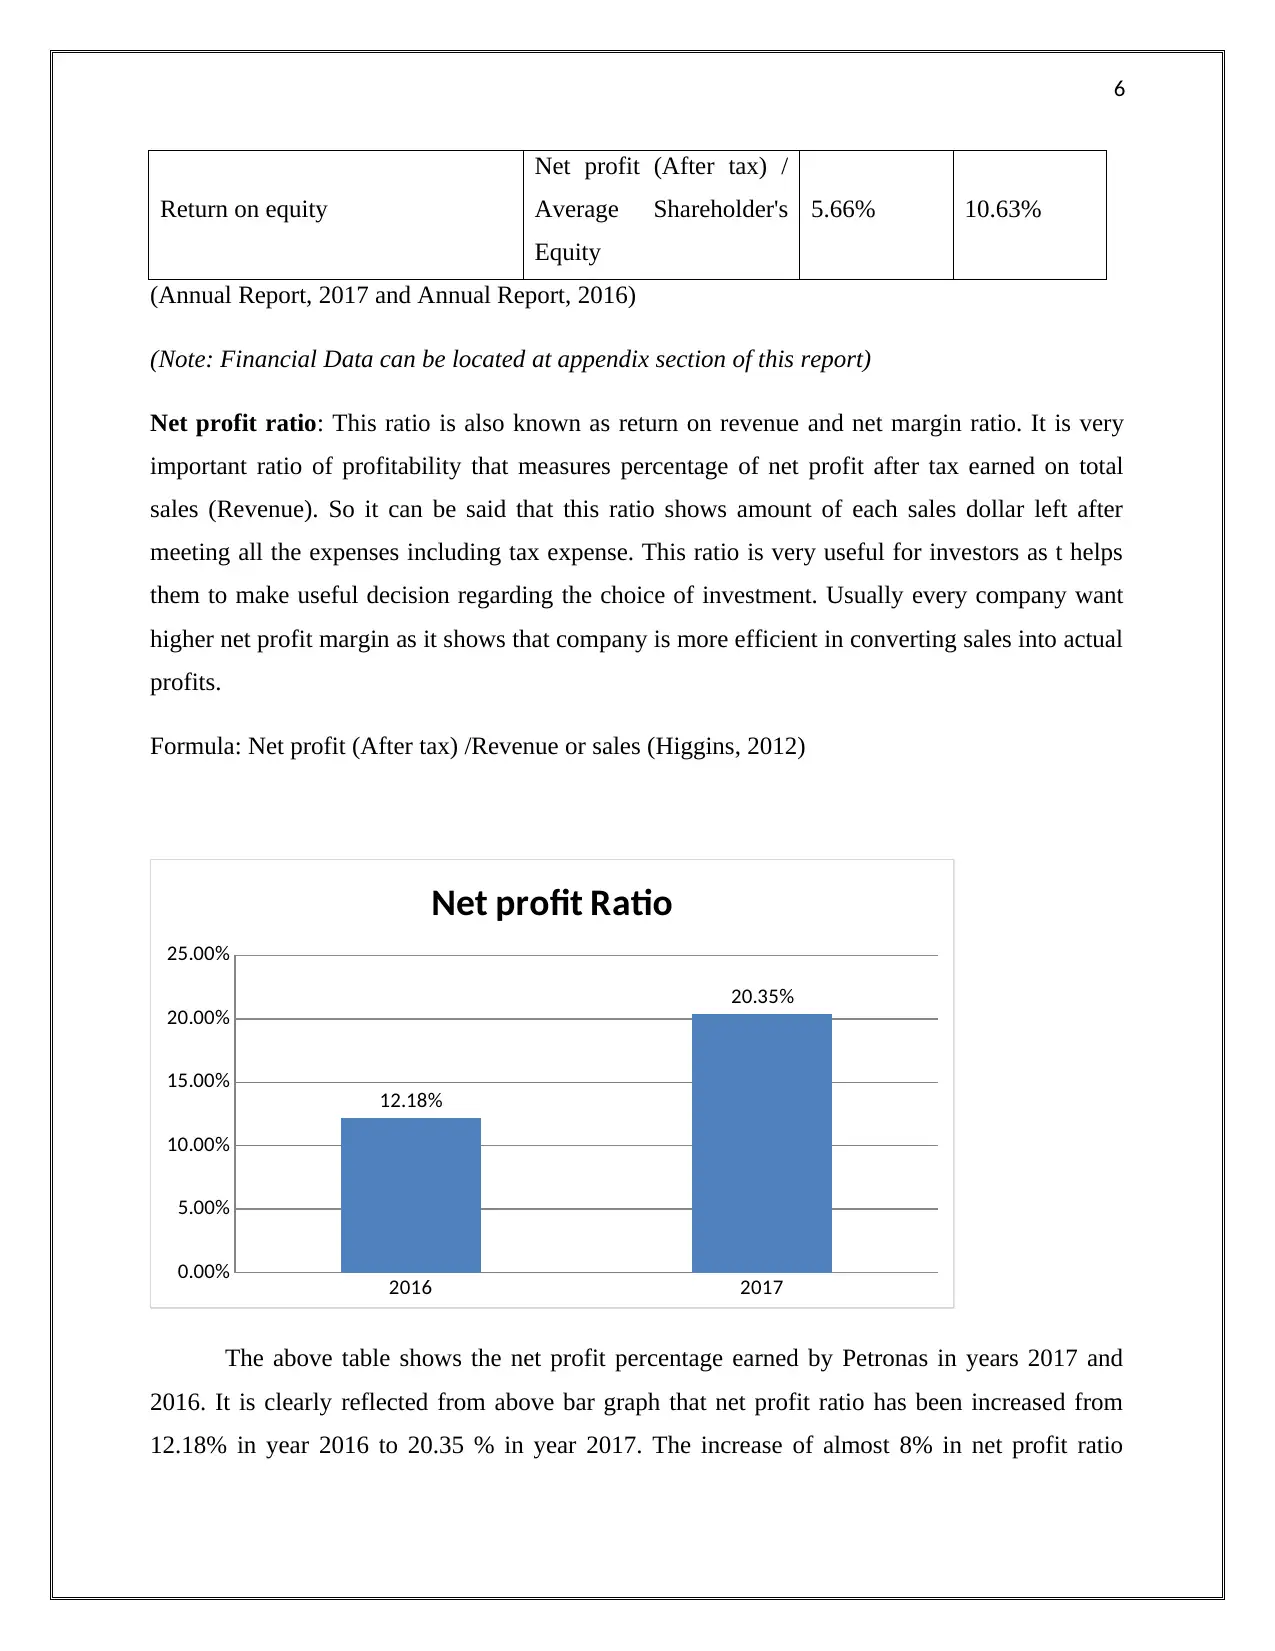
Net profit ratio: This ratio is also known as return on revenue and net margin ratio. It is very
important ratio of profitability that measures percentage of net profit after tax earned on total
sales (Revenue). So it can be said that this ratio shows amount of each sales dollar left after
meeting all the expenses including tax expense. This ratio is very useful for investors as t helps
them to make useful decision regarding the choice of investment. Usually every company want
higher net profit margin as it shows that company is more efficient in converting sales into actual
profits.
Formula: Net profit (After tax) /Revenue or sales (Higgins, 2012)
2016 2017
0.00%
5.00%
10.00%
15.00%
20.00%
25.00%
12.18%
20.35%
Net profit Ratio
The above table shows the net profit percentage earned by Petronas in years 2017 and
2016. It is clearly reflected from above bar graph that net profit ratio has been increased from
12.18% in year 2016 to 20.35 % in year 2017. The increase of almost 8% in net profit ratio
Return on equity
Net profit (After tax) /
Average Shareholder's
Equity
5.66% 10.63%
(Annual Report, 2017 and Annual Report, 2016)
(Note: Financial Data can be located at appendix section of this report)
Net profit ratio: This ratio is also known as return on revenue and net margin ratio. It is very
important ratio of profitability that measures percentage of net profit after tax earned on total
sales (Revenue). So it can be said that this ratio shows amount of each sales dollar left after
meeting all the expenses including tax expense. This ratio is very useful for investors as t helps
them to make useful decision regarding the choice of investment. Usually every company want
higher net profit margin as it shows that company is more efficient in converting sales into actual
profits.
Formula: Net profit (After tax) /Revenue or sales (Higgins, 2012)
2016 2017
0.00%
5.00%
10.00%
15.00%
20.00%
25.00%
12.18%
20.35%
Net profit Ratio
The above table shows the net profit percentage earned by Petronas in years 2017 and
2016. It is clearly reflected from above bar graph that net profit ratio has been increased from
12.18% in year 2016 to 20.35 % in year 2017. The increase of almost 8% in net profit ratio
⊘ This is a preview!⊘
Do you want full access?
Subscribe today to unlock all pages.
Trusted by 1+ million students worldwide
7
during year 2017 reflects great improvement in ability of management to utilize resources in
optimum manner earn the revenue. Net profit ratio shows an increasing trend in profitability
performance of Petronas.
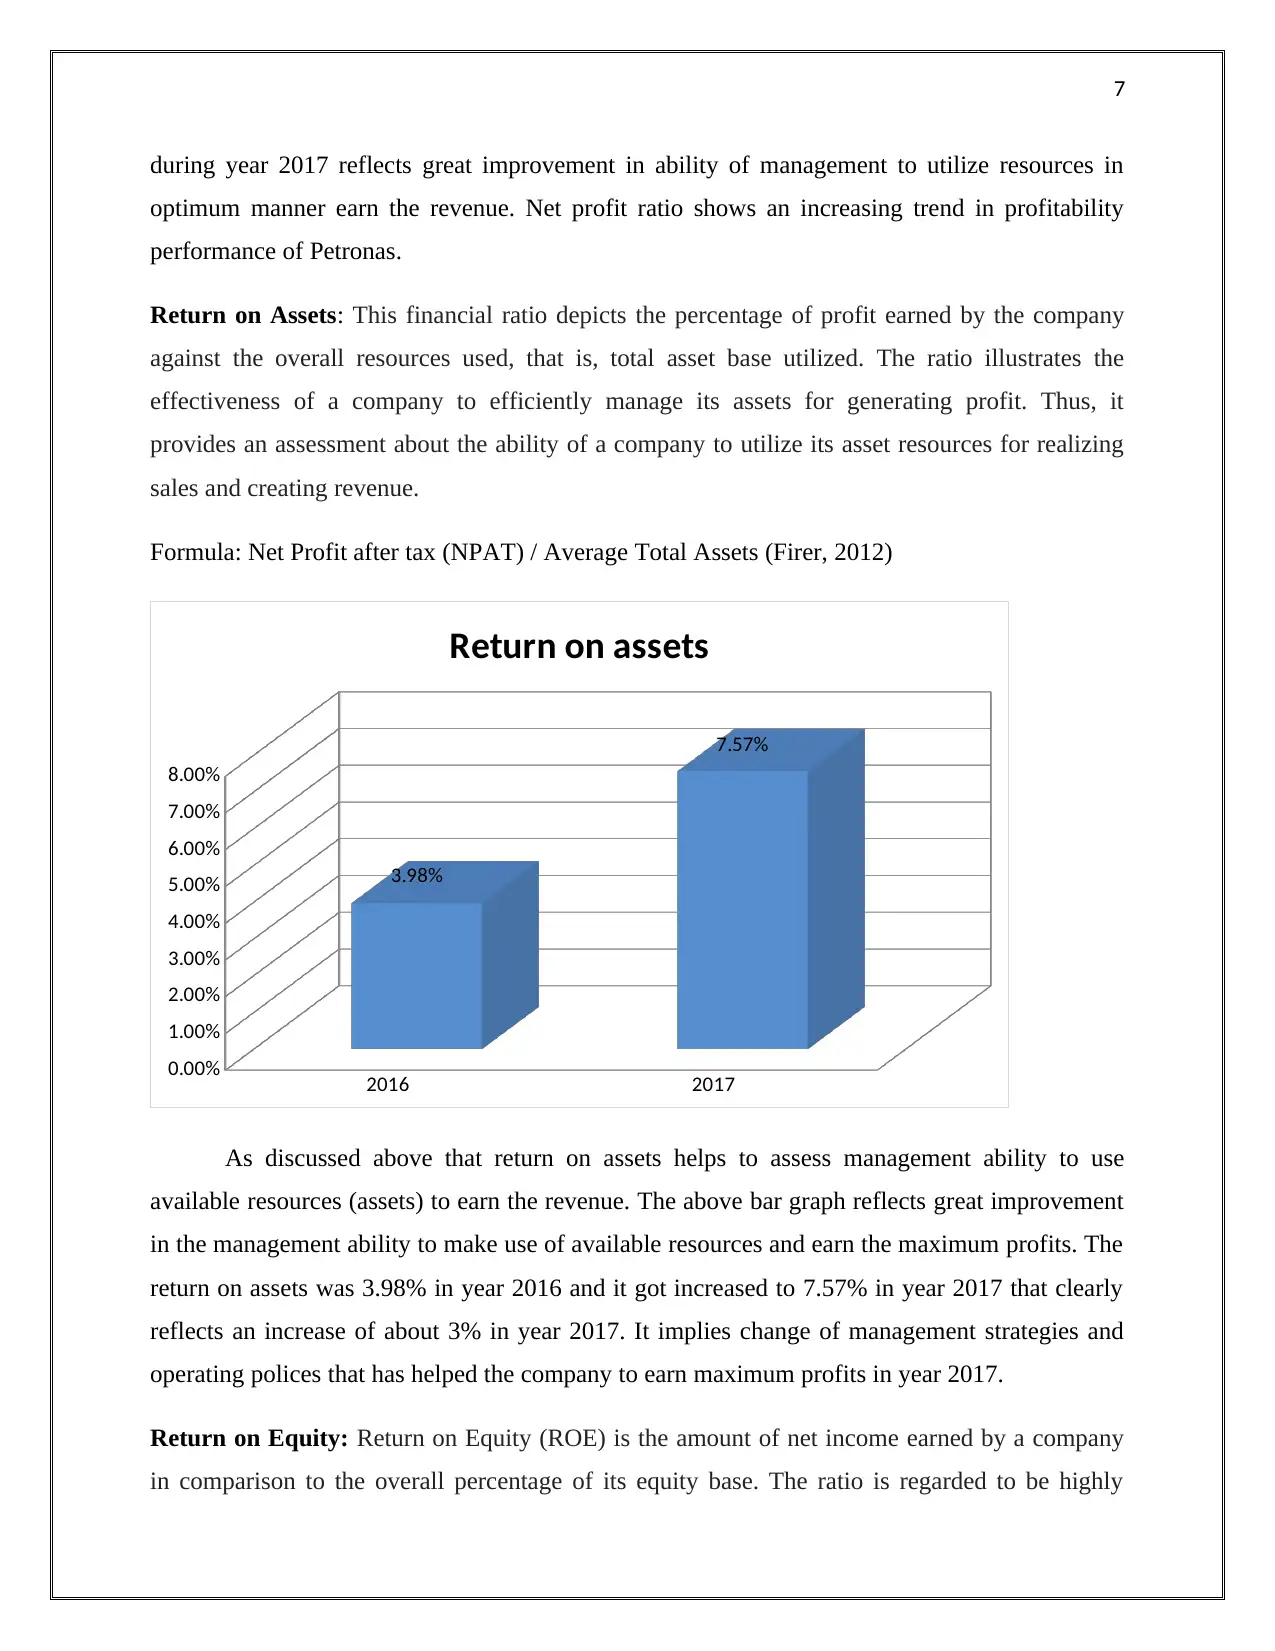
Return on Assets: This financial ratio depicts the percentage of profit earned by the company
against the overall resources used, that is, total asset base utilized. The ratio illustrates the
effectiveness of a company to efficiently manage its assets for generating profit. Thus, it
provides an assessment about the ability of a company to utilize its asset resources for realizing
sales and creating revenue.
Formula: Net Profit after tax (NPAT) / Average Total Assets (Firer, 2012)
2016 2017
0.00%
1.00%
2.00%
3.00%
4.00%
5.00%
6.00%
7.00%
8.00%
3.98%
7.57%
Return on assets
As discussed above that return on assets helps to assess management ability to use
available resources (assets) to earn the revenue. The above bar graph reflects great improvement
in the management ability to make use of available resources and earn the maximum profits. The
return on assets was 3.98% in year 2016 and it got increased to 7.57% in year 2017 that clearly
reflects an increase of about 3% in year 2017. It implies change of management strategies and
operating polices that has helped the company to earn maximum profits in year 2017.
Return on Equity: Return on Equity (ROE) is the amount of net income earned by a company
in comparison to the overall percentage of its equity base. The ratio is regarded to be highly
during year 2017 reflects great improvement in ability of management to utilize resources in
optimum manner earn the revenue. Net profit ratio shows an increasing trend in profitability
performance of Petronas.
Return on Assets: This financial ratio depicts the percentage of profit earned by the company
against the overall resources used, that is, total asset base utilized. The ratio illustrates the
effectiveness of a company to efficiently manage its assets for generating profit. Thus, it
provides an assessment about the ability of a company to utilize its asset resources for realizing
sales and creating revenue.
Formula: Net Profit after tax (NPAT) / Average Total Assets (Firer, 2012)
2016 2017
0.00%
1.00%
2.00%
3.00%
4.00%
5.00%
6.00%
7.00%
8.00%
3.98%
7.57%
Return on assets
As discussed above that return on assets helps to assess management ability to use
available resources (assets) to earn the revenue. The above bar graph reflects great improvement
in the management ability to make use of available resources and earn the maximum profits. The
return on assets was 3.98% in year 2016 and it got increased to 7.57% in year 2017 that clearly
reflects an increase of about 3% in year 2017. It implies change of management strategies and
operating polices that has helped the company to earn maximum profits in year 2017.
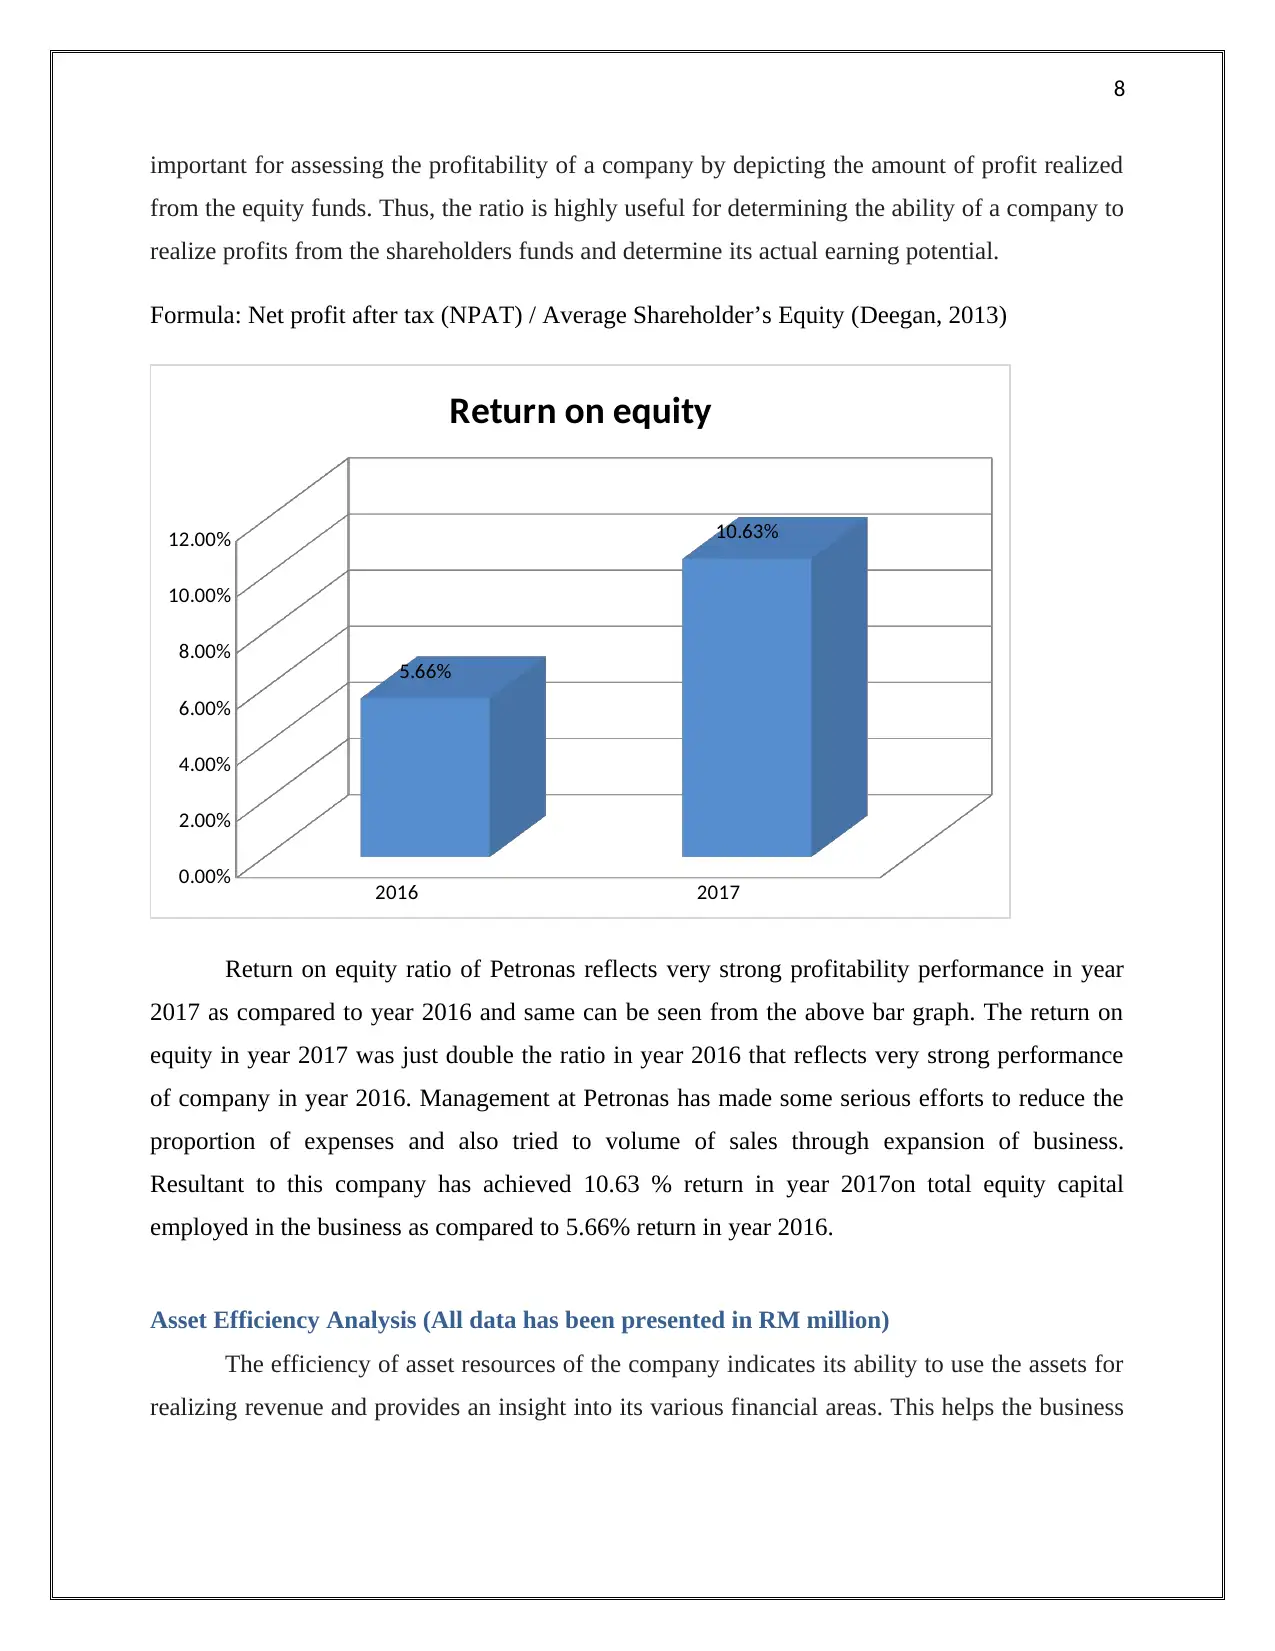
Return on Equity: Return on Equity (ROE) is the amount of net income earned by a company
in comparison to the overall percentage of its equity base. The ratio is regarded to be highly
Paraphrase This Document
Need a fresh take? Get an instant paraphrase of this document with our AI Paraphraser
8
important for assessing the profitability of a company by depicting the amount of profit realized
from the equity funds. Thus, the ratio is highly useful for determining the ability of a company to
realize profits from the shareholders funds and determine its actual earning potential.
Formula: Net profit after tax (NPAT) / Average Shareholder’s Equity (Deegan, 2013)
2016 2017
0.00%
2.00%
4.00%
6.00%
8.00%
10.00%
12.00%
5.66%
10.63%
Return on equity
Return on equity ratio of Petronas reflects very strong profitability performance in year
2017 as compared to year 2016 and same can be seen from the above bar graph. The return on
equity in year 2017 was just double the ratio in year 2016 that reflects very strong performance
of company in year 2016. Management at Petronas has made some serious efforts to reduce the
proportion of expenses and also tried to volume of sales through expansion of business.
Resultant to this company has achieved 10.63 % return in year 2017on total equity capital
employed in the business as compared to 5.66% return in year 2016.
Asset Efficiency Analysis (All data has been presented in RM million)
The efficiency of asset resources of the company indicates its ability to use the assets for
realizing revenue and provides an insight into its various financial areas. This helps the business
9
manager to identify the particular areas of financial strength and weakness so that asset resources
can be utilized in an effective manner for realizing sales.
Ratios Formula 2016 2017
Asset Efficiency Ratios
Average Collection period in
days (Day Sales Outstanding)
(365*Average
accounts
receivable)/Net
Receivables Sales
85.11 73.47
Day’s inventory outstanding (365*Average
Inventory)/Sales 25.03 23.91
(Annual Report, 2017 and Annual Report, 2016)
(Note: Financial Data can be located at appendix section of this report)
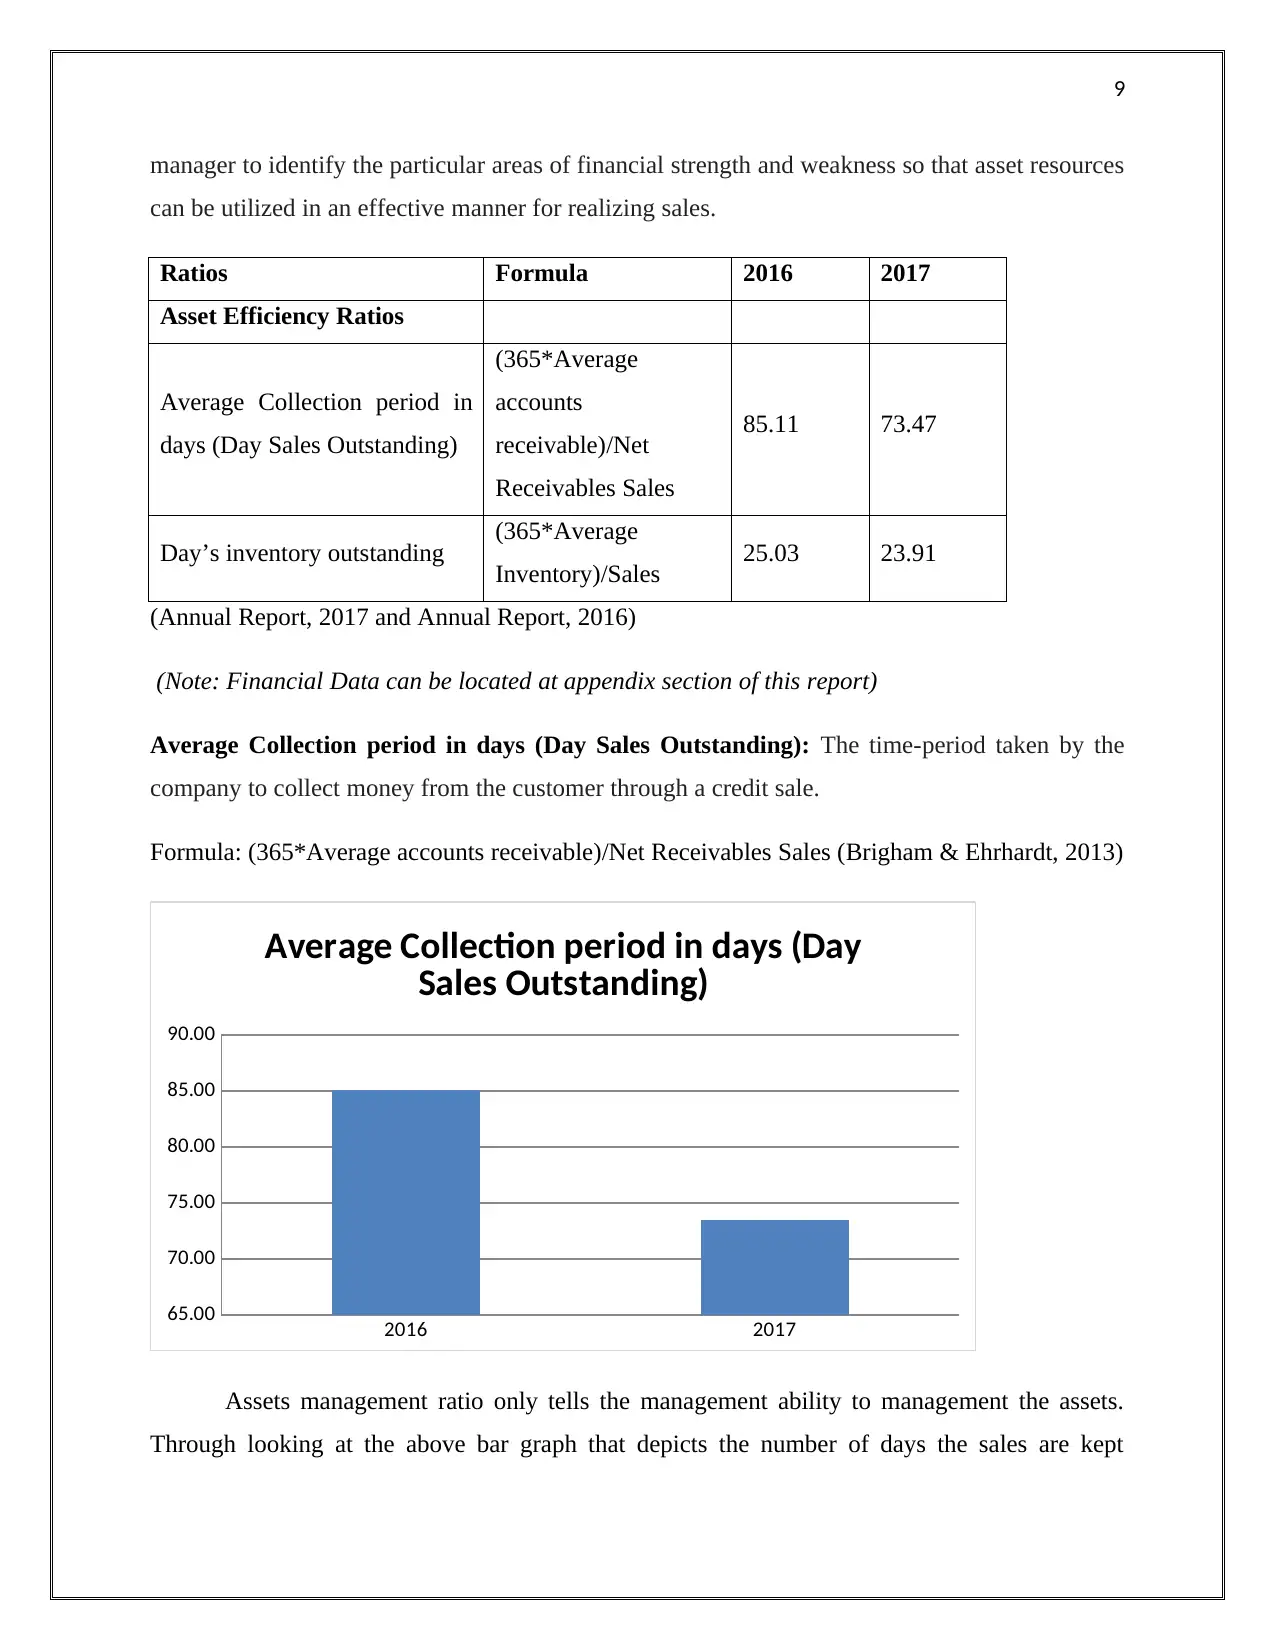
Average Collection period in days (Day Sales Outstanding): The time-period taken by the
company to collect money from the customer through a credit sale.
Formula: (365*Average accounts receivable)/Net Receivables Sales (Brigham & Ehrhardt, 2013)
2016 2017
65.00
70.00
75.00
80.00
85.00
90.00
Average Collection period in days (Day
Sales Outstanding)
Assets management ratio only tells the management ability to management the assets.
Through looking at the above bar graph that depicts the number of days the sales are kept
manager to identify the particular areas of financial strength and weakness so that asset resources
can be utilized in an effective manner for realizing sales.
Ratios Formula 2016 2017
Asset Efficiency Ratios
Average Collection period in
days (Day Sales Outstanding)
(365*Average
accounts
receivable)/Net
Receivables Sales
85.11 73.47
Day’s inventory outstanding (365*Average
Inventory)/Sales 25.03 23.91
(Annual Report, 2017 and Annual Report, 2016)
(Note: Financial Data can be located at appendix section of this report)
Average Collection period in days (Day Sales Outstanding): The time-period taken by the
company to collect money from the customer through a credit sale.
Formula: (365*Average accounts receivable)/Net Receivables Sales (Brigham & Ehrhardt, 2013)
2016 2017
65.00
70.00
75.00
80.00
85.00
90.00
Average Collection period in days (Day
Sales Outstanding)
Assets management ratio only tells the management ability to management the assets.
Through looking at the above bar graph that depicts the number of days the sales are kept
⊘ This is a preview!⊘
Do you want full access?
Subscribe today to unlock all pages.
Trusted by 1+ million students worldwide
10
outstanding, it can be said that efficiency of management at Petronas has improved as there has
been decrease in this ratio. The analysis of above bar graph says that in year 2016, management
requires 85 days to collect the outstanding sales and in year 2017 it got reduced to 73 days. So it
can be said that management has tried to improve the policies of asset management and also get
success. The decrease in days sales outstanding will helps the company to collect cash from
customer far early as expected and also helps to increase the working capital within the business.
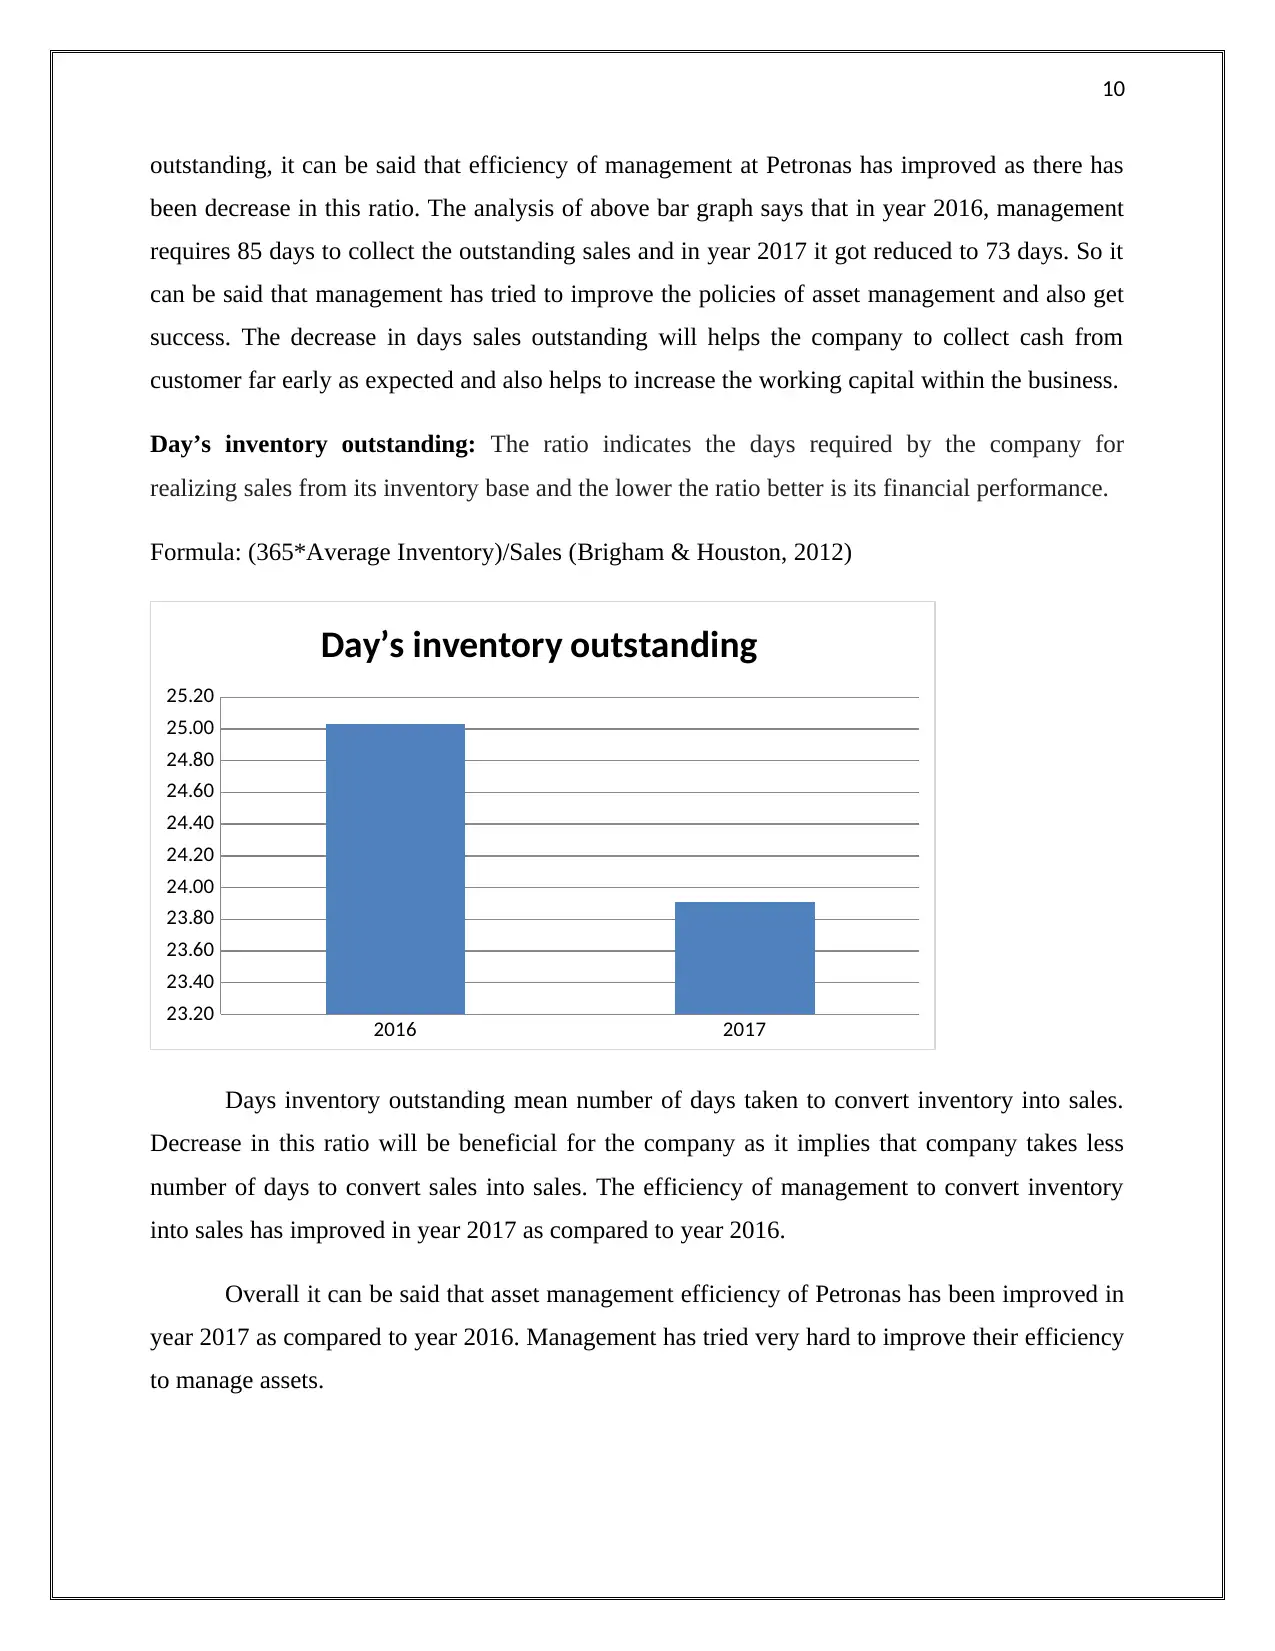
Day’s inventory outstanding: The ratio indicates the days required by the company for
realizing sales from its inventory base and the lower the ratio better is its financial performance.
Formula: (365*Average Inventory)/Sales (Brigham & Houston, 2012)
2016 2017
23.20
23.40
23.60
23.80
24.00
24.20
24.40
24.60
24.80
25.00
25.20
Day’s inventory outstanding
Days inventory outstanding mean number of days taken to convert inventory into sales.
Decrease in this ratio will be beneficial for the company as it implies that company takes less
number of days to convert sales into sales. The efficiency of management to convert inventory
into sales has improved in year 2017 as compared to year 2016.
Overall it can be said that asset management efficiency of Petronas has been improved in
year 2017 as compared to year 2016. Management has tried very hard to improve their efficiency
to manage assets.
outstanding, it can be said that efficiency of management at Petronas has improved as there has
been decrease in this ratio. The analysis of above bar graph says that in year 2016, management
requires 85 days to collect the outstanding sales and in year 2017 it got reduced to 73 days. So it
can be said that management has tried to improve the policies of asset management and also get
success. The decrease in days sales outstanding will helps the company to collect cash from
customer far early as expected and also helps to increase the working capital within the business.
Day’s inventory outstanding: The ratio indicates the days required by the company for
realizing sales from its inventory base and the lower the ratio better is its financial performance.
Formula: (365*Average Inventory)/Sales (Brigham & Houston, 2012)
2016 2017
23.20
23.40
23.60
23.80
24.00
24.20
24.40
24.60
24.80
25.00
25.20
Day’s inventory outstanding
Days inventory outstanding mean number of days taken to convert inventory into sales.
Decrease in this ratio will be beneficial for the company as it implies that company takes less
number of days to convert sales into sales. The efficiency of management to convert inventory
into sales has improved in year 2017 as compared to year 2016.
Overall it can be said that asset management efficiency of Petronas has been improved in
year 2017 as compared to year 2016. Management has tried very hard to improve their efficiency
to manage assets.
Paraphrase This Document
Need a fresh take? Get an instant paraphrase of this document with our AI Paraphraser
11
Liquidity Analysis (Short term solvency analysis) (All data has been presented in RM
million)
The liquidity analysis depicts the ability of a company to meet its financial obligations
from its asset base. This can be assessed by the calculation of the current as well as quick ratio
by the company that determines its ability to generate sufficient cash inflows for avoiding the
financial risk of insolvency.
Ratios Formula 2016 2017
Liquidity Analysis (Short
term solvency ratios)
Current Ratio
Current
Assets/Current
liabilities
2.57 2.93
Quick Ratio: Quick Assets/Current
liabilities 2.38 2.71
(Annual Report, 2017 and Annual Report, 2016)
(Note: Financial Data can be located at appendix section of this report)
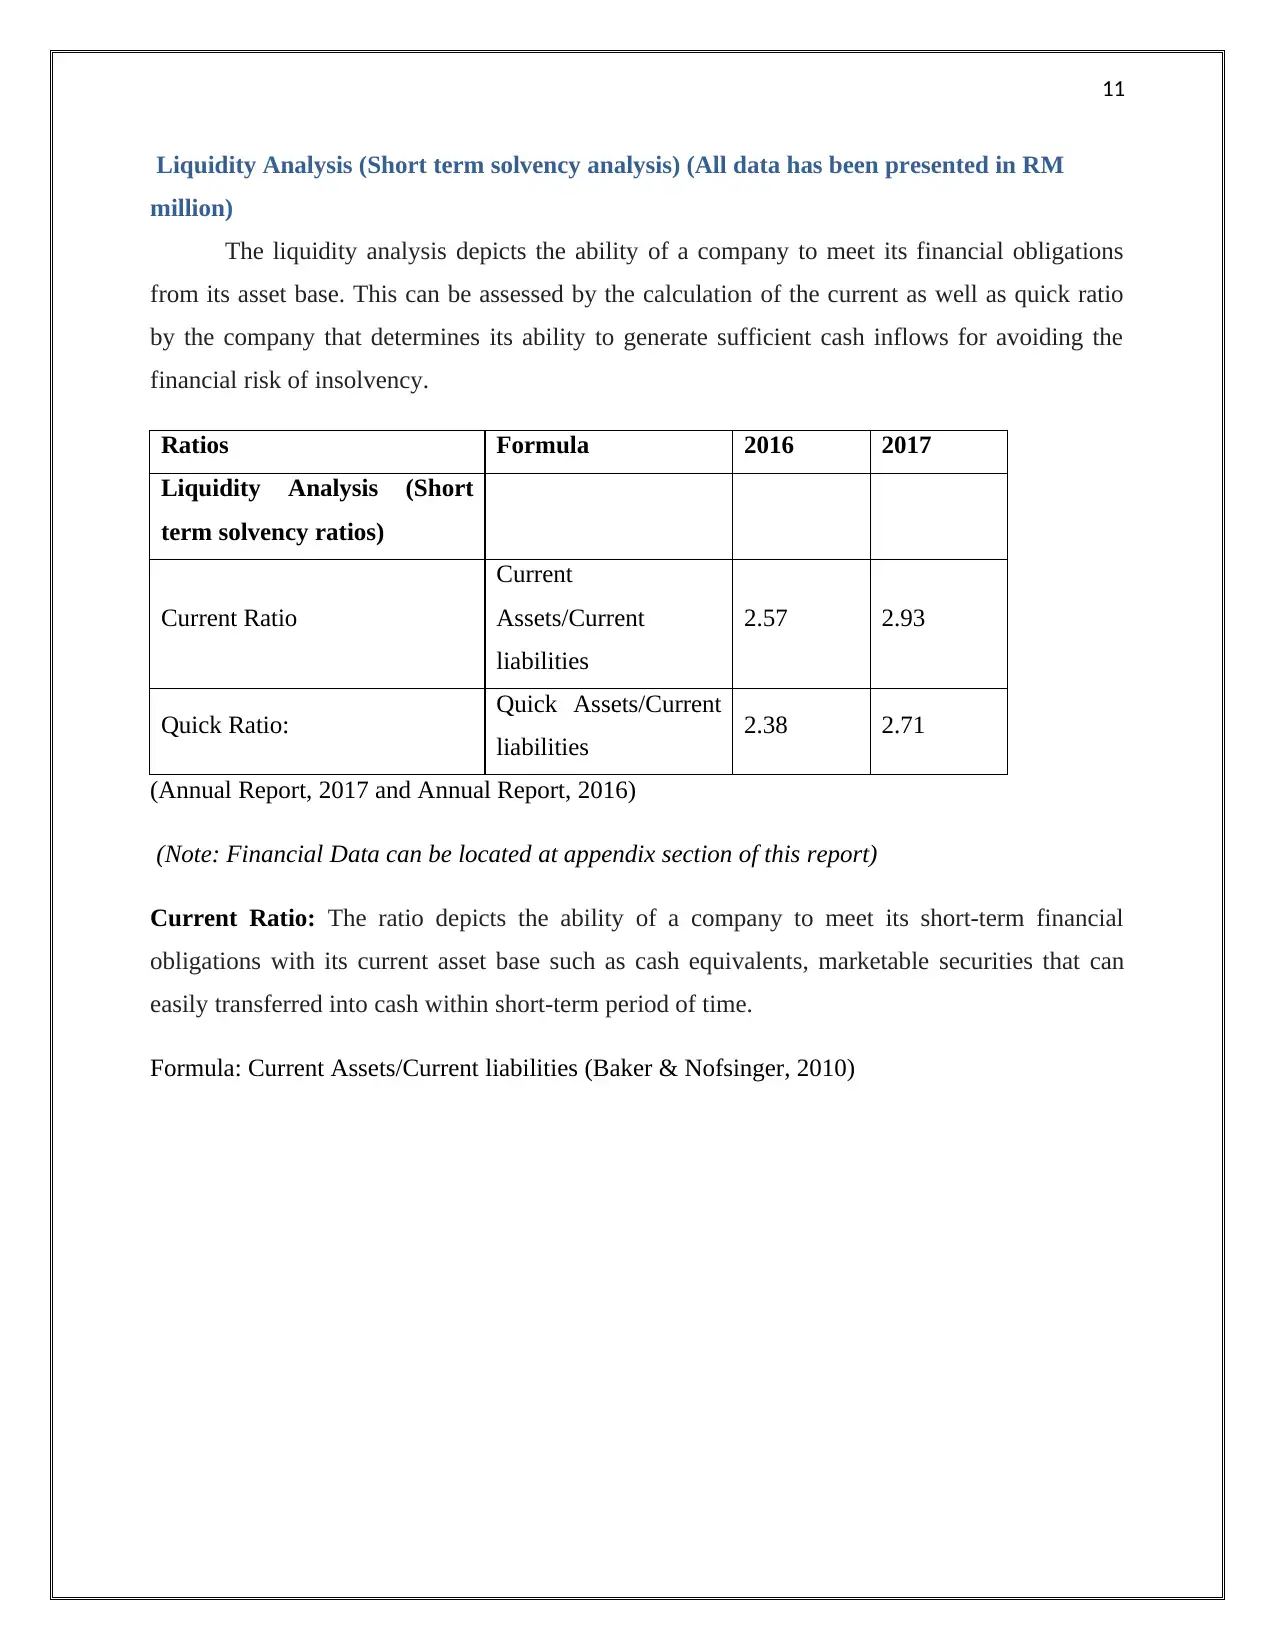
Current Ratio: The ratio depicts the ability of a company to meet its short-term financial
obligations with its current asset base such as cash equivalents, marketable securities that can
easily transferred into cash within short-term period of time.
Formula: Current Assets/Current liabilities (Baker & Nofsinger, 2010)
Liquidity Analysis (Short term solvency analysis) (All data has been presented in RM
million)
The liquidity analysis depicts the ability of a company to meet its financial obligations
from its asset base. This can be assessed by the calculation of the current as well as quick ratio
by the company that determines its ability to generate sufficient cash inflows for avoiding the
financial risk of insolvency.
Ratios Formula 2016 2017
Liquidity Analysis (Short
term solvency ratios)
Current Ratio
Current
Assets/Current
liabilities
2.57 2.93
Quick Ratio: Quick Assets/Current
liabilities 2.38 2.71
(Annual Report, 2017 and Annual Report, 2016)
(Note: Financial Data can be located at appendix section of this report)
Current Ratio: The ratio depicts the ability of a company to meet its short-term financial
obligations with its current asset base such as cash equivalents, marketable securities that can
easily transferred into cash within short-term period of time.
Formula: Current Assets/Current liabilities (Baker & Nofsinger, 2010)
12
2016 2017
2.30
2.40
2.50
2.60
2.70
2.80
2.90
3.00
Current Ratio
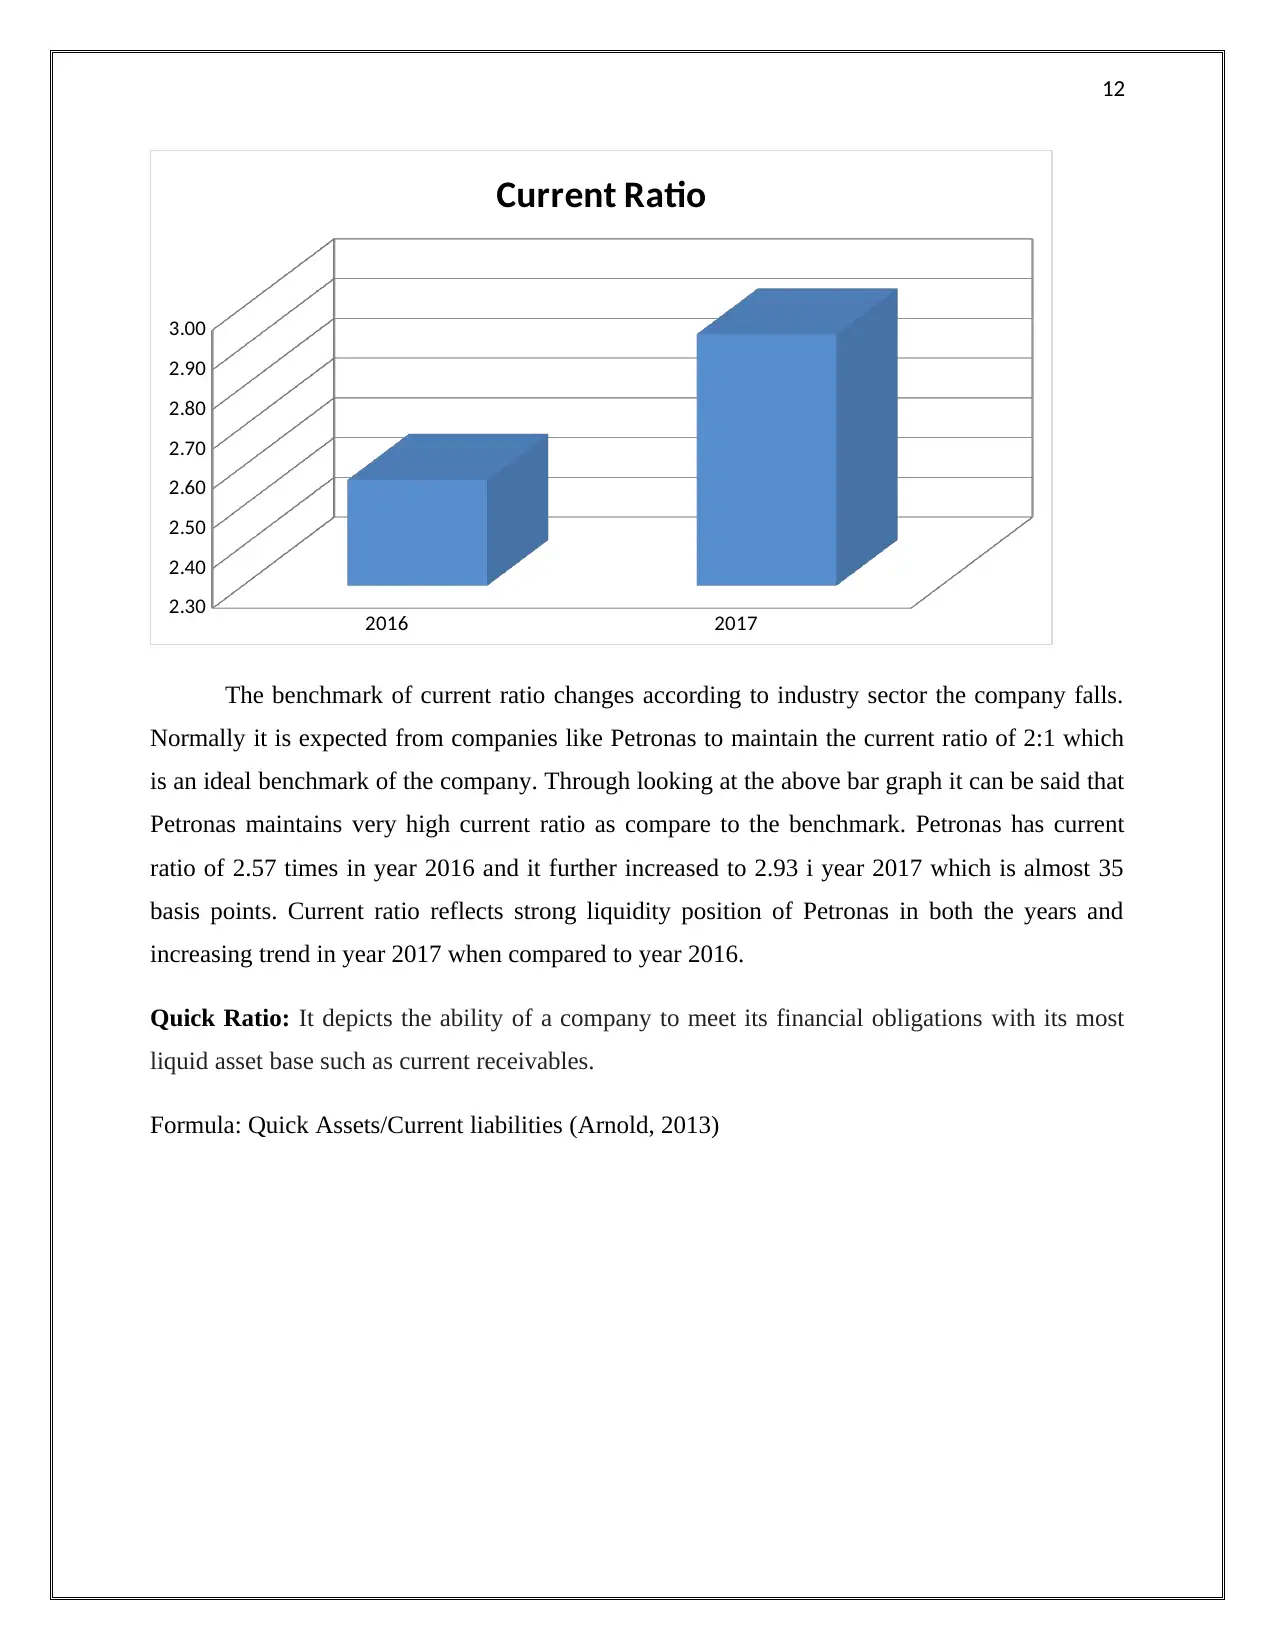
The benchmark of current ratio changes according to industry sector the company falls.
Normally it is expected from companies like Petronas to maintain the current ratio of 2:1 which
is an ideal benchmark of the company. Through looking at the above bar graph it can be said that
Petronas maintains very high current ratio as compare to the benchmark. Petronas has current
ratio of 2.57 times in year 2016 and it further increased to 2.93 i year 2017 which is almost 35
basis points. Current ratio reflects strong liquidity position of Petronas in both the years and
increasing trend in year 2017 when compared to year 2016.
Quick Ratio: It depicts the ability of a company to meet its financial obligations with its most
liquid asset base such as current receivables.
Formula: Quick Assets/Current liabilities (Arnold, 2013)
2016 2017
2.30
2.40
2.50
2.60
2.70
2.80
2.90
3.00
Current Ratio
The benchmark of current ratio changes according to industry sector the company falls.
Normally it is expected from companies like Petronas to maintain the current ratio of 2:1 which
is an ideal benchmark of the company. Through looking at the above bar graph it can be said that
Petronas maintains very high current ratio as compare to the benchmark. Petronas has current
ratio of 2.57 times in year 2016 and it further increased to 2.93 i year 2017 which is almost 35
basis points. Current ratio reflects strong liquidity position of Petronas in both the years and
increasing trend in year 2017 when compared to year 2016.
Quick Ratio: It depicts the ability of a company to meet its financial obligations with its most
liquid asset base such as current receivables.
Formula: Quick Assets/Current liabilities (Arnold, 2013)
⊘ This is a preview!⊘
Do you want full access?
Subscribe today to unlock all pages.
Trusted by 1+ million students worldwide
1 out of 23
Related Documents


Your All-in-One AI-Powered Toolkit for Academic Success.
+13062052269
info@desklib.com
Available 24*7 on WhatsApp / Email
![[object Object]](/_next/static/media/star-bottom.7253800d.svg)
Unlock your academic potential
Copyright © 2020–2026 A2Z Services. All Rights Reserved. Developed and managed by ZUCOL.