Case Study: Continuous Improvement Strategies for PEW Pvt Ltd

Verified

Added on  2023/06/05

|20
|4008
|113
Case Study
AI Summary
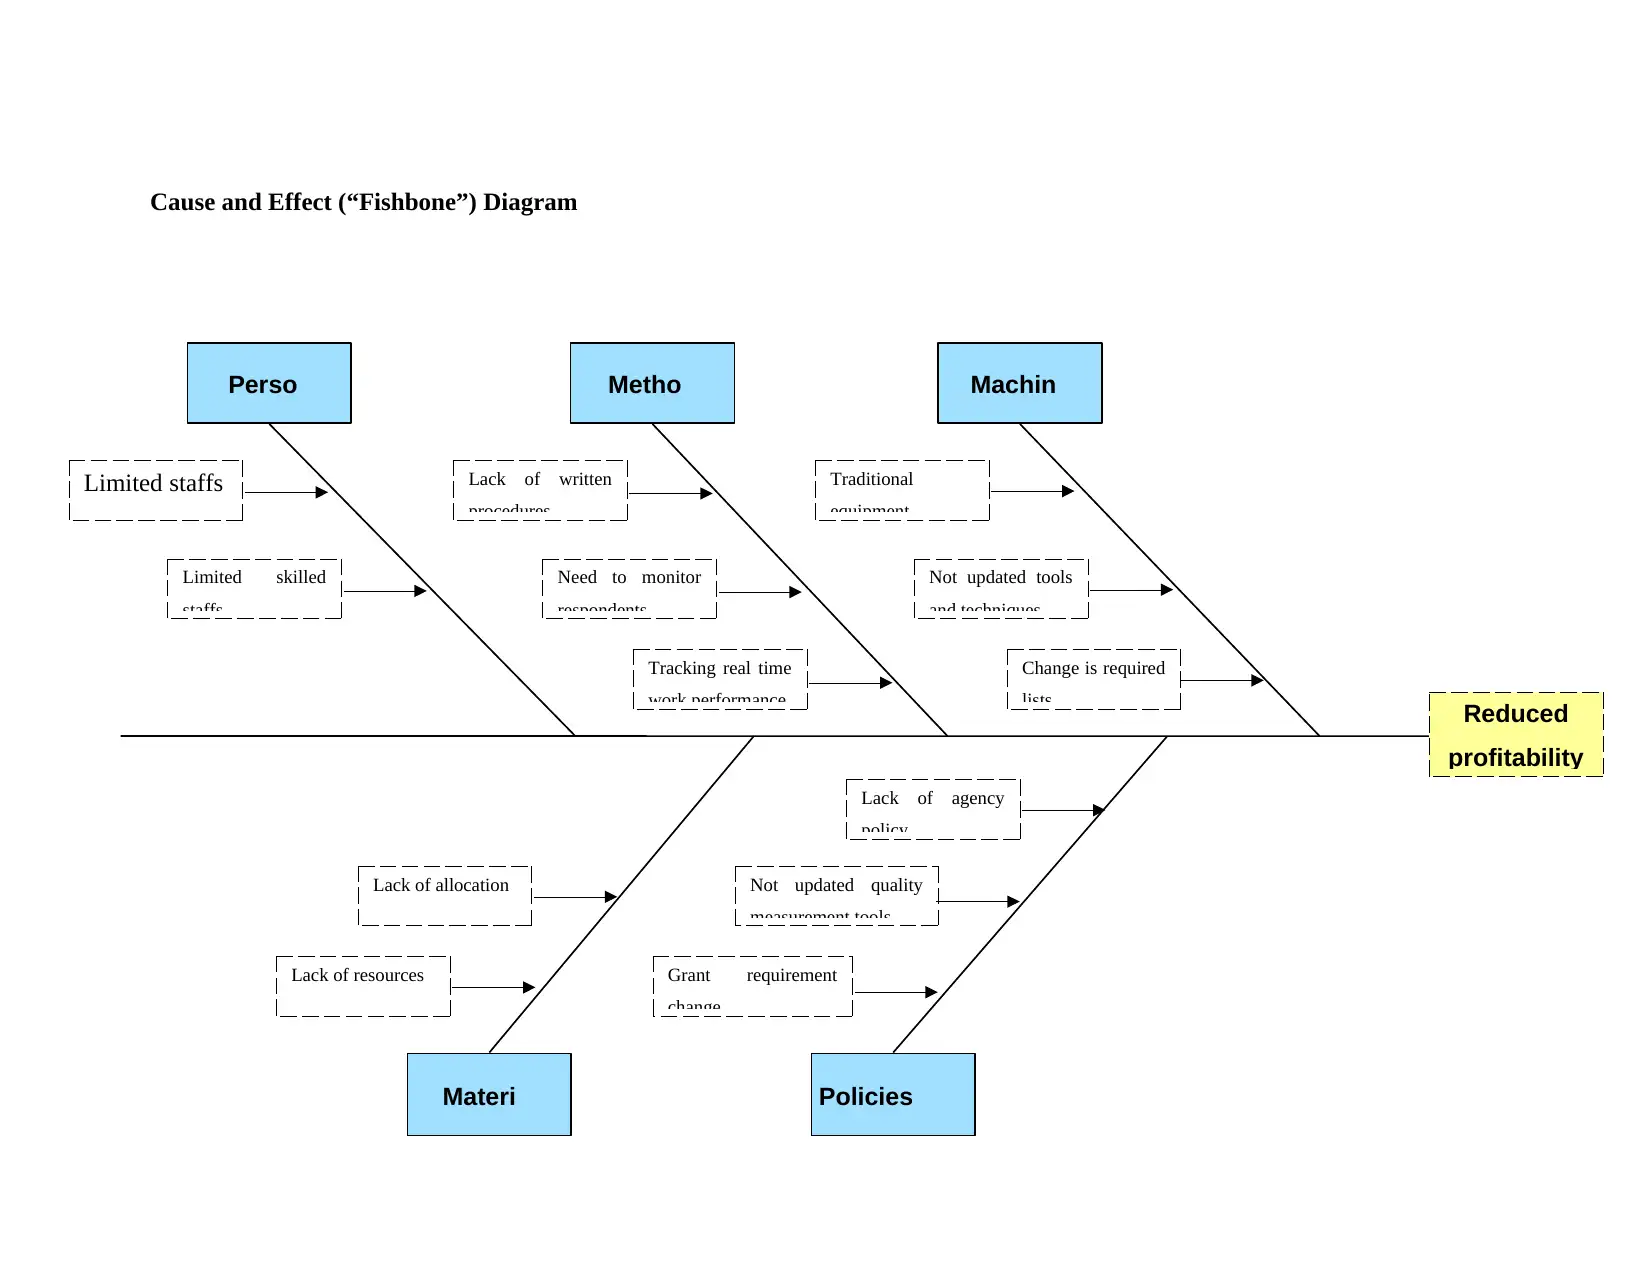
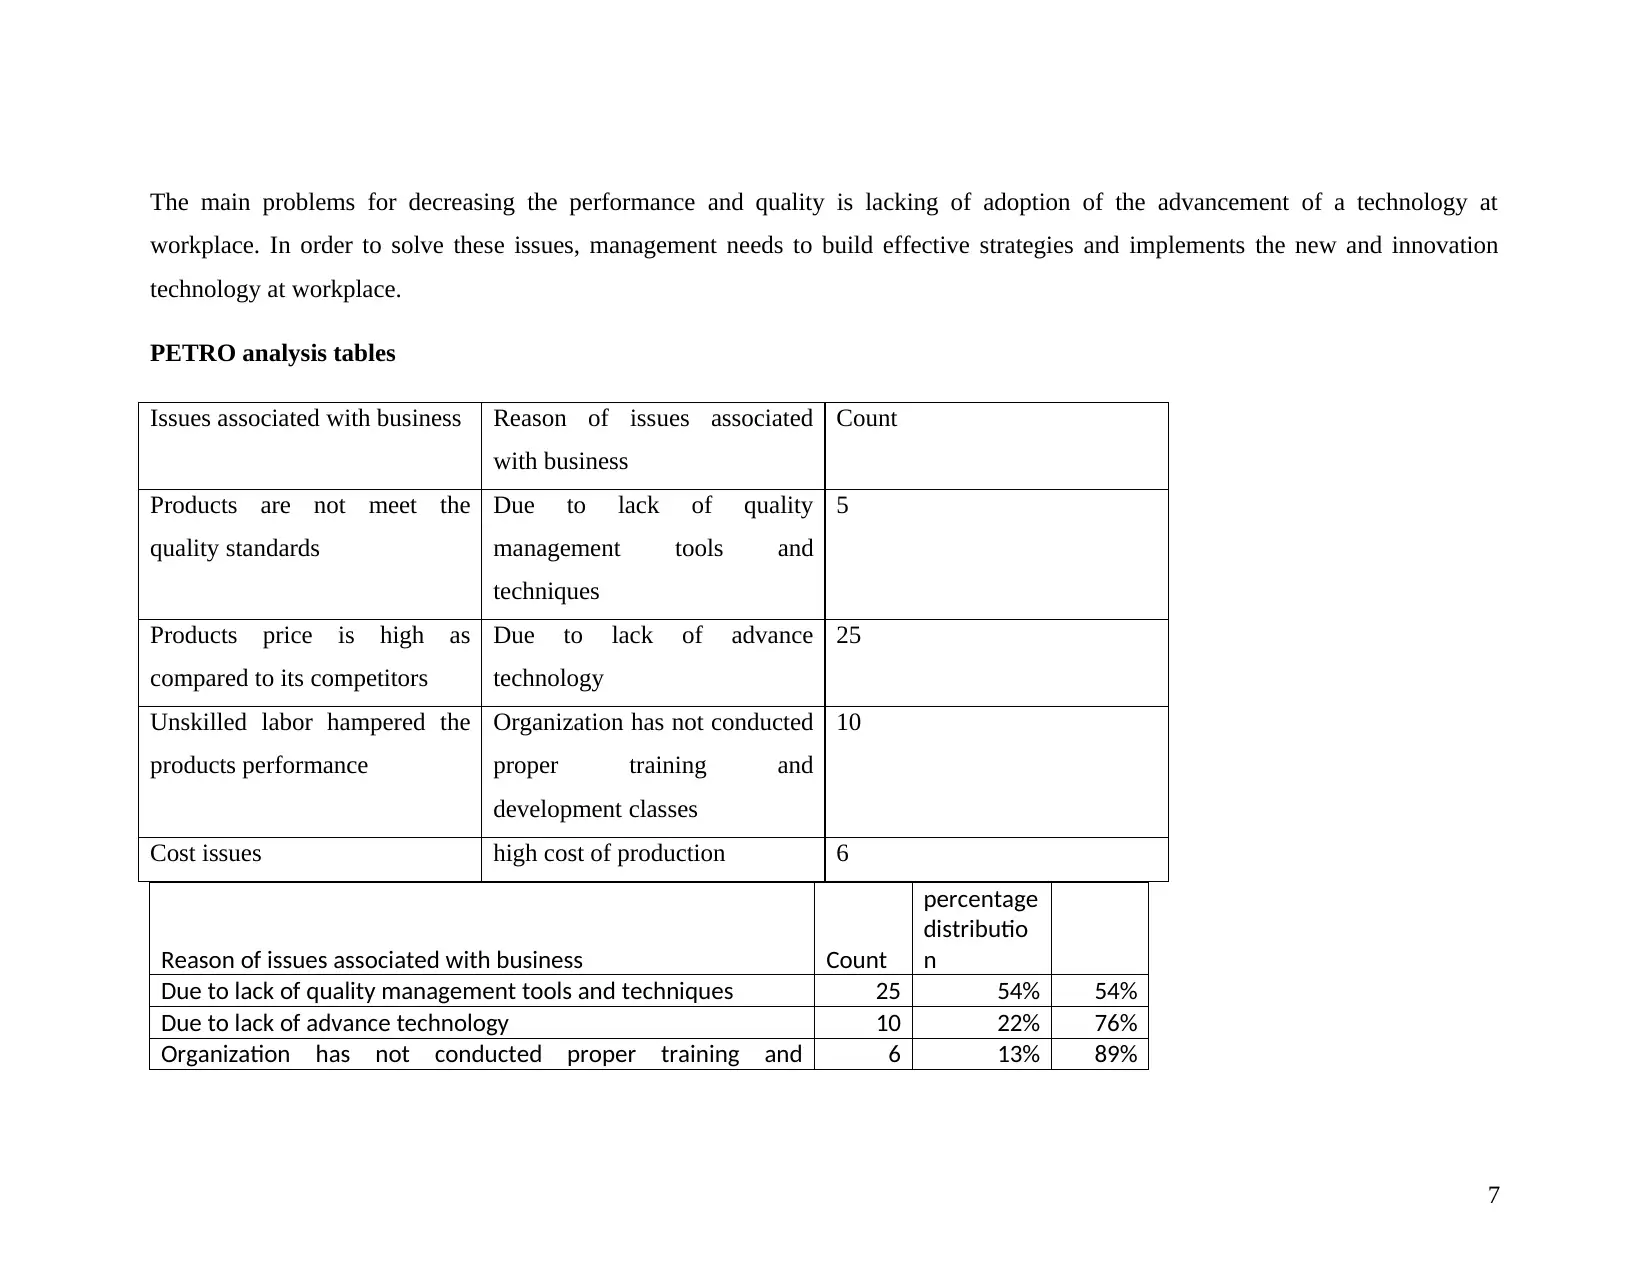
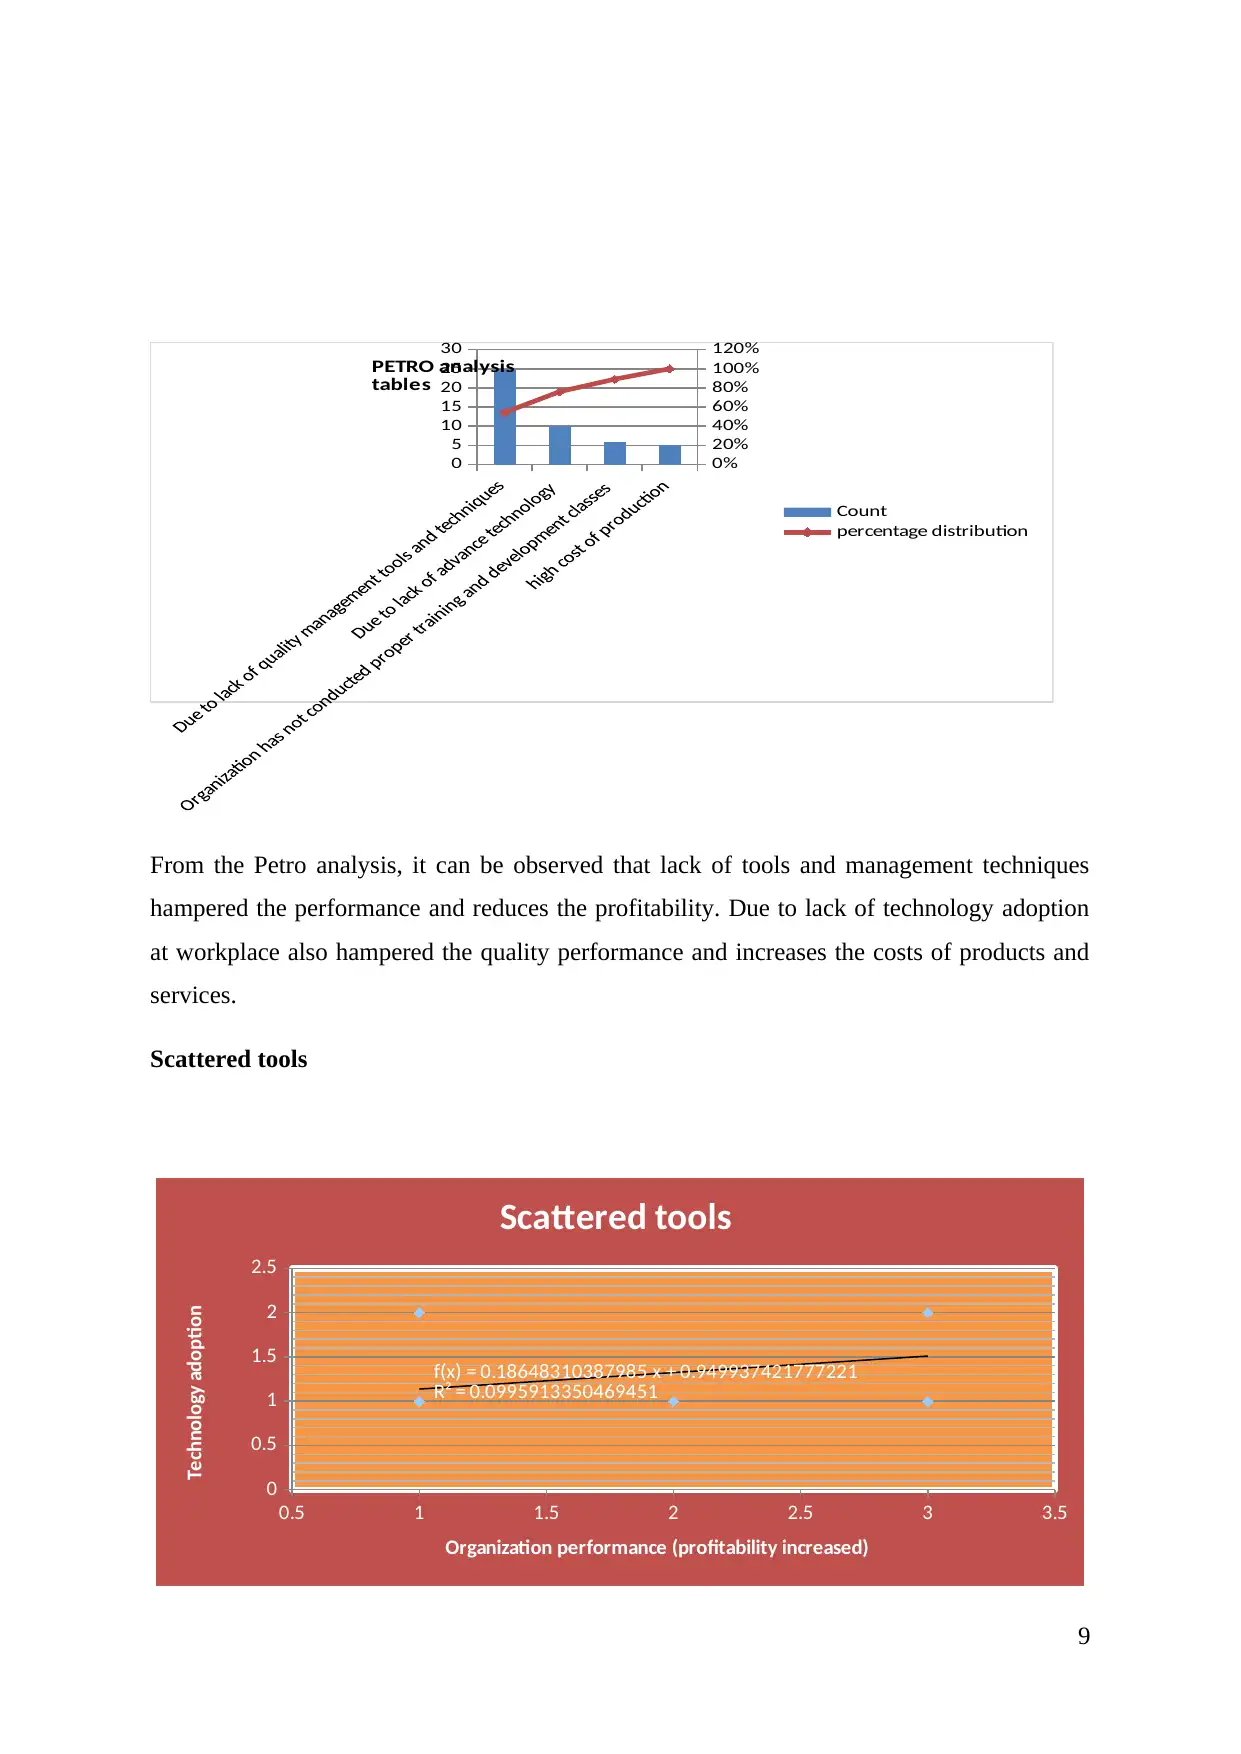
This case study examines the challenges faced by PEW, an equipment manufacturing organization, focusing on continuous improvement strategies. The analysis identifies key issues such as a lack of management monitoring tools, limited technology adoption, and inadequate employee training. The study employs seven quality tools and techniques, including cause-and-effect diagrams, Pareto analysis, scatter diagrams, and control charts, to determine root causes and their impact on performance and customer satisfaction. The report proposes a continuous improvement plan that emphasizes technology implementation, improved manufacturing processes, and employee development. The plan addresses specific problems through team-based approaches, customer-centric assessments, and disciplined manufacturing processes. The study also highlights the need for resource allocation and monitoring, including financial support, hardware, and human resources. The analysis concludes by emphasizing the importance of continuous evaluation and adjustments to ensure sustained improvements in quality, efficiency, and overall business performance.
Document Page
Assessment 2: Case study: Continuous
Improvement
1
tabler-icon-diamond-filled.svg

Paraphrase This Document

Need a fresh take? Get an instant paraphrase of this document with our AI Paraphraser
Document Page
Executive summery
Seven quality tools and techniques are considered one of an effective quality tools and
helps the business to improve efficiency. The report shows that main issues associated
with the PEW organization are lack of management monitoring tools and techniques and
lack of adoption of the advancement technology at workplace. The main impact of these
issues of an organization is to reduce performance and customer’s satisfaction. The
continuous improvement plans shows that implementation of an effective technology at
workplace helps to improve performance and solve issues in better manner.
2
Document Page
Table of Contents
Executive summery.............................................................................................................2
Introduction..........................................................................................................................4
Determine root causes using 7 tools and techniques...........................................................5
Assumptions......................................................................................................................13
Continuous improvement plan...........................................................................................14
Employee and management competency requirement for the change management.........18
Business and its strategic management..........................................................................18
Technical management..................................................................................................19
Leadership approach......................................................................................................19
Conclusion.........................................................................................................................19
References..........................................................................................................................20
3
Document Page
Introduction
In business management needs proper approach in production, selling to final customer
service to become successful in the market (Dunning, 2013). The current business
situation shows that PEW is falling behind in the market in comparison to their
competitor business. PEW pvt ltd is equipment manufacturing organization and
performing well in past few years. The customers of an organization is includes the major
telecommunication service providers. The impact of this strong completion is impacting
the situation of profitability in the business where the profit is down by 45%. Under this
circumstance the current report would try to investigate the problem for the company in
dept to explore different solutions for PEW. The analysis and exploration would use
seven different techniques like five why technique, control through chart, scatter diagram,
histogram, analysis of cause and effect, Pareto analysis.
Determine root causes using 7 tools and techniques
4
tabler-icon-diamond-filled.svg

Paraphrase This Document

Need a fresh take? Get an instant paraphrase of this document with our AI Paraphraser
Document Page
Cause and Effect (“Fishbone”) Diagram
Limited staffs
Limited skilled
staffs
Lack of written
procedures
Need to monitor
respondents
Tracking real time
work performance
Traditional
equipment
Not updated tools
and techniques
Not updated quality
measurement tools
Lack of agency
policy
Grant requirement
change
Change is required
lists
Lack of allocation
Lack of resources
Perso
n
Metho
d
Machin
e
Materi
al
Policies
Reduced
profitability
Document Page
Why techniques
6
Document Page
The main problems for decreasing the performance and quality is lacking of adoption of the advancement of a technology at
workplace. In order to solve these issues, management needs to build effective strategies and implements the new and innovation
technology at workplace.
PETRO analysis tables
Issues associated with business Reason of issues associated
with business
Count
Products are not meet the
quality standards
Due to lack of quality
management tools and
techniques
5
Products price is high as
compared to its competitors
Due to lack of advance
technology
25
Unskilled labor hampered the
products performance
Organization has not conducted
proper training and
development classes
10
Cost issues high cost of production 6
Reason of issues associated with business Count
percentage
distributio
n
Due to lack of quality management tools and techniques 25 54% 54%
Due to lack of advance technology 10 22% 76%
Organization has not conducted proper training and 6 13% 89%
7
tabler-icon-diamond-filled.svg

Paraphrase This Document

Need a fresh take? Get an instant paraphrase of this document with our AI Paraphraser
Document Page
development classes
high cost of production 5 11% 100%
8
Document Page
0
5
10
15
20
25
30
0%
20%
40%
60%
80%
100%
120%
Count
percentage distribution
PETRO analysis
tables
From the Petro analysis, it can be observed that lack of tools and management techniques
hampered the performance and reduces the profitability. Due to lack of technology adoption
at workplace also hampered the quality performance and increases the costs of products and
services.
Scattered tools
0.5 1 1.5 2 2.5 3 3.5
0
0.5
1
1.5
2
2.5
f(x) = 0.18648310387985 x + 0.949937421777221
R² = 0.0995913350469451
Scattered tools
Organization performance (profitability increased)
Technology adoption
9
Document Page
Scattered tools analysis techniques mainly implemented by the management to determine the
relationship between two variables i.e. dependent and independent variables (Montgomery,
Runger, & Hubele, 2009). Here, independent variables are technology adoptions and
dependent variables are organization performance. The analysis shows that technology
adoption has positive correlation in organization performance.
Histogram tools and techniques
Due to lack of quality
management tools and
techniques
Due to lack of advance
technology Organization has not
conducted proper
training and development
classes
high cost of production
25
10
6 5
Histogram tools and techniques
Histogram analysis shows that lack of the quality of management tools and techniques and
lack of advancement technologies are considered the main issues associated with the
organization. In order to increase the performance and accomplished better profits
management of an organization needs to implement automatic machinery tools and
techniques.
Check sheet analysis
Defect
type(major/
minor)
Defect in manufacturing items Total
count
Sun Mon Tue Web Thu Fri Sat
Damaged in
packaging
1 4 0 3 2 1 1 12
Wrong item
issues
1 1
Failed to pass
quality test
1 3 2 6
10
tabler-icon-diamond-filled.svg

Paraphrase This Document

Need a fresh take? Get an instant paraphrase of this document with our AI Paraphraser
Document Page
Damage in
products
1 3 1 2 1 8
Unavailabilit
y of resources
5 5
Missing
components
2 3 2 2 3 1 13
Labelling
errors
5 4 2 3 14
Incorrect
dimension
5
total 4 14 9 21 5 6 5 59
A check sheet is utilized by the management for purpose of gathering and analyzing the
information (Goetsch,., & Davis, 2014). This tools and techniques are more generic and
widely implemented in the organization (Magar, & Shinde, 2014). It is used to gather the
pattern or frequency, defects, problems, defect cause and defects locations. The analysis
indicates that labelling error, damaging in packages and mission components are the main
issues associated with the organization manufacturing process. Therefore it can be said that to
solve these issues in better manner organization needs to incorporate an effective
management strategies and also needs to use better monitoring tools and techniques at
workplace.
Control chart analysis
1 2 3 4 5 6 7 8 9 1
0
1
1
1
2
1
3
1
4
1
5
1
6
1
7
1
8
1
9
2
0
2
1
2
2
2
3
2
4
2
5
2
6
2
7
0
10
20
30
40
50
60
X-bar Chart for Mean Number of Ounces
Sample Mean
LCL
UCL
Mean
Days
Sample mean
11
Document Page
1 2 3 4 5 6 7 8 9 1
0
1
1
1
2
1
3
1
4
1
5
1
6
1
7
1
8
1
9
2
0
2
1
2
2
2
3
2
4
2
5
2
6
2
7
0
10
20
30
40
50
60
R Chart for Mean Number of Ounces
LCL
UCL
R-bar
Range
Days
Range
A control chart analysis is used by the management of the organization for purpose of
analyzing and evaluating the issues associated with the organization and business process
(Kalpakjian, Vijai Sekar, & Schmid, 2014). The main benefits of implementation of this
analysis methods in quality control procedures is that it helps the business to determine
whether organization process is stable or not. The findings indicates that data is above from
the upper control limits and also data is below the lower control limits which indicates that
performance of an organization is not up the mark and stable. Therefore it can be said that
organization needs to incorporate an effective business strategies and implement them in
successful manner.
Assumptions
In the fishbone diagram the assumption would be that the leadership of the business
was focused and able to take proper decision for the business, still lack on those
selected part are the main cause of lower profitability.
PETRO analysis model has identified certain issue for the business. In this part it is
assumed that the business marketing and customer service were up to the market and
are not the main cause of the current lower profitability figure.
In the scattered tool application it is shown that the incremental improvement in
technology has been able to provide the better outcome to the business by assuming
that the skill improvement for this process also happened incrementally.
In this overall process one general assumption was that the resource availability was
never been a significant issue for the current problem.
12
chevron_up_icon
1 out of 20
circle_padding
hide_on_mobile
zoom_out_icon
[object Object]