Financial Analysis Report: Pfizer Inc. vs. Bristol Myers Squibb Co.
VerifiedAdded on 2023/05/29
|7
|1735
|280
Report
AI Summary
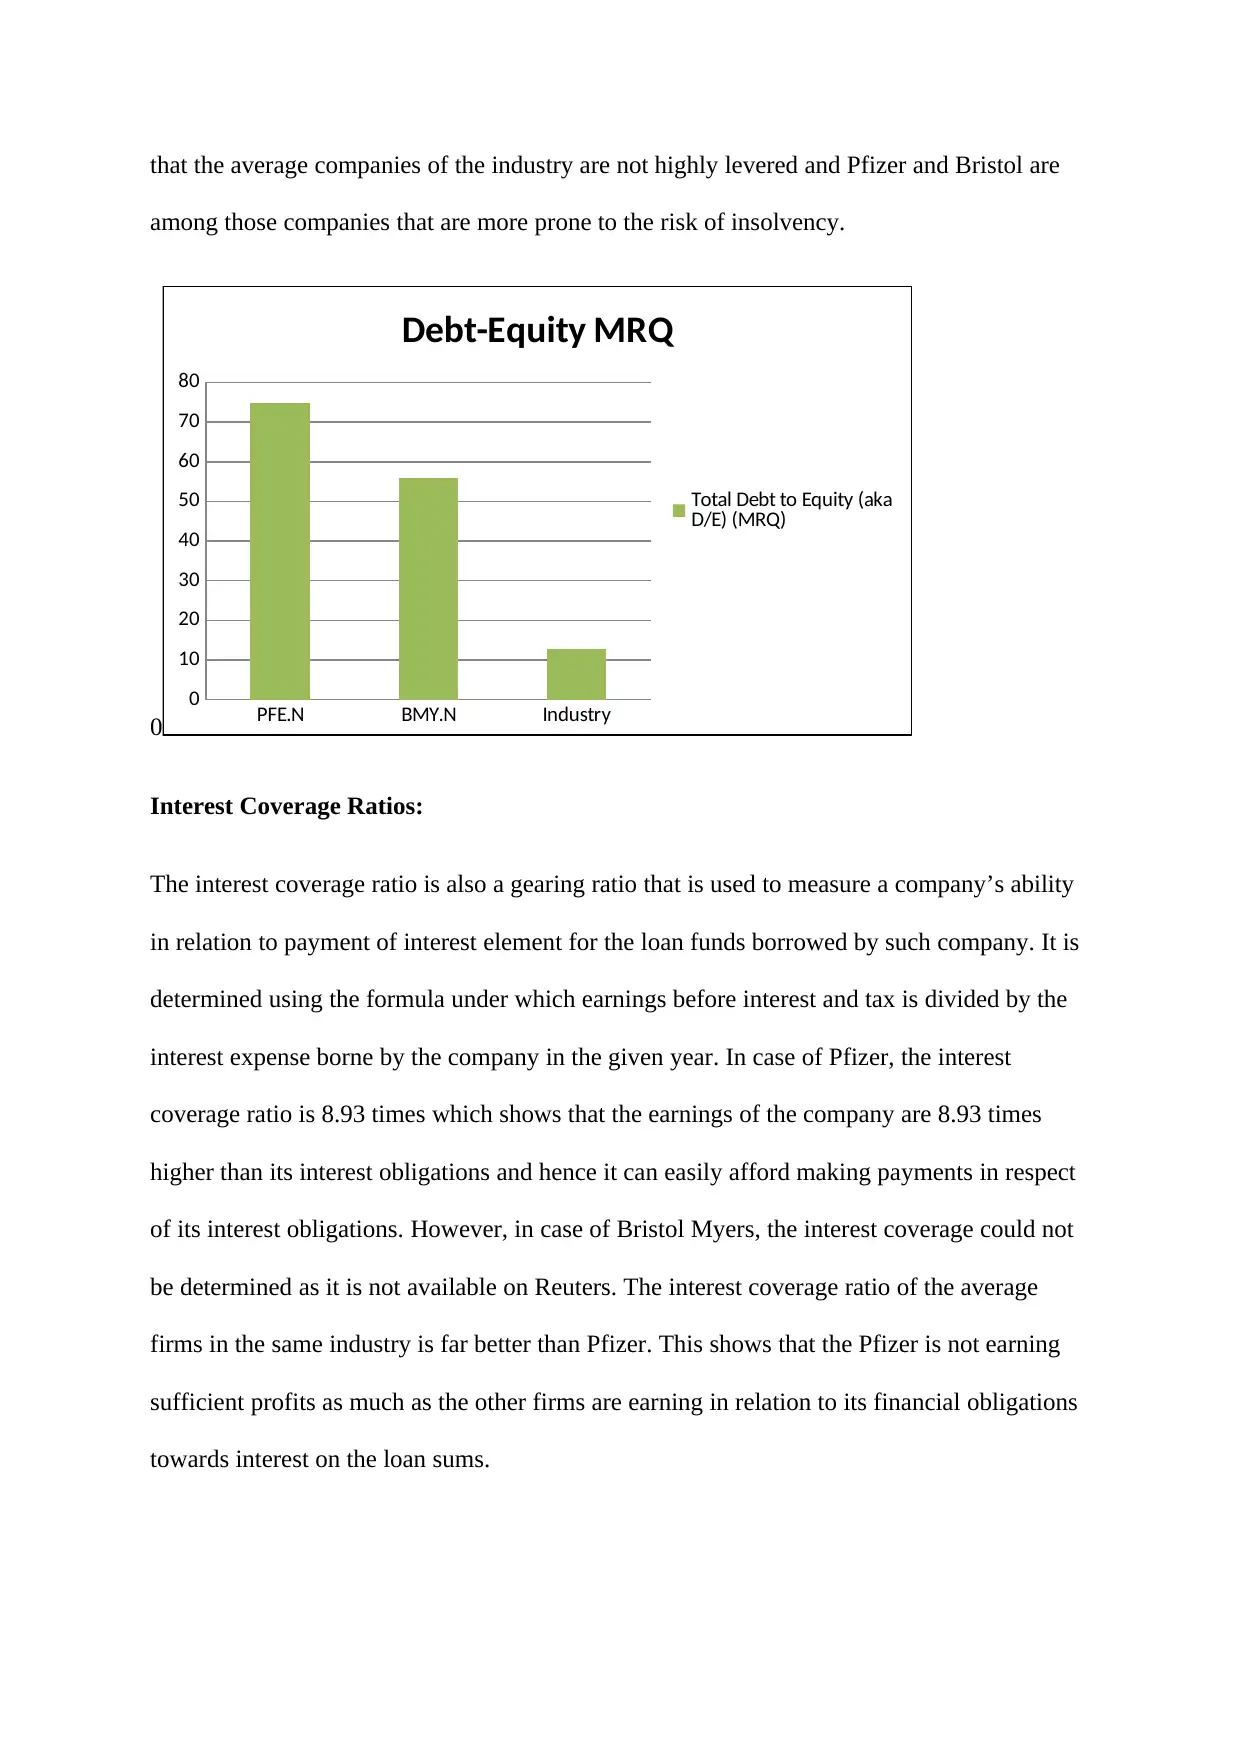
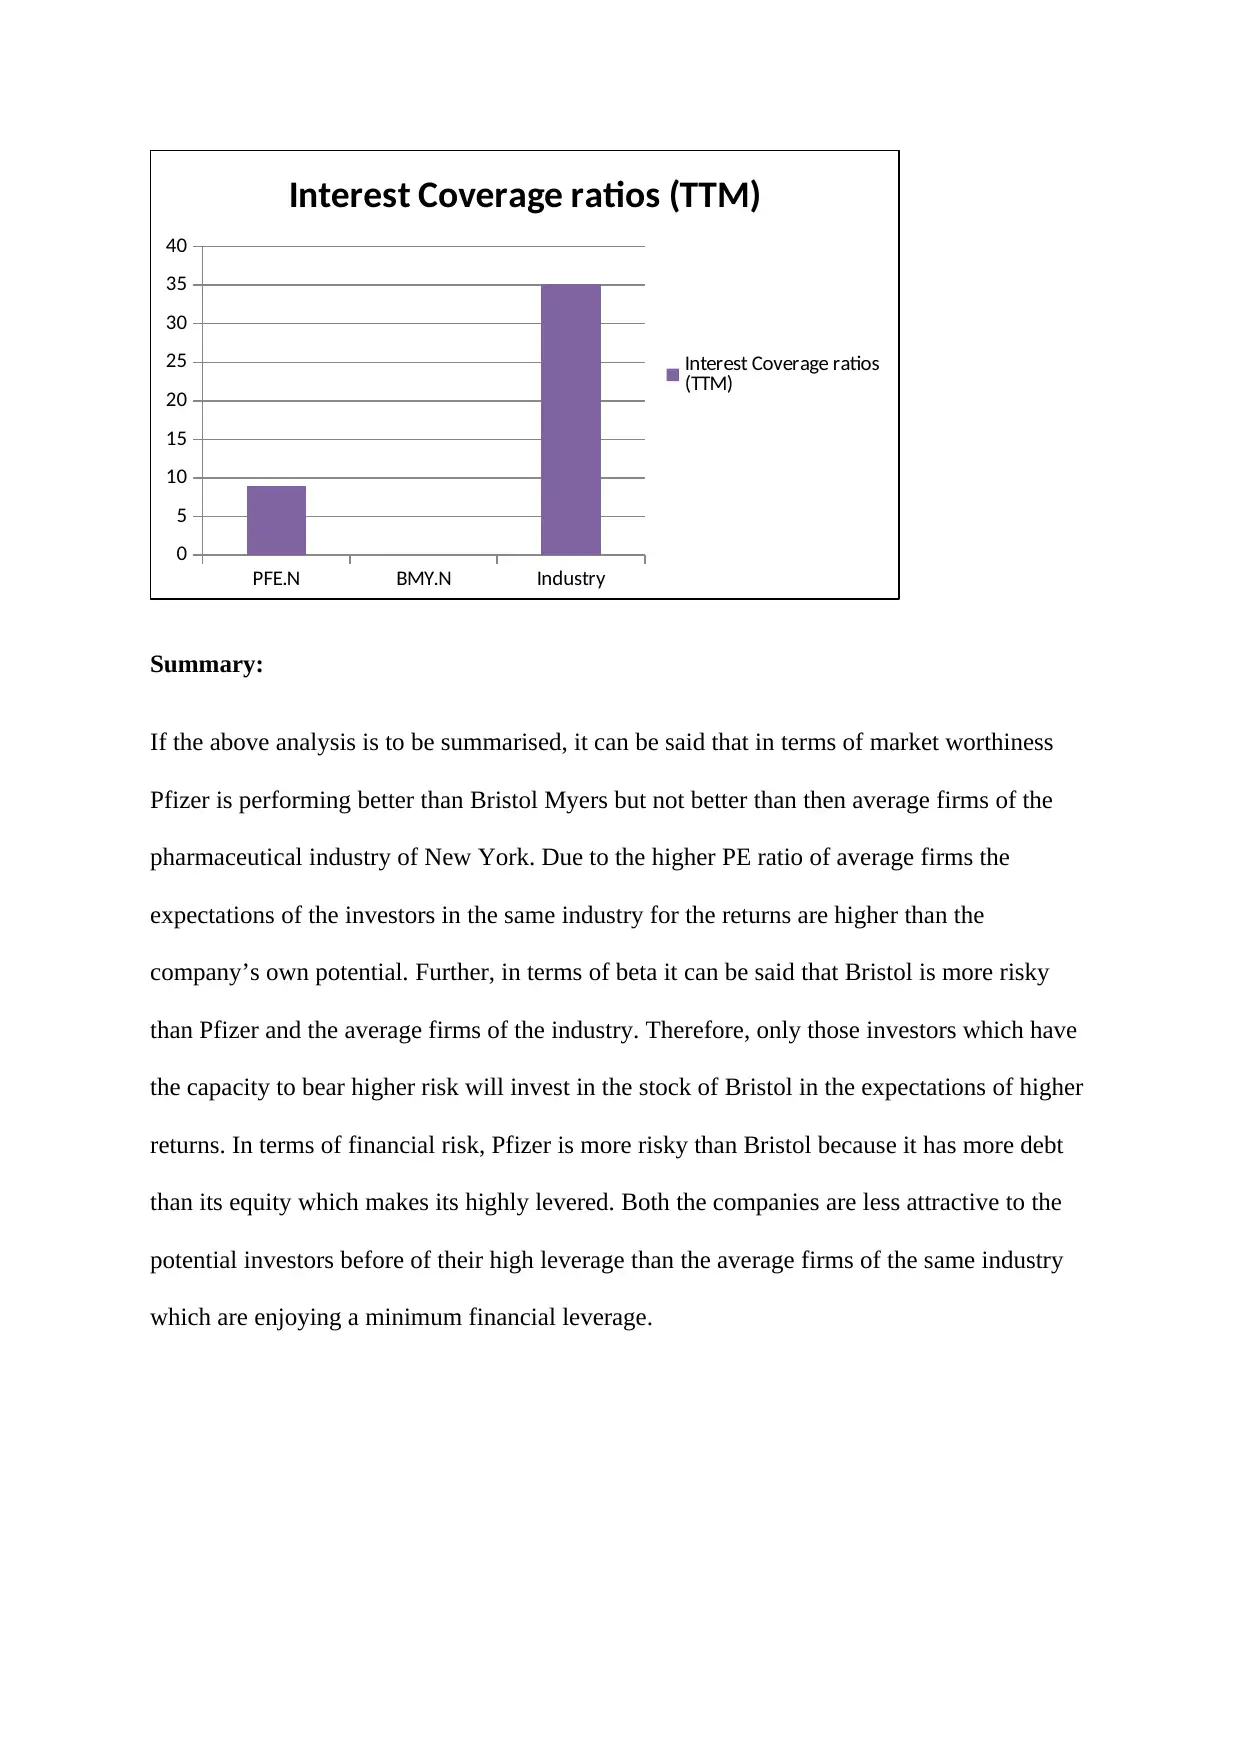
This financial analysis report compares Pfizer Inc. and Bristol Myers Squibb Co., both operating in the pharmaceutical industry. The analysis includes key financial ratios such as the Price-Earnings (P/E) ratio, Beta, Total Debt to Equity ratio, and Interest Coverage ratios. The report evaluates the market worthiness, risk profiles, and financial leverage of both companies, comparing their performance against each other and the industry average. Pfizer's P/E ratio suggests higher growth expectations, while its beta indicates it's less risky than Bristol Myers but more risky than the average companies in the industry. Bristol Myers has a higher beta, indicating higher risk. The debt-equity ratios reveal that both companies are more highly leveraged than the industry average, with Pfizer having a higher proportion of debt. The report concludes with a summary of the findings, highlighting the strengths and weaknesses of each company based on the financial ratios analyzed and provides references to support the analysis.

FINANCIAL ANALYSIS
Company’s Background
For the purpose of financial analysis the two companies that have been selected are Pfizer
Inc. (PFE.N) and Bristol Myers Squibb Co. (BMY.N). Both the companies are listed on the
New York stock exchange and are operating within the pharmaceutical industry. Pfizer was
incorporated in 1942. It is engaged in the business of development and manufacturing of
various health products. Pfizer has around 13 brands and operates through its two major
segments: Pfizer Innovative Health (IH) and Pfizer Essential Health (EH). Bristol Myers
Squibb was incorporated in 1933. The product range of the company includes chemically
synthesized drugs, small molecules and products manufactured from biological biologics
processes (Reuters, 2018 a).
The results of the major financial ratios in relation to both the companies are as follows:
PFE.N BMY.N Industry
P/E (TTM) 26.26 23.62 31.23
Beta 0.99 1.19 0.92
Total Debt to Equity (aka D/E)
(MRQ)
74.88 55.9 12.74
Interest Coverage ratios (TTM) 8.93 - 35.11
Price-Earnings Ratio:
The price earnings ratio is a prominent valuation ratio that depicts the relationship of stock
price of the company with its earnings per share. It is calculated by dividing market price per
share with the earnings per share (Tracy, 2012). It tells about the price that the potential buyer
Paraphrase This Document
Need a fresh take? Get an instant paraphrase of this document with our AI Paraphraser

in the market is willing to pay on the basis of the current earnings on such shares (My
Accounting Course, 2018). This ratio is used by the investors to determine the fair market
value of the shares of the company on the basis of future predictions of earnings per share. In
the present case, the price earnings ratio of Pfizer is 26.26 times and this shows that investors
of Pfizer’s are willing to pay $ 26.26 for each dollar of earnings. Bristol Myers on the other
hand, has a price earnings ratio of 23.62 which implies that investors of Bristol Myers will be
ready pay $23.62 for each dollar of earnings (Reuters, 2018 a). Thus, it can be said that the
potential investors have higher growth expectations form Pfizer and therefore it has brighter
future prospects than Bristol. The average industry ratio in this regards is 31.23 times and this
shows that the investors are ready to pay $ 31.23 on an average for every dollar of earnings
(Reuters, 2018 a). As the PE ratios of both the companies are lower than the average industry
ratio it is clear that the investors of the both the companies have lower expectations from the
future of the companies.
PFE.N BMY.N Industry
0
5
10
15
20
25
30
35
P/E (TTM)
P/E (TTM)
Beta:
A company’s beta is the measure of a systematic risk. It is the measurement of volatility of
the returns as compared to the whole market (Corporate Finance Institute, 2017). The

company with higher beta has a higher risk and since it has the capacity to bear higher risk it
also has the potential to generate higher returns for its investors. A beta has a significant
impact on the share value of the company. Though, beta is calculated on the basis of the past
returns but it is important to realise that past returns are not necessary to estimate the future
returns potential of the company. Given that the beta for the stock market is 1 it has been
identified that the average industry beta of pharmaceutical industry is 0.92 (Reuters, 2018, b).
This shows that for each one 1% movement (increase or decrease) in the rate of return
provided in the market, the investors of the companies operating in that industry will also
expect 0.92% movement (increase or decrease) in the return. The lower beta than 1 shows
that average companies are less risky than the entire stock market due to its variability. The
beta of Pfizer is 0.99% and this implies that the investors will expect an increase (or
decrease) of .99% in the returns with the change in the market return of 1% either on the
upward side or downward side. When compared to the industry average the stock of the
company is more risky than the average companies in the same industry but still it is less
risky than the stock market (Reuters, 2018, a). The beta of Bristol Myers is highest among the
three units under consideration. The beta of 1.19% shows that with each 1% increase (or
decrease) in stock market return, the potential investors will expect an increase (or decrease)
of 1.19% in the company’s return. This shows that Bristol riskier than Pfizer and also it is
more risky than the average companies of the same industry. The variability of returns of
Bristol is higher than both its core competitor Pfizer and the other companies in this industry.
⊘ This is a preview!⊘
Do you want full access?
Subscribe today to unlock all pages.

Trusted by 1+ million students worldwide

PFE.N BMY.N Industry
0
0.2
0.4
0.6
0.8
1
1.2
1.4
Beta
Beta
Total debt-equity ratio:
This is the gearing ratio that shows the relative proportion of company’s assets that are
financed using the external debt with that which are financed using the internal funds. This
ratio is calculated using the total debt with the total equity of the firm. A higher debt equity
ratio implies higher proportion of debt in the total capital structure of the company. The said
ratio is used to measure the financial leverage of the company. The debt equity ratio of Pfizer
shows that the company finances its assets using debt which is 77.88% of the total capital
structure. This shows that the company is highly levered due to heavy proportion of external
debt. For each dollar of equity the company has around 78 cents in leverage. On the other
hand the debt equity ratio of Bristol Myer is 55.9% which shows that for each dollar of equity
company has 60 cents of leverage. A debt equity ratio of 1 is generally preferable as it does
not impose the financial risk on the company. When, both the companies are compared Pfizer
has more financial risk than Bristol Myer as it has higher proportion of debt in comparison to
the proportion of equity in their respective capital structures. However, looking at the debt
equity ratio of the average firms of the same industry which is merely 12.74% it can be said
Paraphrase This Document
Need a fresh take? Get an instant paraphrase of this document with our AI Paraphraser

that the average companies of the industry are not highly levered and Pfizer and Bristol are
among those companies that are more prone to the risk of insolvency.
0 PFE.N BMY.N Industry
0
10
20
30
40
50
60
70
80
Debt-Equity MRQ
Total Debt to Equity (aka
D/E) (MRQ)
Interest Coverage Ratios:
The interest coverage ratio is also a gearing ratio that is used to measure a company’s ability
in relation to payment of interest element for the loan funds borrowed by such company. It is
determined using the formula under which earnings before interest and tax is divided by the
interest expense borne by the company in the given year. In case of Pfizer, the interest
coverage ratio is 8.93 times which shows that the earnings of the company are 8.93 times
higher than its interest obligations and hence it can easily afford making payments in respect
of its interest obligations. However, in case of Bristol Myers, the interest coverage could not
be determined as it is not available on Reuters. The interest coverage ratio of the average
firms in the same industry is far better than Pfizer. This shows that the Pfizer is not earning
sufficient profits as much as the other firms are earning in relation to its financial obligations
towards interest on the loan sums.

PFE.N BMY.N Industry
0
5
10
15
20
25
30
35
40
Interest Coverage ratios (TTM)
Interest Coverage ratios
(TTM)
Summary:
If the above analysis is to be summarised, it can be said that in terms of market worthiness
Pfizer is performing better than Bristol Myers but not better than then average firms of the
pharmaceutical industry of New York. Due to the higher PE ratio of average firms the
expectations of the investors in the same industry for the returns are higher than the
company’s own potential. Further, in terms of beta it can be said that Bristol is more risky
than Pfizer and the average firms of the industry. Therefore, only those investors which have
the capacity to bear higher risk will invest in the stock of Bristol in the expectations of higher
returns. In terms of financial risk, Pfizer is more risky than Bristol because it has more debt
than its equity which makes its highly levered. Both the companies are less attractive to the
potential investors before of their high leverage than the average firms of the same industry
which are enjoying a minimum financial leverage.
⊘ This is a preview!⊘
Do you want full access?
Subscribe today to unlock all pages.

Trusted by 1+ million students worldwide

References:
Corporate Finance, 2017. Beta. Available at:
https://corporatefinanceinstitute.com/resources/knowledge/valuation/what-is-beta-guide/
Accessed on: 26.11.2018
My Accounting Course, 2018. Debt Equity Ratio. Available at:
https://www.myaccountingcourse.com/financial-ratios/debt-to-equity-ratio Accessed on:
26.11.2018
My Accounting Course, 2018. Price Earnings Ratio. Available at:
https://www.myaccountingcourse.com/financial-ratios/price-earnings-ratio Accessed on:
26.11.2018
Reuters, 2018 a. Bristol-Myers Squibb Co (BMY.N). Available at:
https://in.reuters.com/finance/stocks/financial-highlights/BMY.N Accessed on: 26.11.2018
Reuters, 2018 b. Pfizer Inc. (PFE.N). Available at:
https://in.reuters.com/finance/stocks/financial-highlights/PFE.N Accessed on: 26.11.2018.
Tracy, A. 2012. Ratio Analysis Fundamentals: How 17 Financial Ratios Can Allow You to
Analyse Any Business on the Planet. RatioAnalysis.net.
1 out of 7
Related Documents
Your All-in-One AI-Powered Toolkit for Academic Success.
+13062052269
info@desklib.com
Available 24*7 on WhatsApp / Email
Unlock your academic potential
Copyright © 2020–2026 A2Z Services. All Rights Reserved. Developed and managed by ZUCOL.


