PGBM12 Financial Management & Control: Zurich Plc Financial Analysis
VerifiedAdded on 2023/06/10
|27
|5445
|80
Report
AI Summary
This report provides a detailed financial analysis of Zurich Plc, a manufacturing company, using ratio analysis to assess its profitability, liquidity, gearing, and asset utilization. The analysis covers the financial years 2015 and 2016, highlighting key trends and areas of concern for the board of directors. Limitations of ratio analysis are also discussed. Additionally, the report evaluates capital budgeting techniques for Johnson Ltd, another office equipment manufacturer, considering investment appraisal methods like net present value, payback period, accounting rate of return, and internal rate of return. The benefits and limitations of each technique are examined, along with potential sources of finance for investment purposes.

RUNNING HEAD: ACCOUNTING
financial analysis
financial analysis
Paraphrase This Document
Need a fresh take? Get an instant paraphrase of this document with our AI Paraphraser
Accounting 1
Contents
Introduction...........................................................................................................................................2
Part A - Zurich Plc.................................................................................................................................2
Requirement 1...................................................................................................................................2
Profitability ratios..........................................................................................................................2
Liquidity ratios..............................................................................................................................5
Gearing ratios................................................................................................................................6
Asset utilization ratios...................................................................................................................8
Investor potential ratios...............................................................................................................10
Requirement 2.................................................................................................................................11
Limitation of ratio analysis..........................................................................................................11
Part B - Johnson Ltd............................................................................................................................12
Requirement 1.................................................................................................................................12
Payback period............................................................................................................................13
Discounted payback period..........................................................................................................14
Accounting rate of return.............................................................................................................14
Net present value.........................................................................................................................16
Internal rate of return...................................................................................................................16
Requirement 2.................................................................................................................................18
Evaluation of capital budgeting techniques and their benefits and limitations.............................18
Possible sources of finance..........................................................................................................22
Conclusion...........................................................................................................................................23
References...........................................................................................................................................24
Accounting 2
Introduction
This report provides a detail financial analysis of Zurich Plc. Which is a public limited
company engaged in manufacturing and supplying office equipment. The board of directors
of the company has raised certain concerns after looking at the financial statements of the
company for the past two years. They found the results unsatisfactory and want a report on
the performance of Zurich in aspects of its profitability and liquidity. For this purpose, the
most effective tool of financial management that is ratio analysis is been used to measure
company’s financial performance and position over the past years. Apart from measuring the
financial components the ratio analysis also provides a deep and typical interpretation of the
results. In addition to this the report also states the limitations of the analysis to be carried
out.
The second part of the report deals with the calculation of capital budgeting techniques
required by Johnson Ltd who is a manufacturer of office equipment. The company is looking
forward to make an investment in purchasing a new machine. For this purpose various
investment appraisal techniques are been used like Net present value, payback period,
accounting rate of return and many more. The part also deals with the benefits and limitations
of each technique along with describing the possible and various sources for raising finance
for this investment purpose.
Part A - Zurich Plc.
Requirement 1
Profitability ratios
These are most important ratios used by an investor for evaluating the performance of a
company. They reflect the capability of a company in making sound and sufficient profits
from its operations. Profit is basically a surplus amount left after pay all the expense from the
⊘ This is a preview!⊘
Do you want full access?
Subscribe today to unlock all pages.
Trusted by 1+ million students worldwide
Accounting 3
revenue generated by the business during a specific financial year. A company has a sound
profitability position only when it can earn high profits which contributes to its growth and
success. However, it is a fact that profits of a company have significant impact on the
financial health of the company (Bragg, 2012). Therefore, in order to evaluate the
profitability of Zurich three main ratios are been calculated as follows:
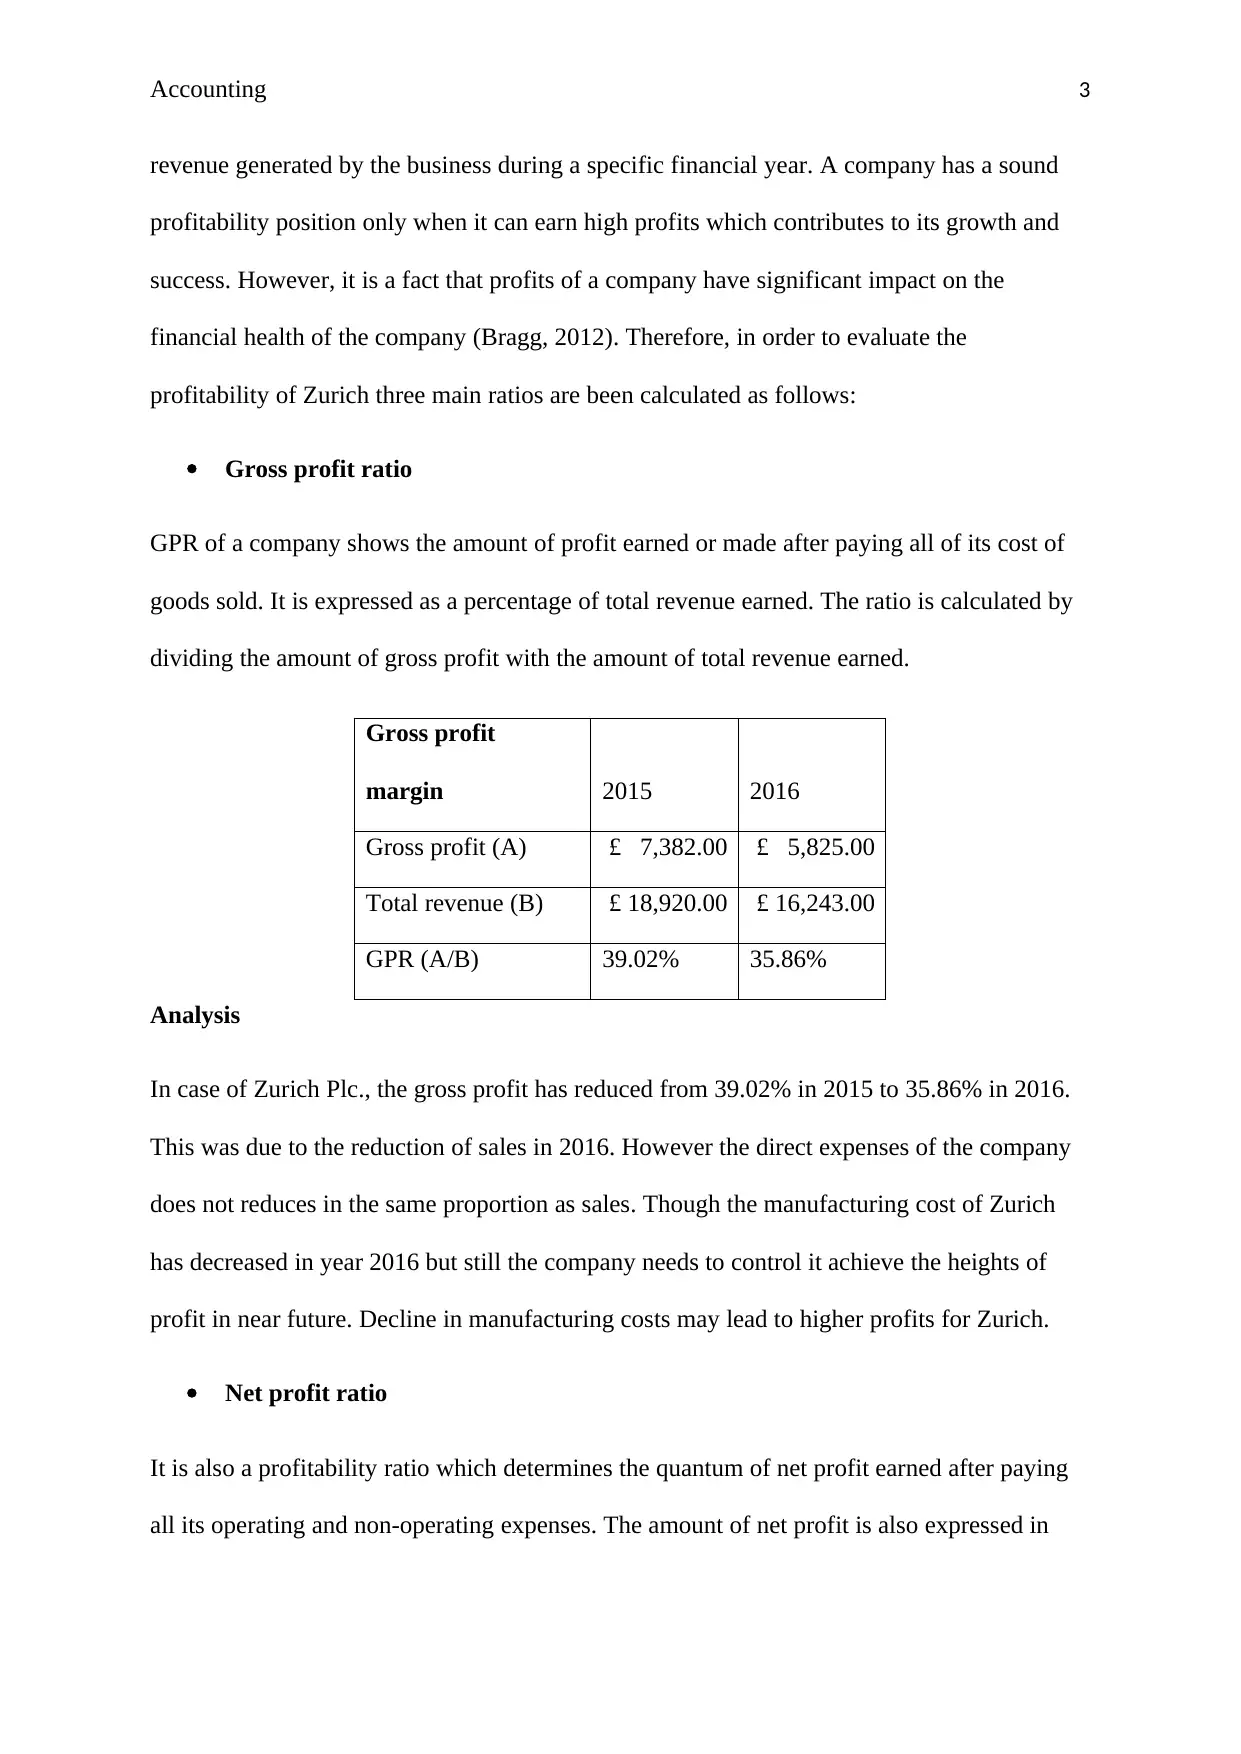
Gross profit ratio
GPR of a company shows the amount of profit earned or made after paying all of its cost of
goods sold. It is expressed as a percentage of total revenue earned. The ratio is calculated by
dividing the amount of gross profit with the amount of total revenue earned.
Gross profit
margin 2015 2016
Gross profit (A) £ 7,382.00 £ 5,825.00
Total revenue (B) £ 18,920.00 £ 16,243.00
GPR (A/B) 39.02% 35.86%
Analysis
In case of Zurich Plc., the gross profit has reduced from 39.02% in 2015 to 35.86% in 2016.
This was due to the reduction of sales in 2016. However the direct expenses of the company
does not reduces in the same proportion as sales. Though the manufacturing cost of Zurich
has decreased in year 2016 but still the company needs to control it achieve the heights of
profit in near future. Decline in manufacturing costs may lead to higher profits for Zurich.
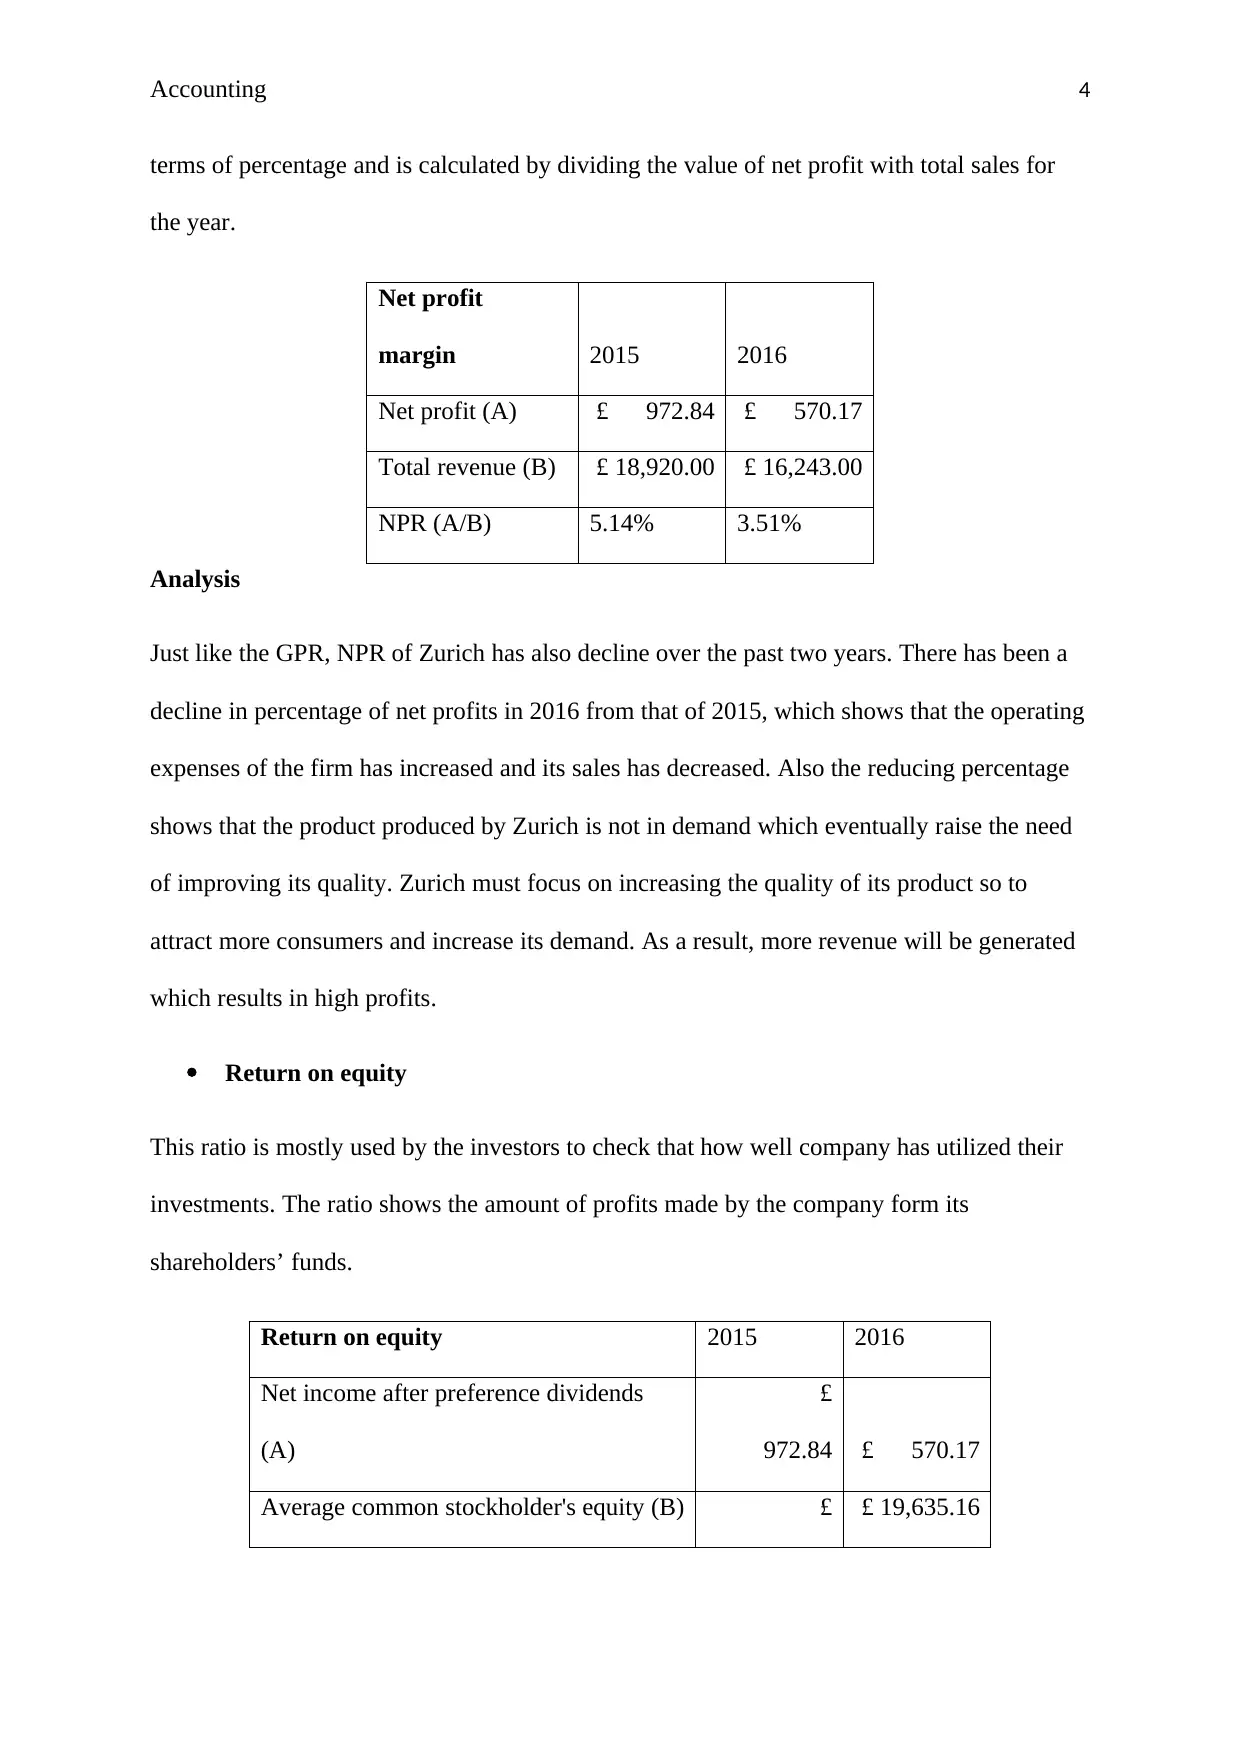
Net profit ratio
It is also a profitability ratio which determines the quantum of net profit earned after paying
all its operating and non-operating expenses. The amount of net profit is also expressed in
revenue generated by the business during a specific financial year. A company has a sound
profitability position only when it can earn high profits which contributes to its growth and
success. However, it is a fact that profits of a company have significant impact on the
financial health of the company (Bragg, 2012). Therefore, in order to evaluate the
profitability of Zurich three main ratios are been calculated as follows:
Gross profit ratio
GPR of a company shows the amount of profit earned or made after paying all of its cost of
goods sold. It is expressed as a percentage of total revenue earned. The ratio is calculated by
dividing the amount of gross profit with the amount of total revenue earned.
Gross profit
margin 2015 2016
Gross profit (A) £ 7,382.00 £ 5,825.00
Total revenue (B) £ 18,920.00 £ 16,243.00
GPR (A/B) 39.02% 35.86%
Analysis
In case of Zurich Plc., the gross profit has reduced from 39.02% in 2015 to 35.86% in 2016.
This was due to the reduction of sales in 2016. However the direct expenses of the company
does not reduces in the same proportion as sales. Though the manufacturing cost of Zurich
has decreased in year 2016 but still the company needs to control it achieve the heights of
profit in near future. Decline in manufacturing costs may lead to higher profits for Zurich.
Net profit ratio
It is also a profitability ratio which determines the quantum of net profit earned after paying
all its operating and non-operating expenses. The amount of net profit is also expressed in
Paraphrase This Document
Need a fresh take? Get an instant paraphrase of this document with our AI Paraphraser
Accounting 4
terms of percentage and is calculated by dividing the value of net profit with total sales for
the year.
Net profit
margin 2015 2016
Net profit (A) £ 972.84 £ 570.17
Total revenue (B) £ 18,920.00 £ 16,243.00
NPR (A/B) 5.14% 3.51%
Analysis
Just like the GPR, NPR of Zurich has also decline over the past two years. There has been a
decline in percentage of net profits in 2016 from that of 2015, which shows that the operating
expenses of the firm has increased and its sales has decreased. Also the reducing percentage
shows that the product produced by Zurich is not in demand which eventually raise the need
of improving its quality. Zurich must focus on increasing the quality of its product so to
attract more consumers and increase its demand. As a result, more revenue will be generated
which results in high profits.
Return on equity
This ratio is mostly used by the investors to check that how well company has utilized their
investments. The ratio shows the amount of profits made by the company form its
shareholders’ funds.
Return on equity 2015 2016
Net income after preference dividends
(A)
£
972.84 £ 570.17
Average common stockholder's equity (B) £ £ 19,635.16
Accounting 5
20,108.00
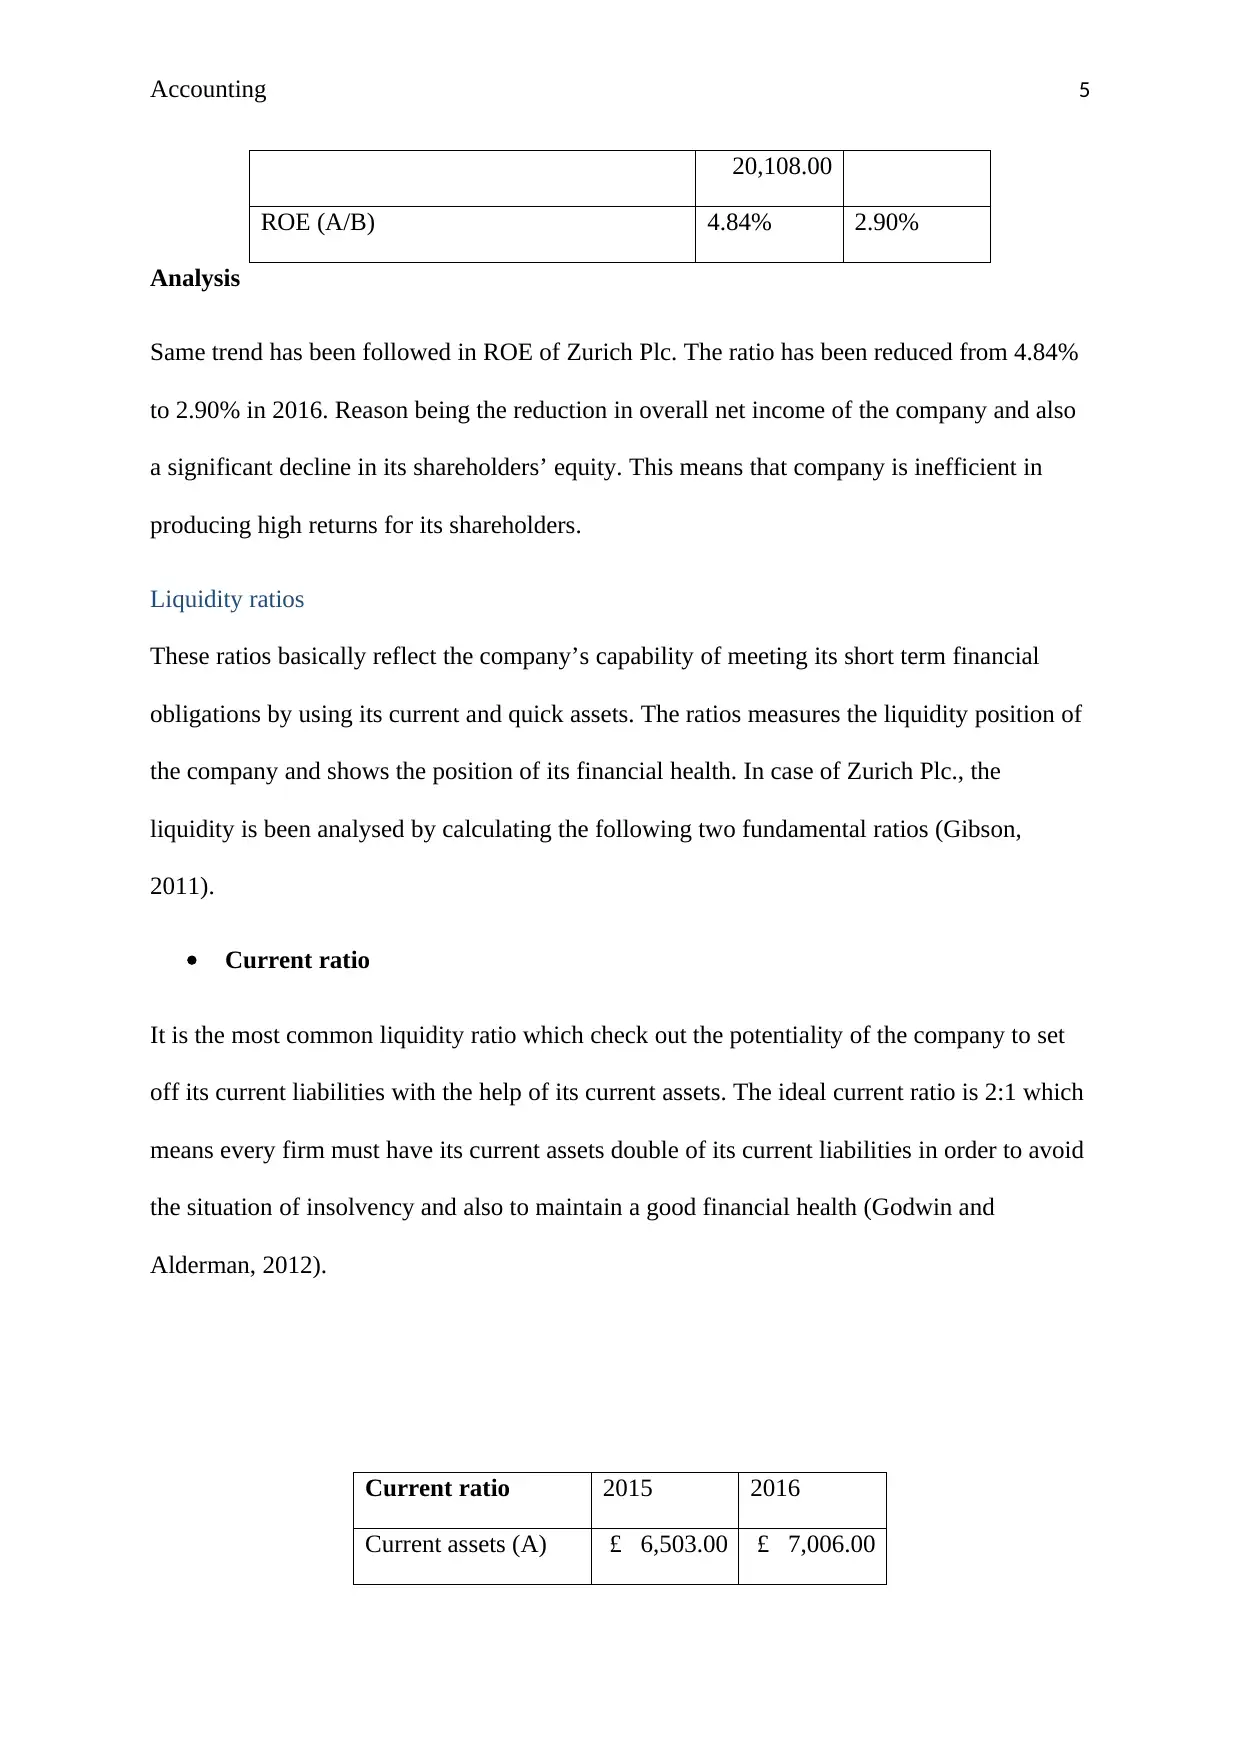
ROE (A/B) 4.84% 2.90%
Analysis
Same trend has been followed in ROE of Zurich Plc. The ratio has been reduced from 4.84%
to 2.90% in 2016. Reason being the reduction in overall net income of the company and also
a significant decline in its shareholders’ equity. This means that company is inefficient in
producing high returns for its shareholders.
Liquidity ratios
These ratios basically reflect the company’s capability of meeting its short term financial
obligations by using its current and quick assets. The ratios measures the liquidity position of
the company and shows the position of its financial health. In case of Zurich Plc., the
liquidity is been analysed by calculating the following two fundamental ratios (Gibson,
2011).
Current ratio
It is the most common liquidity ratio which check out the potentiality of the company to set
off its current liabilities with the help of its current assets. The ideal current ratio is 2:1 which
means every firm must have its current assets double of its current liabilities in order to avoid
the situation of insolvency and also to maintain a good financial health (Godwin and
Alderman, 2012).
Current ratio 2015 2016
Current assets (A) £ 6,503.00 £ 7,006.00
20,108.00
ROE (A/B) 4.84% 2.90%
Analysis
Same trend has been followed in ROE of Zurich Plc. The ratio has been reduced from 4.84%
to 2.90% in 2016. Reason being the reduction in overall net income of the company and also
a significant decline in its shareholders’ equity. This means that company is inefficient in
producing high returns for its shareholders.
Liquidity ratios
These ratios basically reflect the company’s capability of meeting its short term financial
obligations by using its current and quick assets. The ratios measures the liquidity position of
the company and shows the position of its financial health. In case of Zurich Plc., the
liquidity is been analysed by calculating the following two fundamental ratios (Gibson,
2011).
Current ratio
It is the most common liquidity ratio which check out the potentiality of the company to set
off its current liabilities with the help of its current assets. The ideal current ratio is 2:1 which
means every firm must have its current assets double of its current liabilities in order to avoid
the situation of insolvency and also to maintain a good financial health (Godwin and
Alderman, 2012).
Current ratio 2015 2016
Current assets (A) £ 6,503.00 £ 7,006.00
⊘ This is a preview!⊘
Do you want full access?
Subscribe today to unlock all pages.
Trusted by 1+ million students worldwide
Accounting 6
Current liabilities
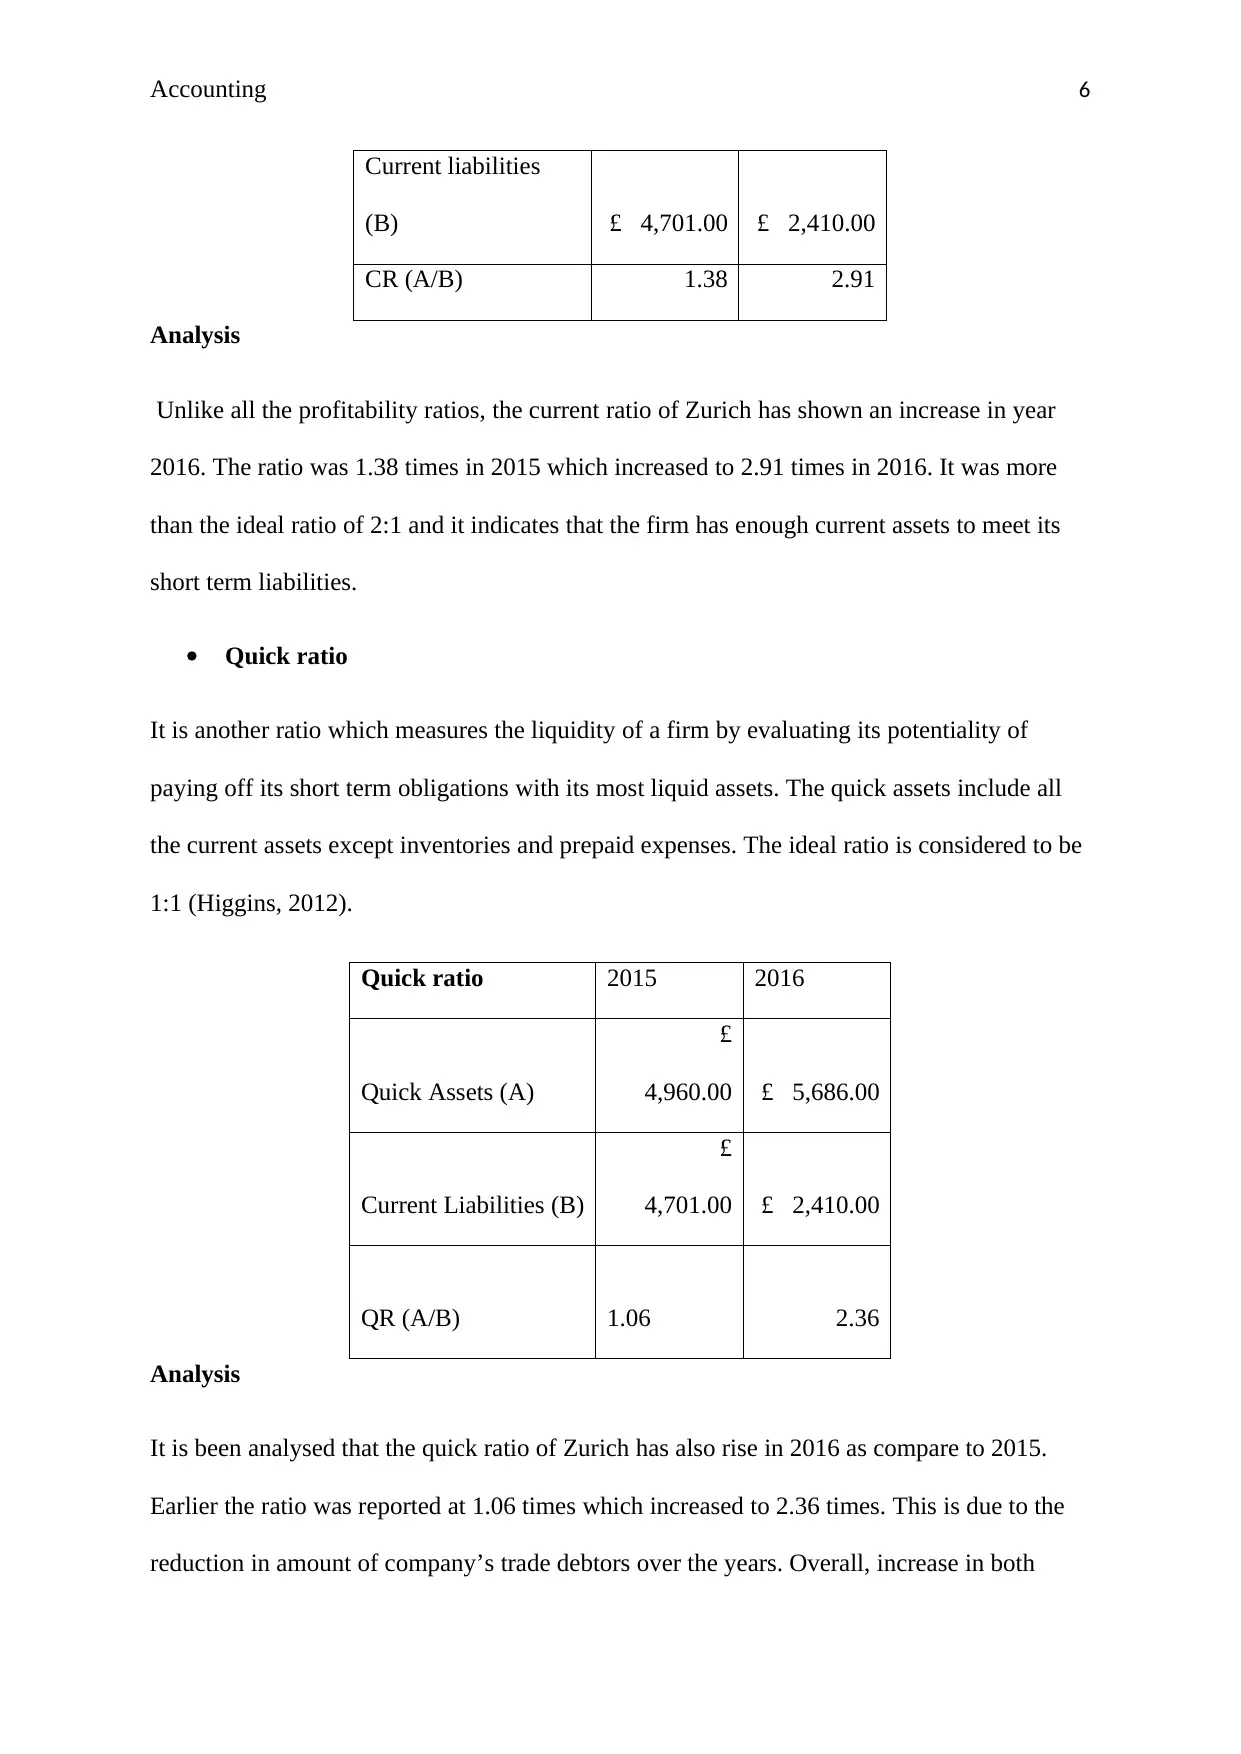
(B) £ 4,701.00 £ 2,410.00
CR (A/B) 1.38 2.91
Analysis
Unlike all the profitability ratios, the current ratio of Zurich has shown an increase in year
2016. The ratio was 1.38 times in 2015 which increased to 2.91 times in 2016. It was more
than the ideal ratio of 2:1 and it indicates that the firm has enough current assets to meet its
short term liabilities.
Quick ratio
It is another ratio which measures the liquidity of a firm by evaluating its potentiality of
paying off its short term obligations with its most liquid assets. The quick assets include all
the current assets except inventories and prepaid expenses. The ideal ratio is considered to be
1:1 (Higgins, 2012).
Quick ratio 2015 2016
Quick Assets (A)
£
4,960.00 £ 5,686.00
Current Liabilities (B)
£
4,701.00 £ 2,410.00
QR (A/B) 1.06 2.36
Analysis
It is been analysed that the quick ratio of Zurich has also rise in 2016 as compare to 2015.
Earlier the ratio was reported at 1.06 times which increased to 2.36 times. This is due to the
reduction in amount of company’s trade debtors over the years. Overall, increase in both
Current liabilities
(B) £ 4,701.00 £ 2,410.00
CR (A/B) 1.38 2.91
Analysis
Unlike all the profitability ratios, the current ratio of Zurich has shown an increase in year
2016. The ratio was 1.38 times in 2015 which increased to 2.91 times in 2016. It was more
than the ideal ratio of 2:1 and it indicates that the firm has enough current assets to meet its
short term liabilities.
Quick ratio
It is another ratio which measures the liquidity of a firm by evaluating its potentiality of
paying off its short term obligations with its most liquid assets. The quick assets include all
the current assets except inventories and prepaid expenses. The ideal ratio is considered to be
1:1 (Higgins, 2012).
Quick ratio 2015 2016
Quick Assets (A)
£
4,960.00 £ 5,686.00
Current Liabilities (B)
£
4,701.00 £ 2,410.00
QR (A/B) 1.06 2.36
Analysis
It is been analysed that the quick ratio of Zurich has also rise in 2016 as compare to 2015.
Earlier the ratio was reported at 1.06 times which increased to 2.36 times. This is due to the
reduction in amount of company’s trade debtors over the years. Overall, increase in both
Paraphrase This Document
Need a fresh take? Get an instant paraphrase of this document with our AI Paraphraser
Accounting 7
current and quick ratio shows that there is no need for the company to dispose its fixed assets
to meet its liabilities. Also Zurich has a sound liquidity position.
Gearing ratios
These ratios basically deals with the analysis of company’s capital structure. They shows the
amount of financial leverage taken by the firm and the risk involved in it. The ratios basically
shows the amount of borrowed funds in comparison with the equity of the company (Jenter
and Lewellen, 2015). To analyse the capital structure of Zurich, certain gearing ratios are
been calculated which are as follows:
Debt equity ratio
It shows the proportion of debt taken by the company against its equity. The ratio helps in
knowing the portion of company’s assets that are financed through debt and the assets which
are funded by equity. A high ratio is unfavourable as it reflects high financial risk (Kimmel,
Weygandt and Kieso, 2010).
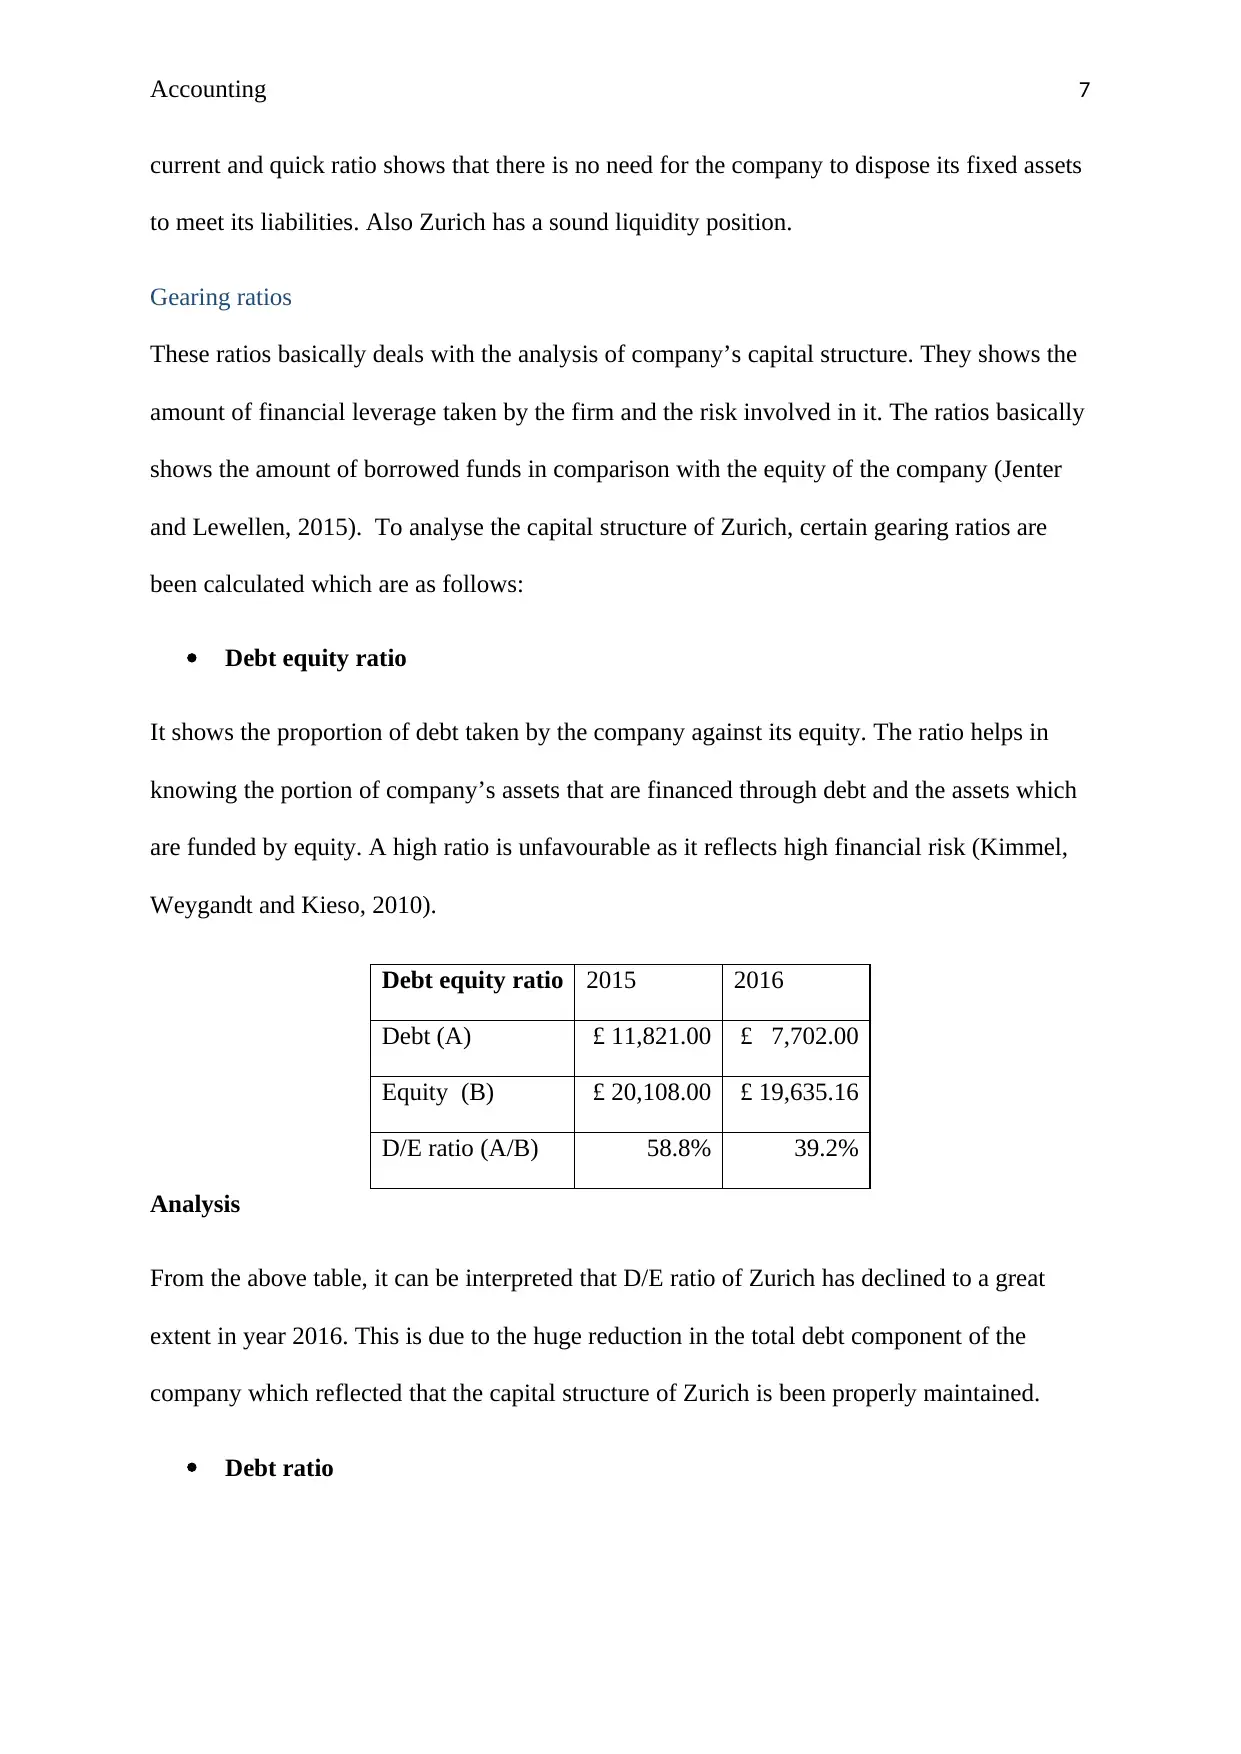
Debt equity ratio 2015 2016
Debt (A) £ 11,821.00 £ 7,702.00
Equity (B) £ 20,108.00 £ 19,635.16
D/E ratio (A/B) 58.8% 39.2%
Analysis
From the above table, it can be interpreted that D/E ratio of Zurich has declined to a great
extent in year 2016. This is due to the huge reduction in the total debt component of the
company which reflected that the capital structure of Zurich is been properly maintained.
Debt ratio
current and quick ratio shows that there is no need for the company to dispose its fixed assets
to meet its liabilities. Also Zurich has a sound liquidity position.
Gearing ratios
These ratios basically deals with the analysis of company’s capital structure. They shows the
amount of financial leverage taken by the firm and the risk involved in it. The ratios basically
shows the amount of borrowed funds in comparison with the equity of the company (Jenter
and Lewellen, 2015). To analyse the capital structure of Zurich, certain gearing ratios are
been calculated which are as follows:
Debt equity ratio
It shows the proportion of debt taken by the company against its equity. The ratio helps in
knowing the portion of company’s assets that are financed through debt and the assets which
are funded by equity. A high ratio is unfavourable as it reflects high financial risk (Kimmel,
Weygandt and Kieso, 2010).
Debt equity ratio 2015 2016
Debt (A) £ 11,821.00 £ 7,702.00
Equity (B) £ 20,108.00 £ 19,635.16
D/E ratio (A/B) 58.8% 39.2%
Analysis
From the above table, it can be interpreted that D/E ratio of Zurich has declined to a great
extent in year 2016. This is due to the huge reduction in the total debt component of the
company which reflected that the capital structure of Zurich is been properly maintained.
Debt ratio
Accounting 8
It is a financial ratio which measures the extent of company’s leverage. It shows the
percentage of the firm’s assets that are financed through debt. A high ratio is risky for the
companies.
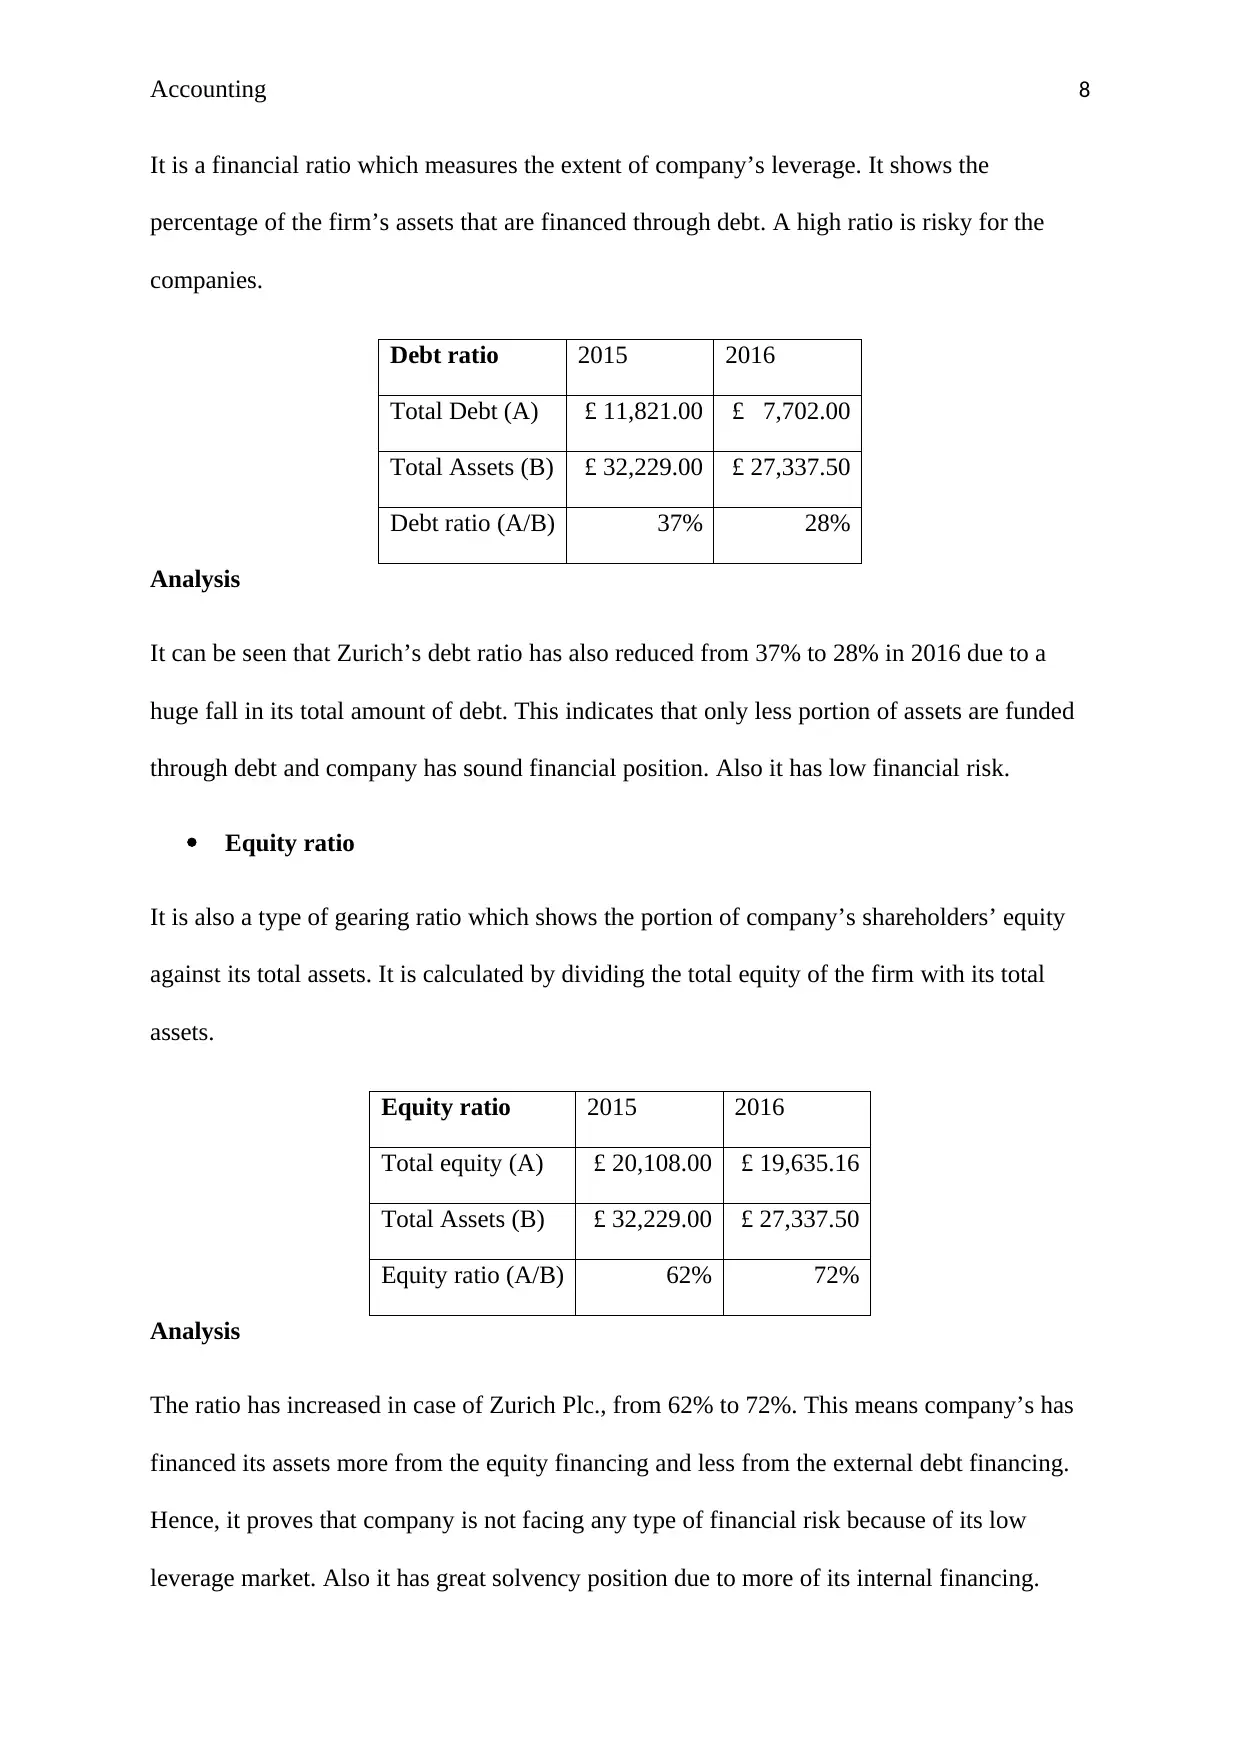
Debt ratio 2015 2016
Total Debt (A) £ 11,821.00 £ 7,702.00
Total Assets (B) £ 32,229.00 £ 27,337.50
Debt ratio (A/B) 37% 28%
Analysis
It can be seen that Zurich’s debt ratio has also reduced from 37% to 28% in 2016 due to a
huge fall in its total amount of debt. This indicates that only less portion of assets are funded
through debt and company has sound financial position. Also it has low financial risk.
Equity ratio
It is also a type of gearing ratio which shows the portion of company’s shareholders’ equity
against its total assets. It is calculated by dividing the total equity of the firm with its total
assets.
Equity ratio 2015 2016
Total equity (A) £ 20,108.00 £ 19,635.16
Total Assets (B) £ 32,229.00 £ 27,337.50
Equity ratio (A/B) 62% 72%
Analysis
The ratio has increased in case of Zurich Plc., from 62% to 72%. This means company’s has
financed its assets more from the equity financing and less from the external debt financing.
Hence, it proves that company is not facing any type of financial risk because of its low
leverage market. Also it has great solvency position due to more of its internal financing.
It is a financial ratio which measures the extent of company’s leverage. It shows the
percentage of the firm’s assets that are financed through debt. A high ratio is risky for the
companies.
Debt ratio 2015 2016
Total Debt (A) £ 11,821.00 £ 7,702.00
Total Assets (B) £ 32,229.00 £ 27,337.50
Debt ratio (A/B) 37% 28%
Analysis
It can be seen that Zurich’s debt ratio has also reduced from 37% to 28% in 2016 due to a
huge fall in its total amount of debt. This indicates that only less portion of assets are funded
through debt and company has sound financial position. Also it has low financial risk.
Equity ratio
It is also a type of gearing ratio which shows the portion of company’s shareholders’ equity
against its total assets. It is calculated by dividing the total equity of the firm with its total
assets.
Equity ratio 2015 2016
Total equity (A) £ 20,108.00 £ 19,635.16
Total Assets (B) £ 32,229.00 £ 27,337.50
Equity ratio (A/B) 62% 72%
Analysis
The ratio has increased in case of Zurich Plc., from 62% to 72%. This means company’s has
financed its assets more from the equity financing and less from the external debt financing.
Hence, it proves that company is not facing any type of financial risk because of its low
leverage market. Also it has great solvency position due to more of its internal financing.
⊘ This is a preview!⊘
Do you want full access?
Subscribe today to unlock all pages.
Trusted by 1+ million students worldwide
Accounting 9
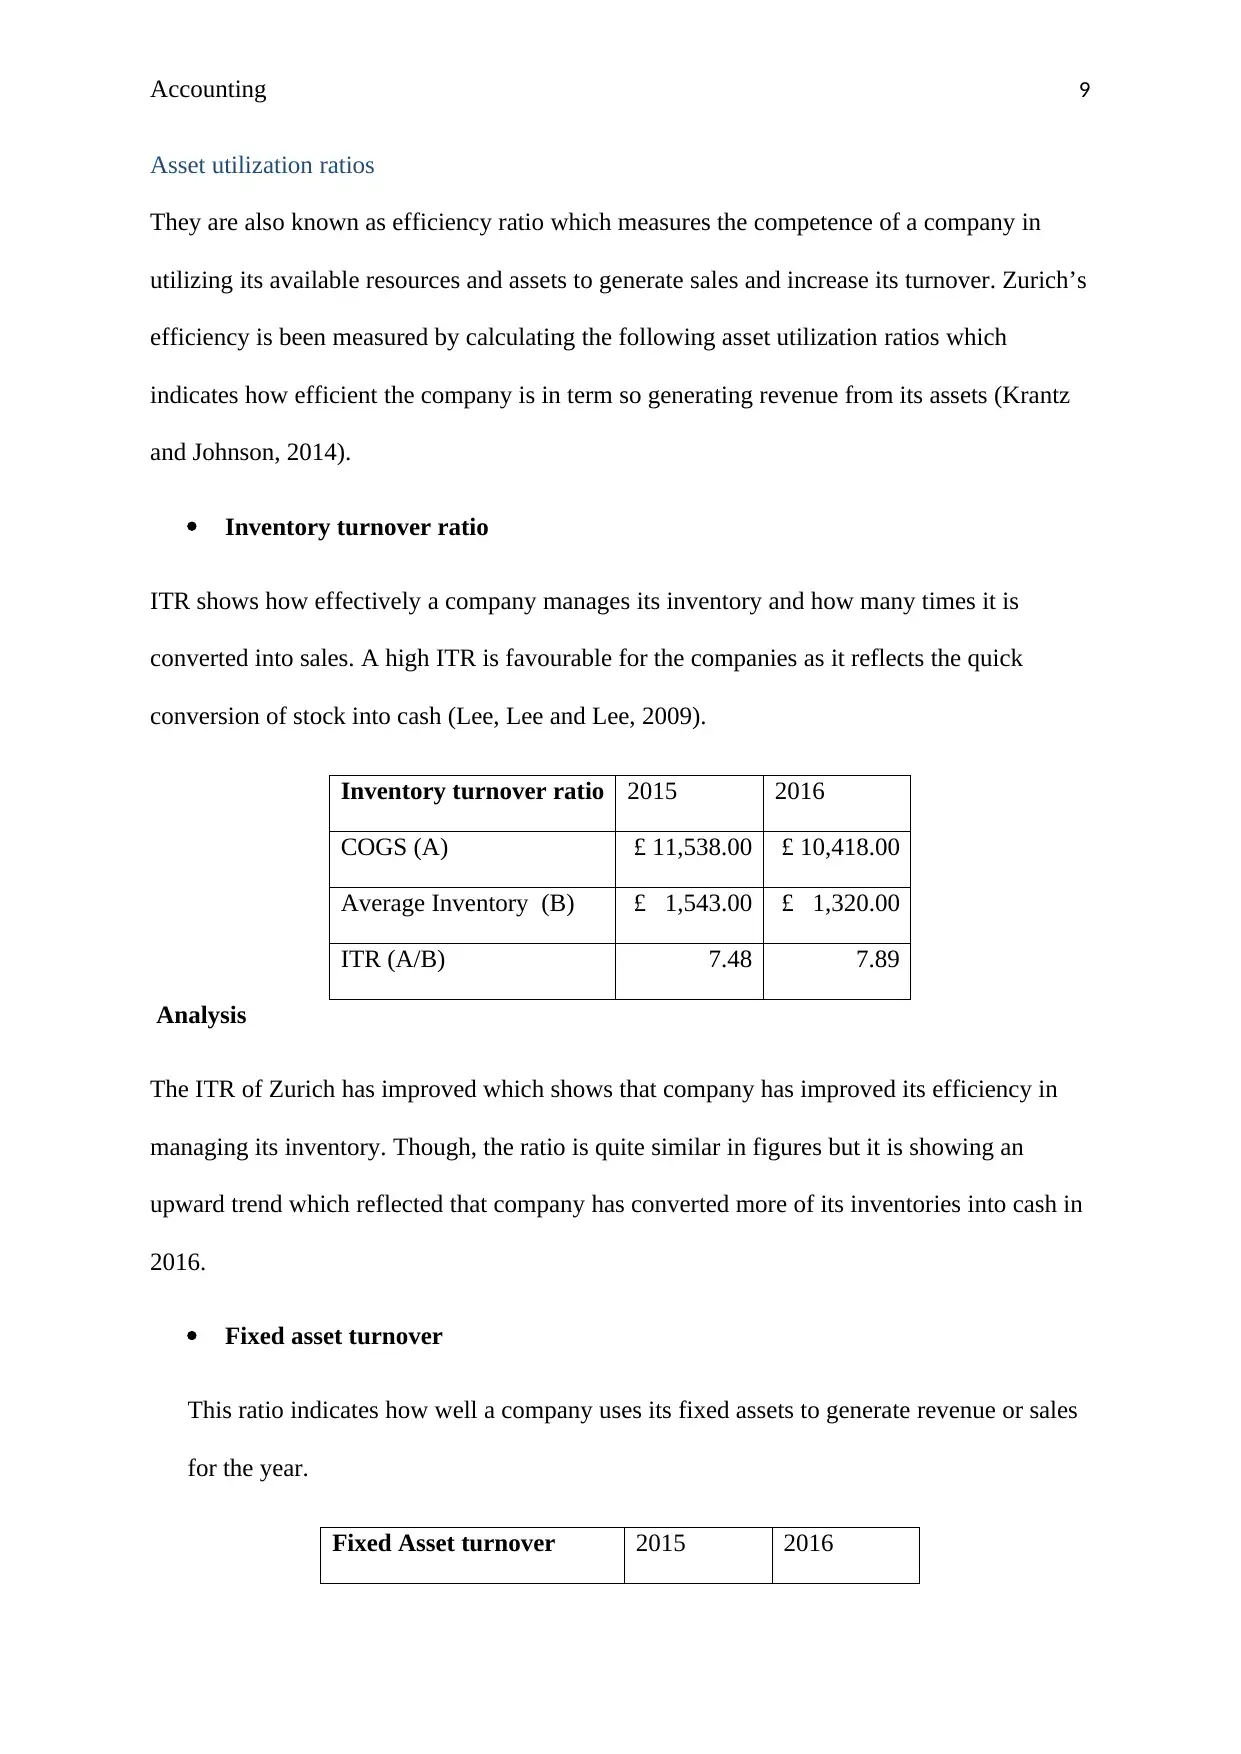
Asset utilization ratios
They are also known as efficiency ratio which measures the competence of a company in
utilizing its available resources and assets to generate sales and increase its turnover. Zurich’s
efficiency is been measured by calculating the following asset utilization ratios which
indicates how efficient the company is in term so generating revenue from its assets (Krantz
and Johnson, 2014).
Inventory turnover ratio
ITR shows how effectively a company manages its inventory and how many times it is
converted into sales. A high ITR is favourable for the companies as it reflects the quick
conversion of stock into cash (Lee, Lee and Lee, 2009).
Inventory turnover ratio 2015 2016
COGS (A) £ 11,538.00 £ 10,418.00
Average Inventory (B) £ 1,543.00 £ 1,320.00
ITR (A/B) 7.48 7.89
Analysis
The ITR of Zurich has improved which shows that company has improved its efficiency in
managing its inventory. Though, the ratio is quite similar in figures but it is showing an
upward trend which reflected that company has converted more of its inventories into cash in
2016.
Fixed asset turnover
This ratio indicates how well a company uses its fixed assets to generate revenue or sales
for the year.
Fixed Asset turnover 2015 2016
Paraphrase This Document
Need a fresh take? Get an instant paraphrase of this document with our AI Paraphraser
Accounting 10
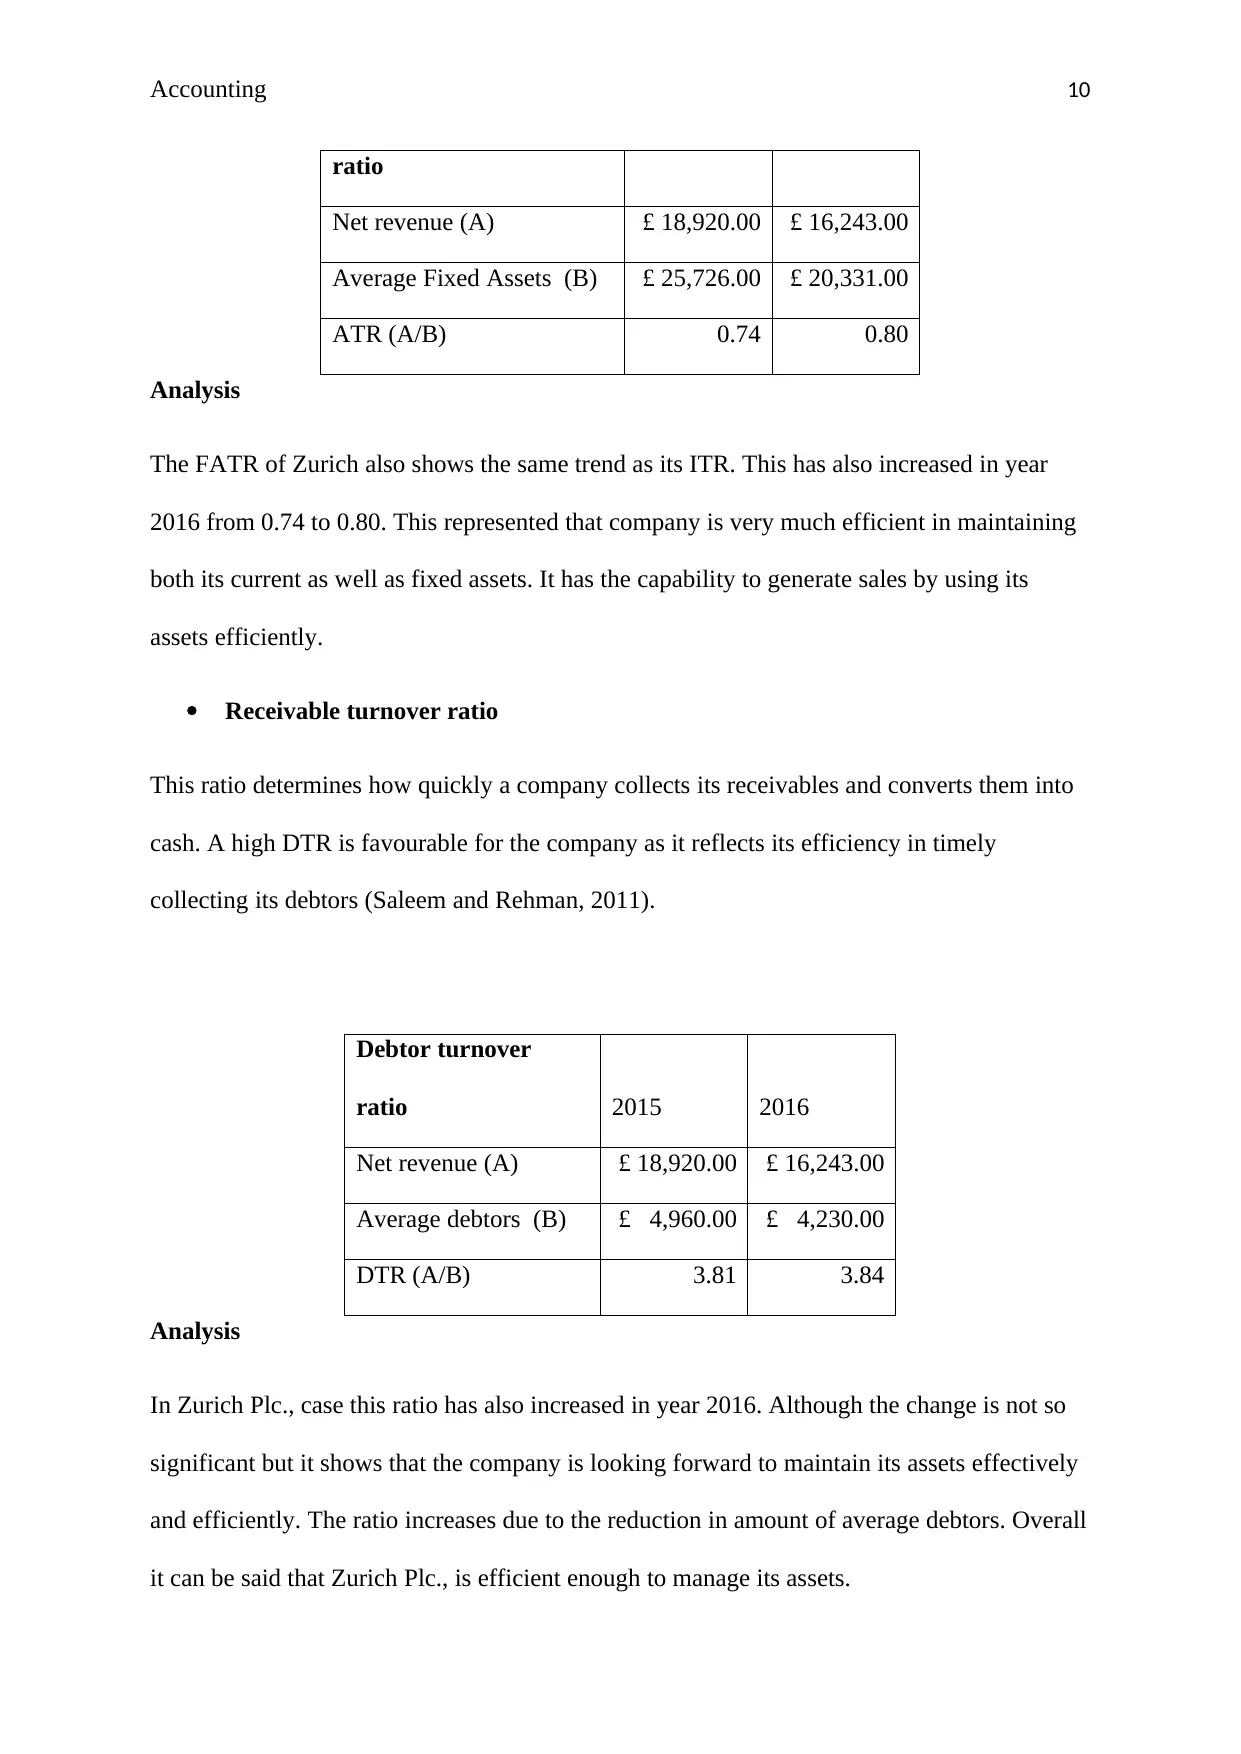
ratio
Net revenue (A) £ 18,920.00 £ 16,243.00
Average Fixed Assets (B) £ 25,726.00 £ 20,331.00
ATR (A/B) 0.74 0.80
Analysis
The FATR of Zurich also shows the same trend as its ITR. This has also increased in year
2016 from 0.74 to 0.80. This represented that company is very much efficient in maintaining
both its current as well as fixed assets. It has the capability to generate sales by using its
assets efficiently.
Receivable turnover ratio
This ratio determines how quickly a company collects its receivables and converts them into
cash. A high DTR is favourable for the company as it reflects its efficiency in timely
collecting its debtors (Saleem and Rehman, 2011).
Debtor turnover
ratio 2015 2016
Net revenue (A) £ 18,920.00 £ 16,243.00
Average debtors (B) £ 4,960.00 £ 4,230.00
DTR (A/B) 3.81 3.84
Analysis
In Zurich Plc., case this ratio has also increased in year 2016. Although the change is not so
significant but it shows that the company is looking forward to maintain its assets effectively
and efficiently. The ratio increases due to the reduction in amount of average debtors. Overall
it can be said that Zurich Plc., is efficient enough to manage its assets.
Accounting 11
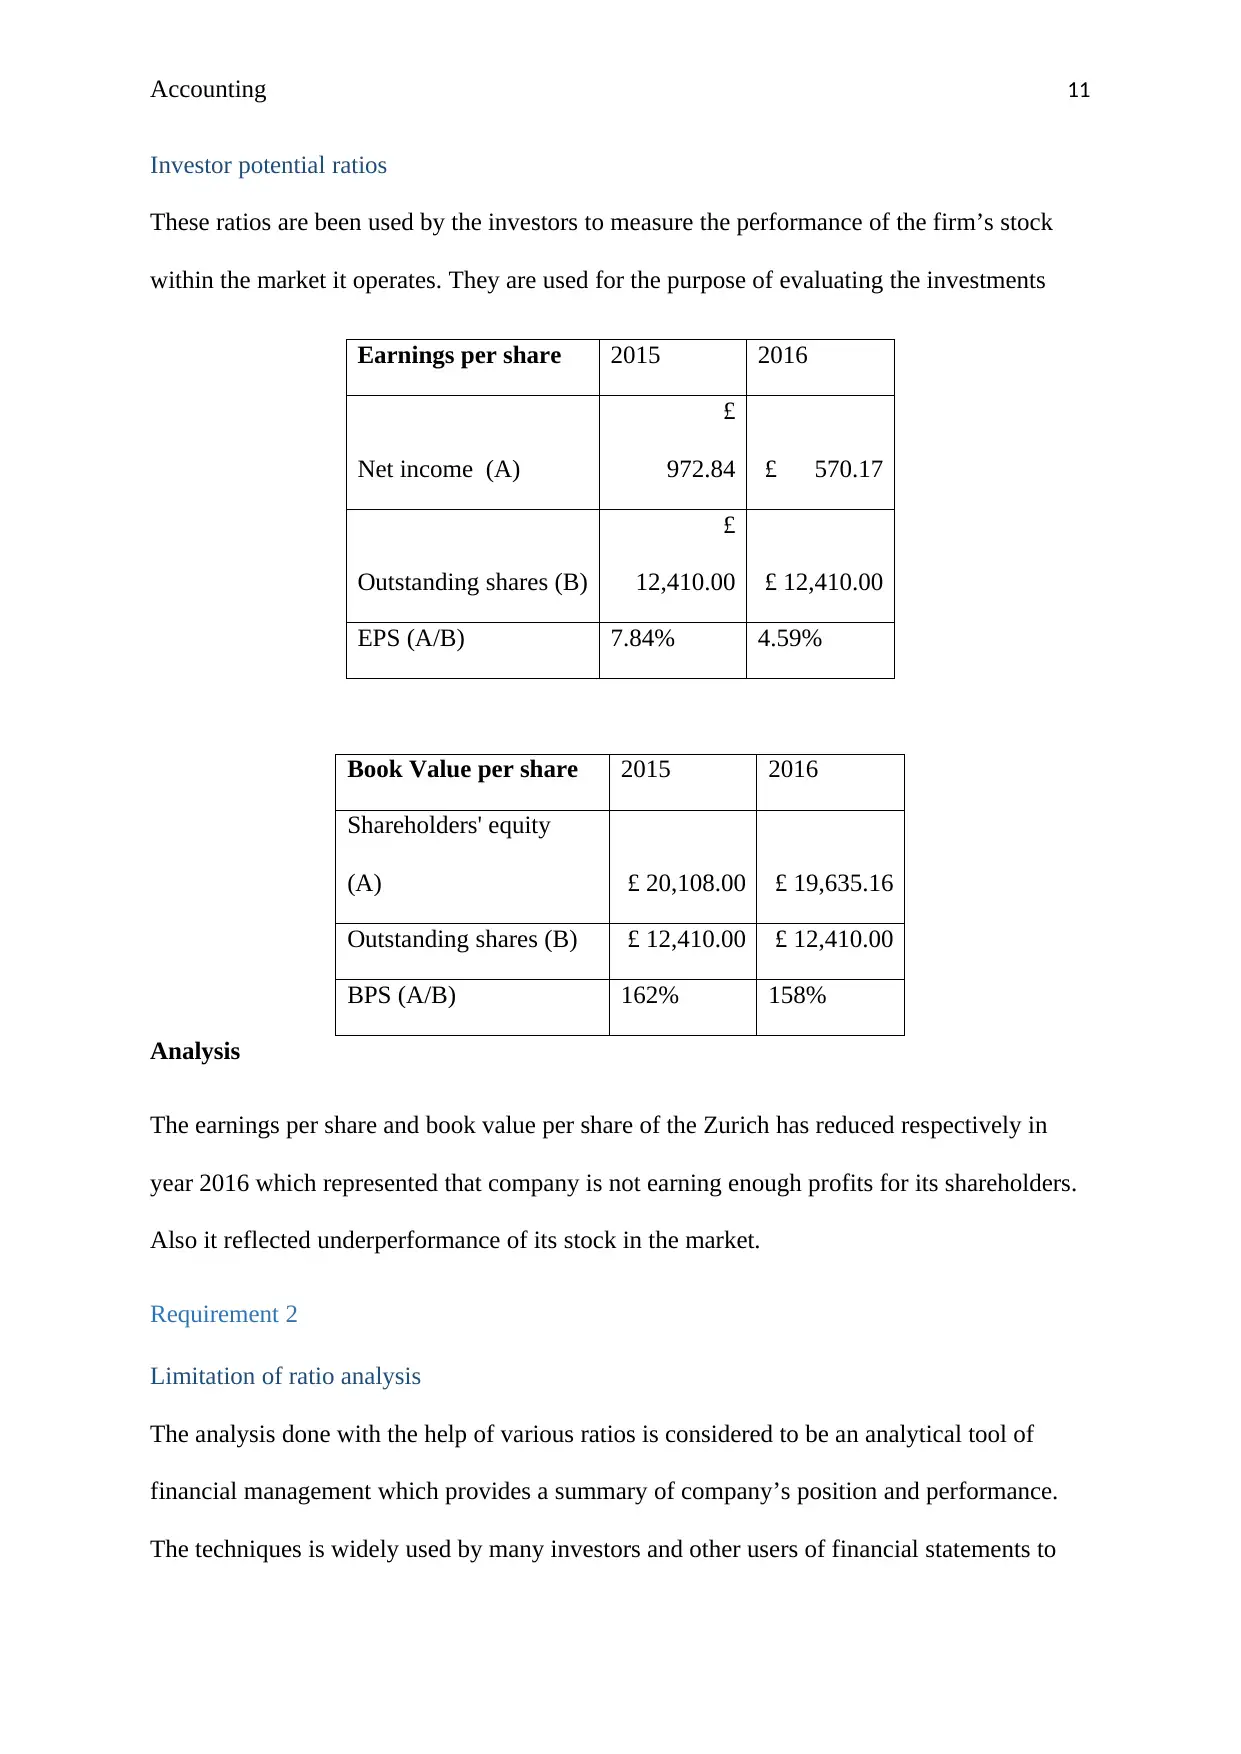
Investor potential ratios
These ratios are been used by the investors to measure the performance of the firm’s stock
within the market it operates. They are used for the purpose of evaluating the investments
Earnings per share 2015 2016
Net income (A)
£
972.84 £ 570.17
Outstanding shares (B)
£
12,410.00 £ 12,410.00
EPS (A/B) 7.84% 4.59%
Book Value per share 2015 2016
Shareholders' equity
(A) £ 20,108.00 £ 19,635.16
Outstanding shares (B) £ 12,410.00 £ 12,410.00
BPS (A/B) 162% 158%
Analysis
The earnings per share and book value per share of the Zurich has reduced respectively in
year 2016 which represented that company is not earning enough profits for its shareholders.
Also it reflected underperformance of its stock in the market.
Requirement 2
Limitation of ratio analysis
The analysis done with the help of various ratios is considered to be an analytical tool of
financial management which provides a summary of company’s position and performance.
The techniques is widely used by many investors and other users of financial statements to
⊘ This is a preview!⊘
Do you want full access?
Subscribe today to unlock all pages.
Trusted by 1+ million students worldwide
1 out of 27
Related Documents


Your All-in-One AI-Powered Toolkit for Academic Success.
+13062052269
info@desklib.com
Available 24*7 on WhatsApp / Email
![[object Object]](/_next/static/media/star-bottom.7253800d.svg)
Unlock your academic potential
Copyright © 2020–2026 A2Z Services. All Rights Reserved. Developed and managed by ZUCOL.