Pharmaceutical Company Ratio Analysis: A Financial Performance Review
VerifiedAdded on 2023/06/12
|23
|4360
|364
Report
AI Summary
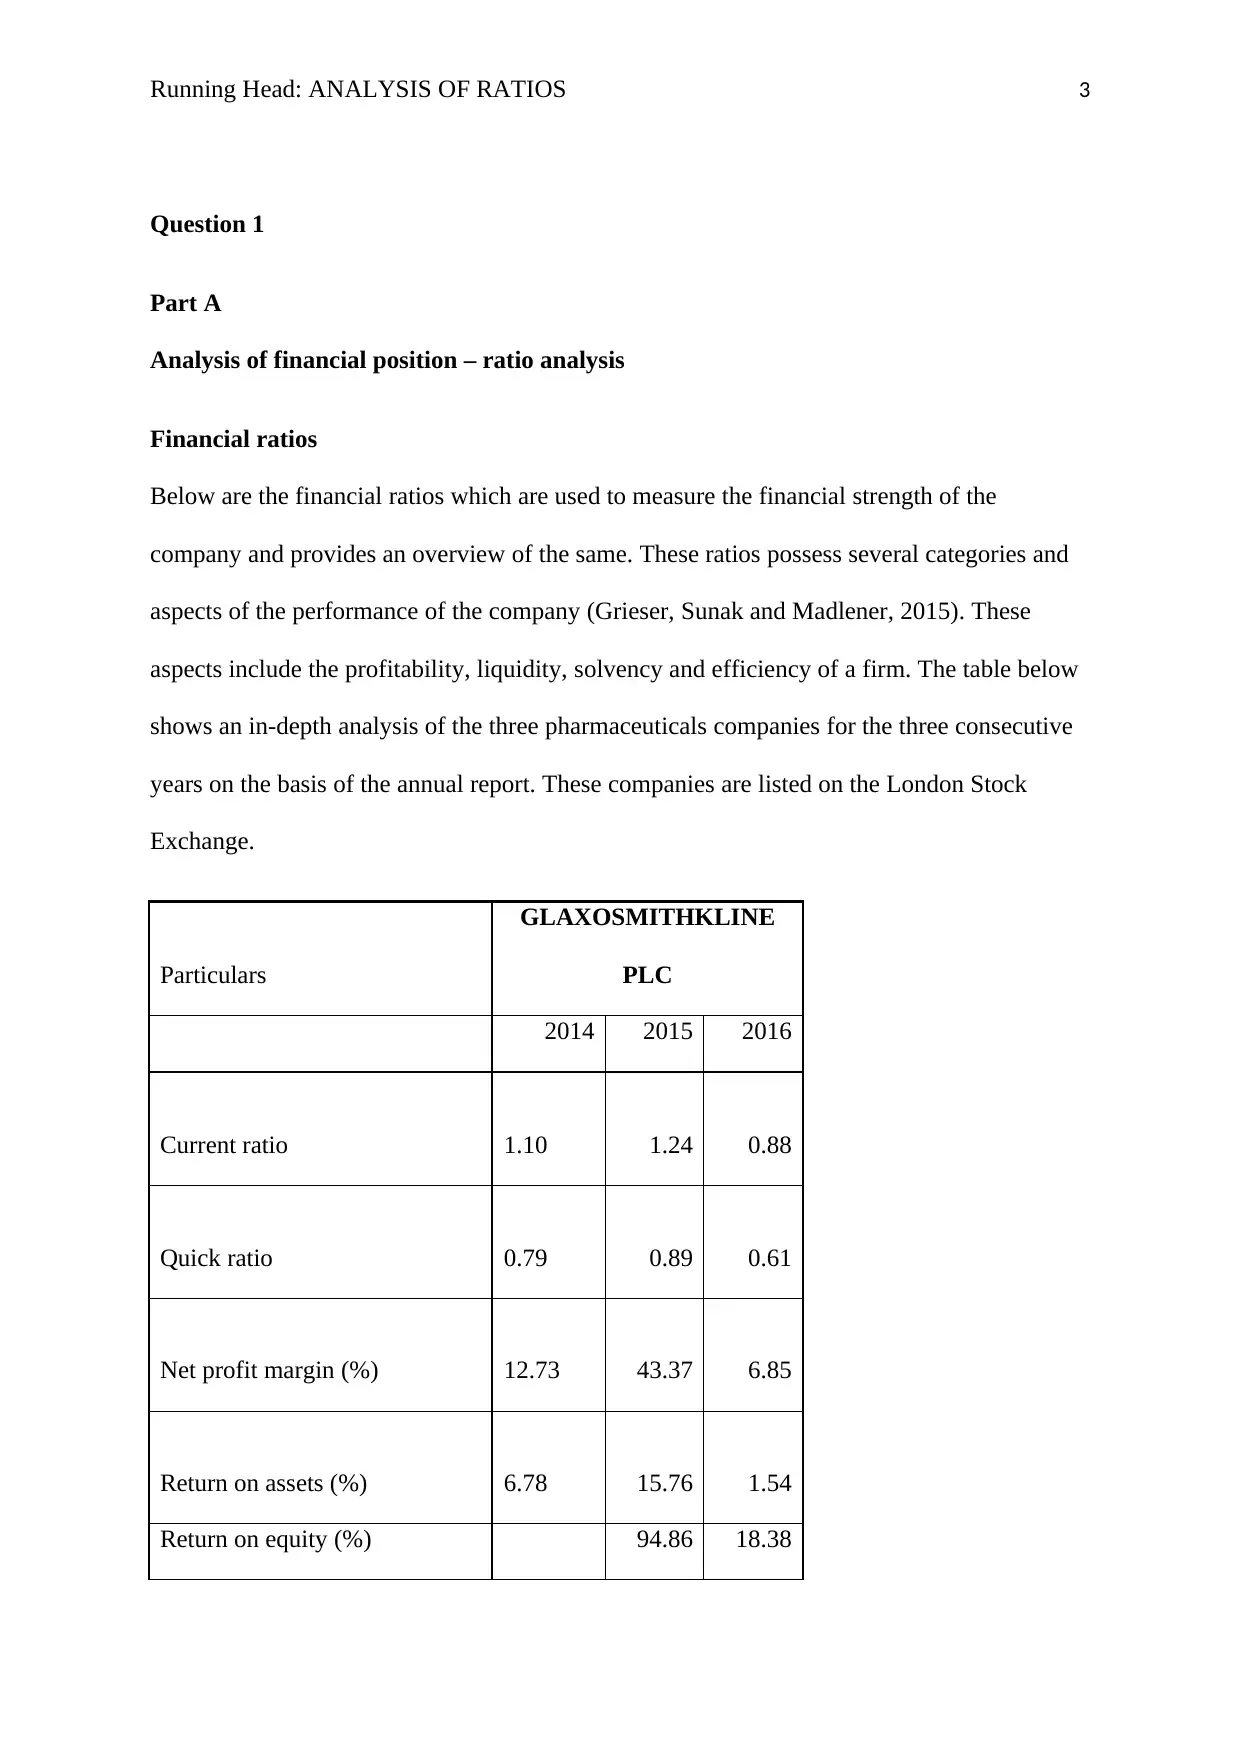
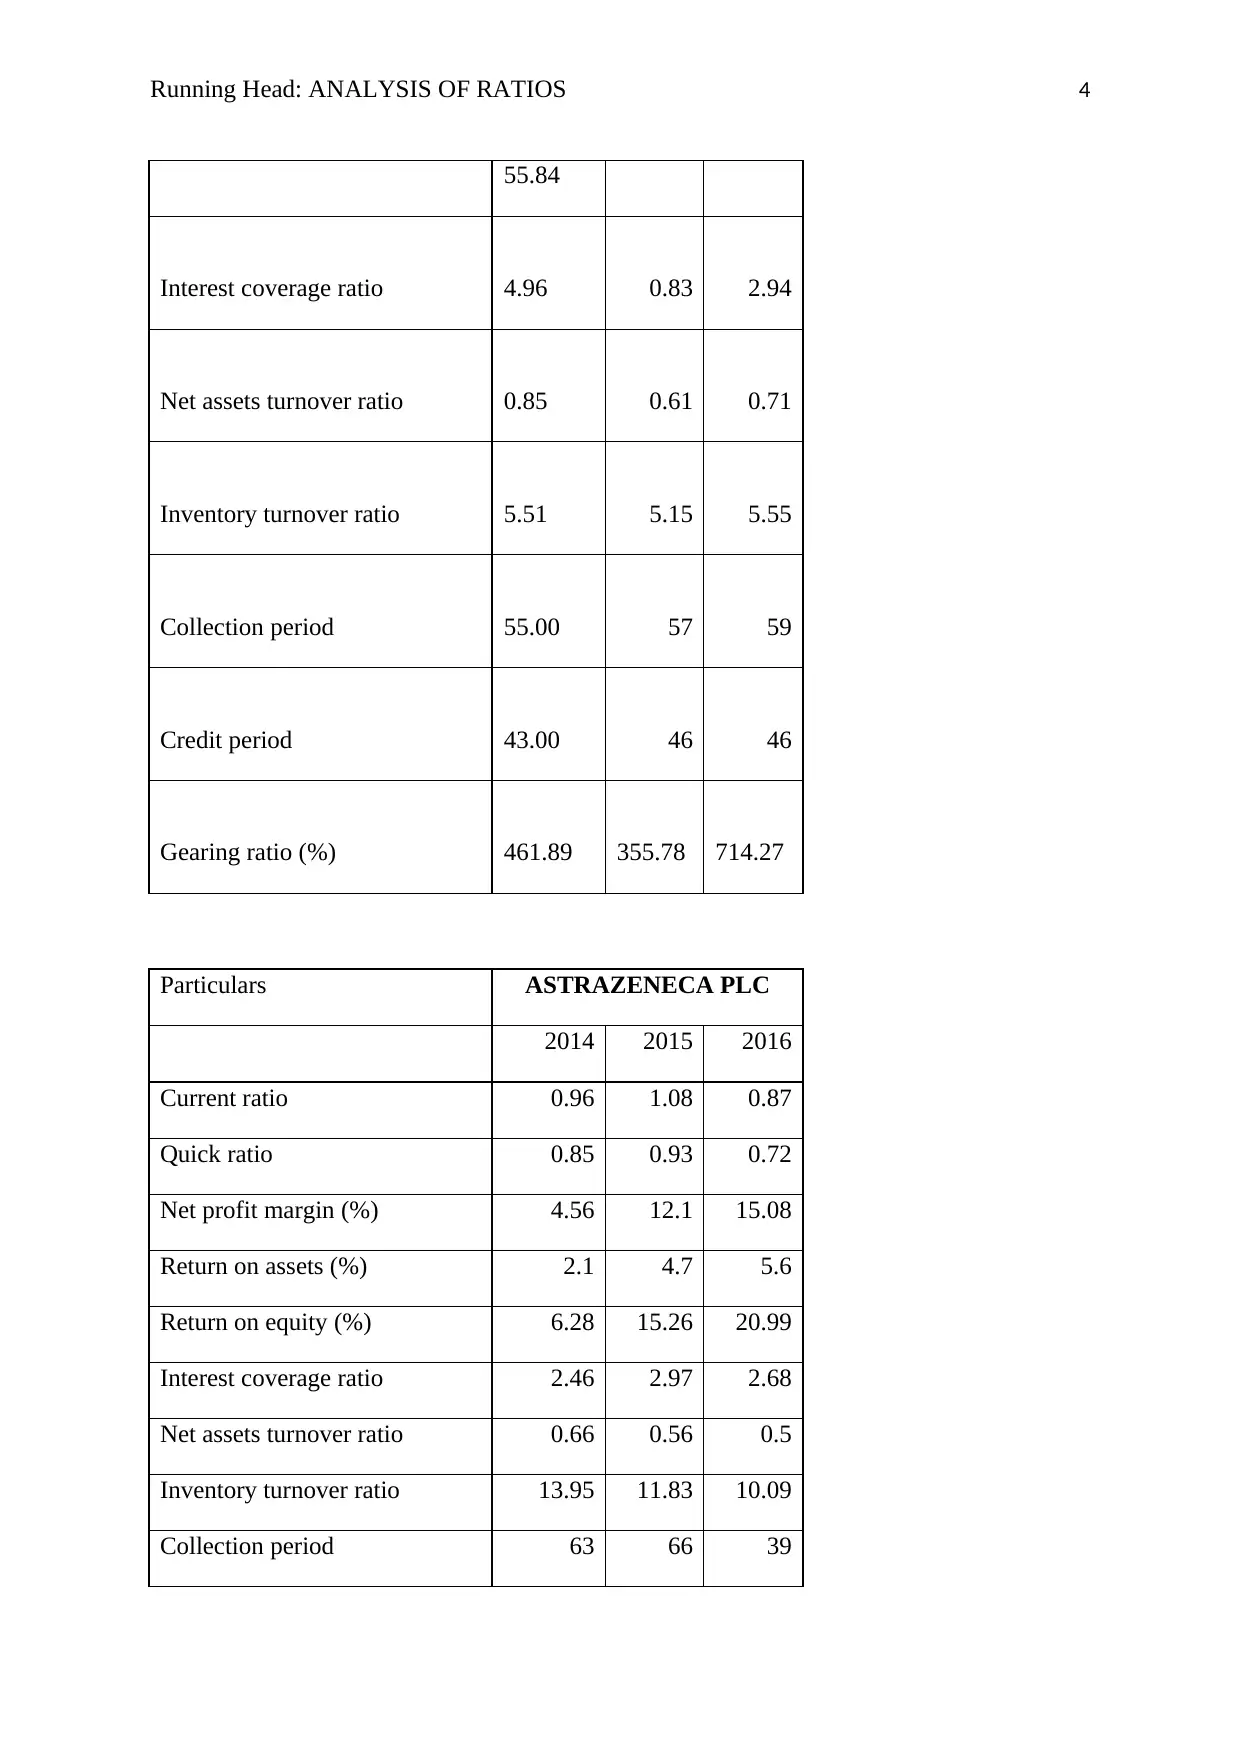
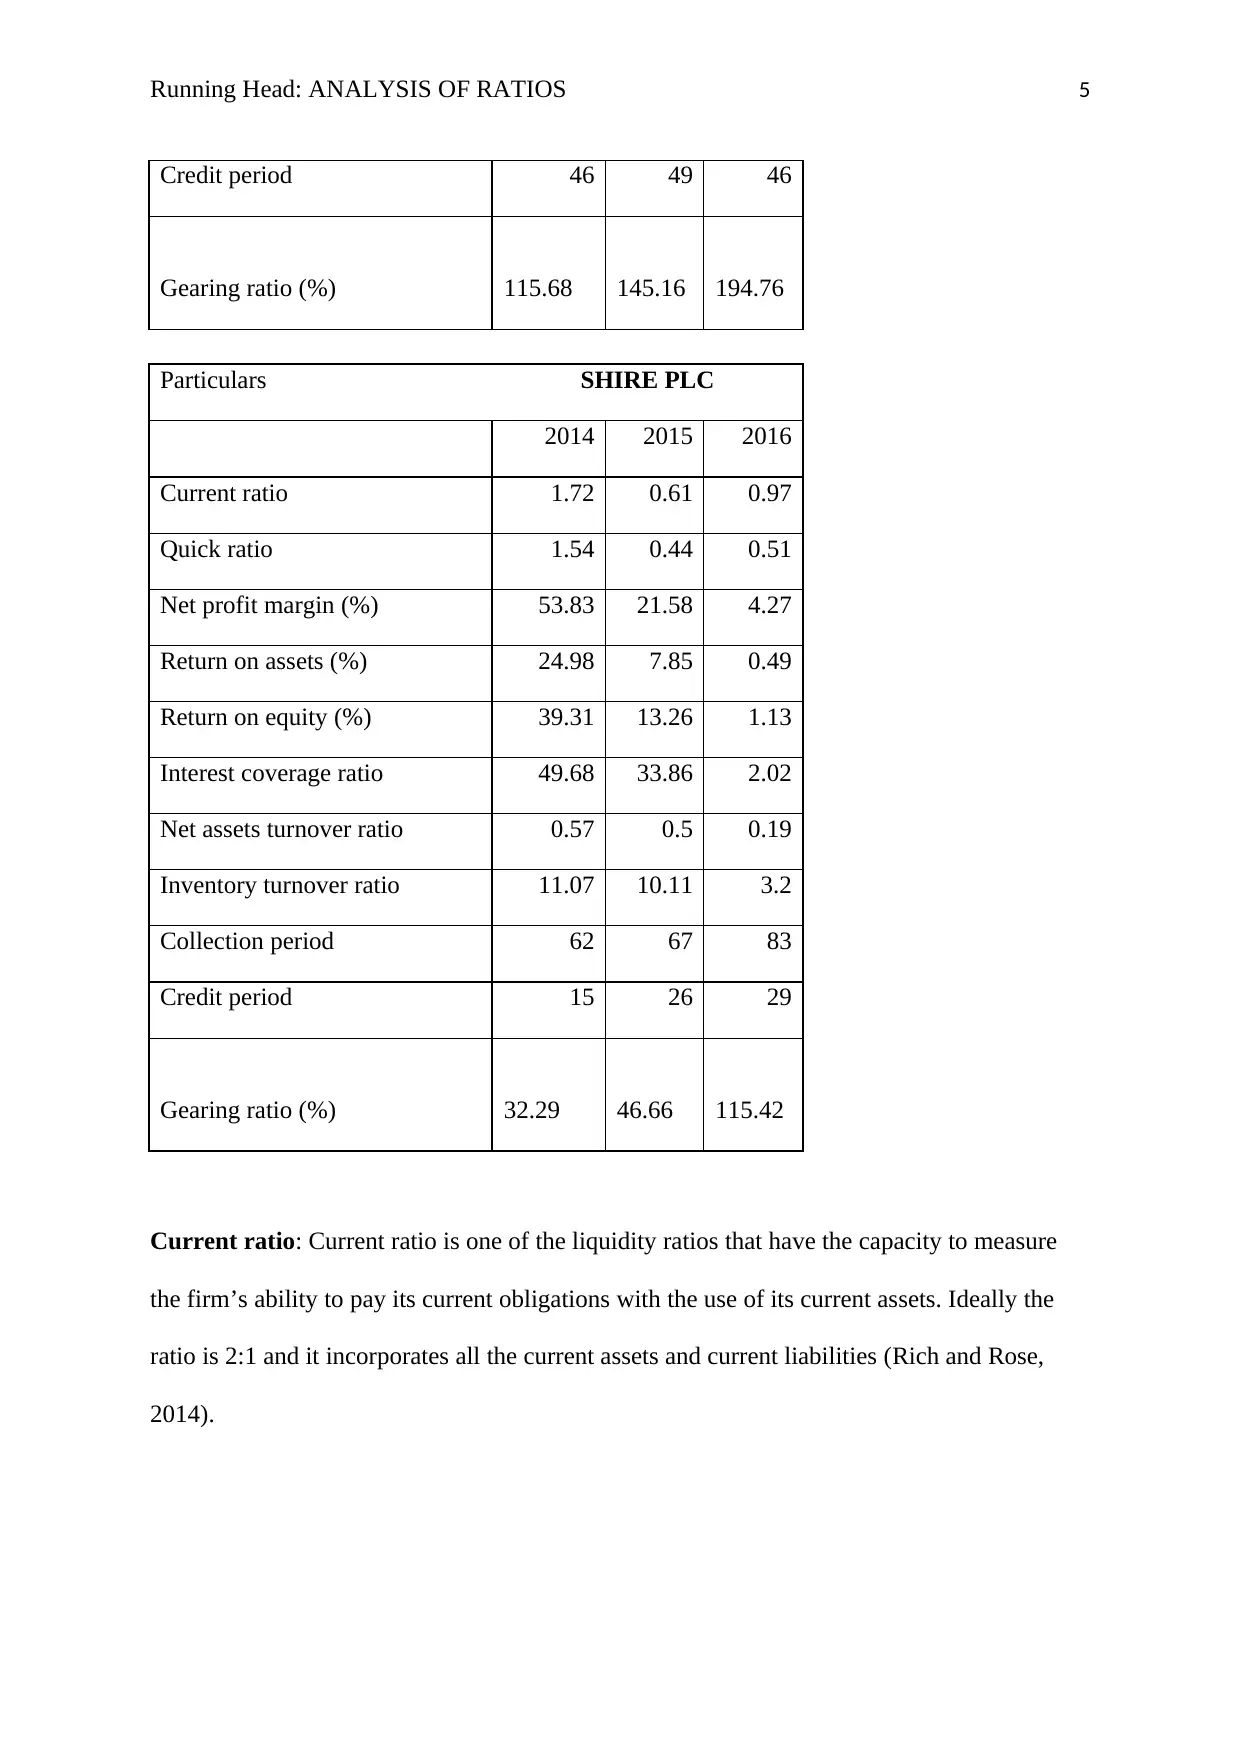
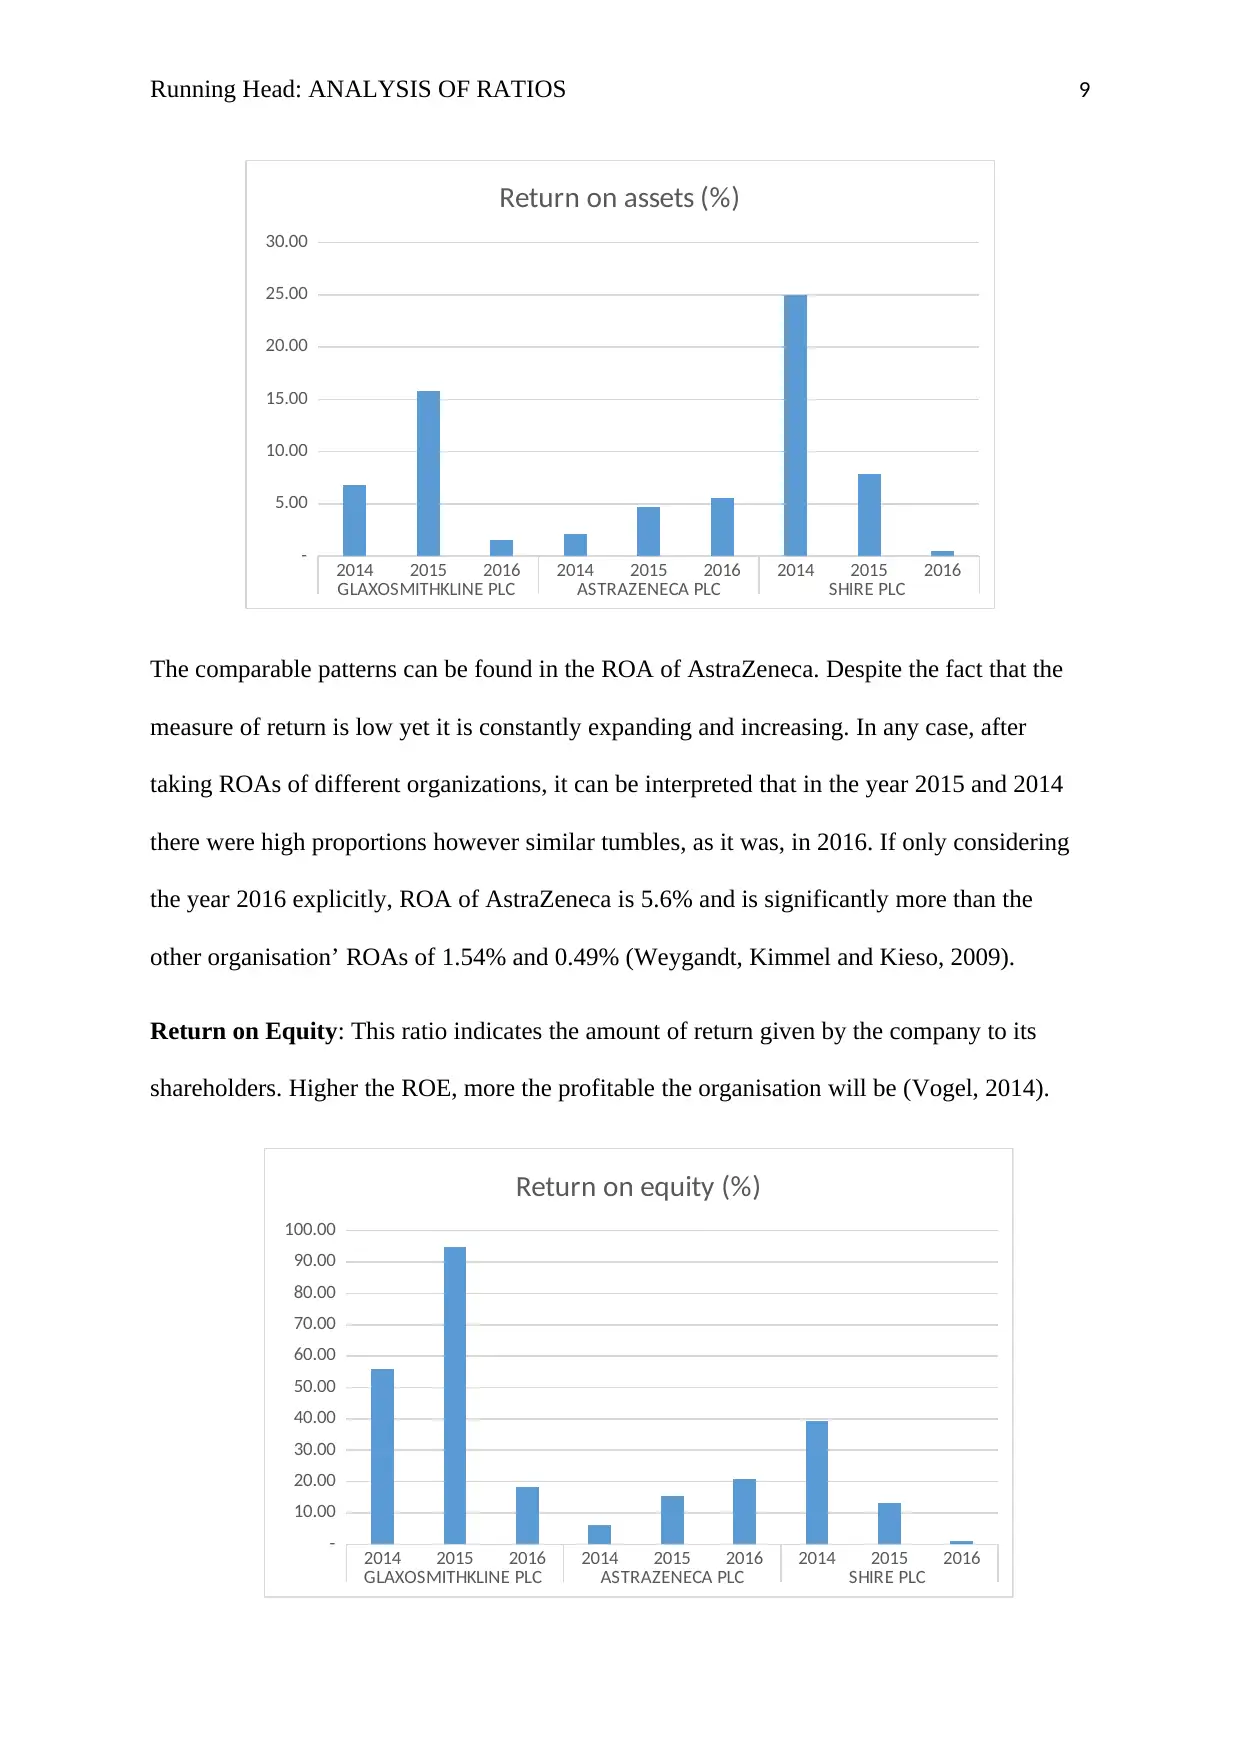
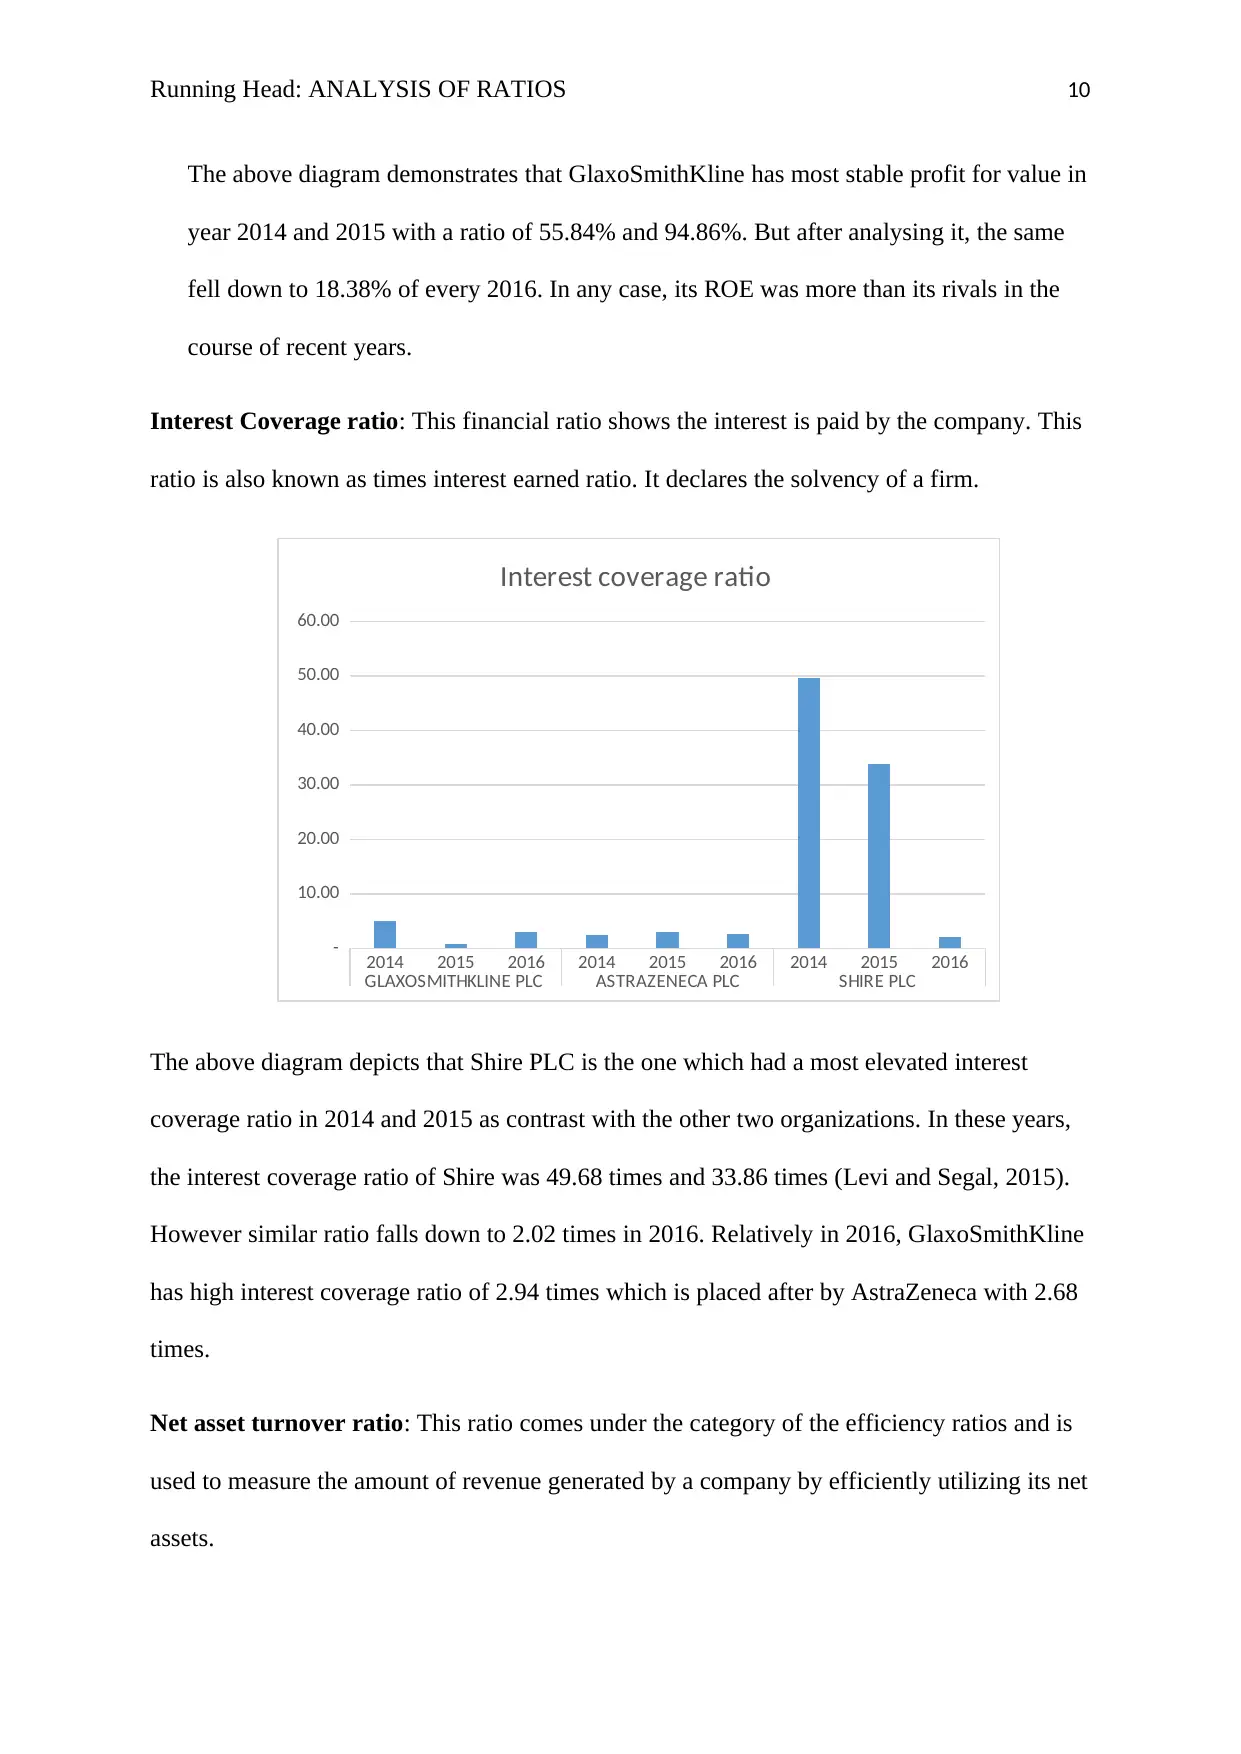
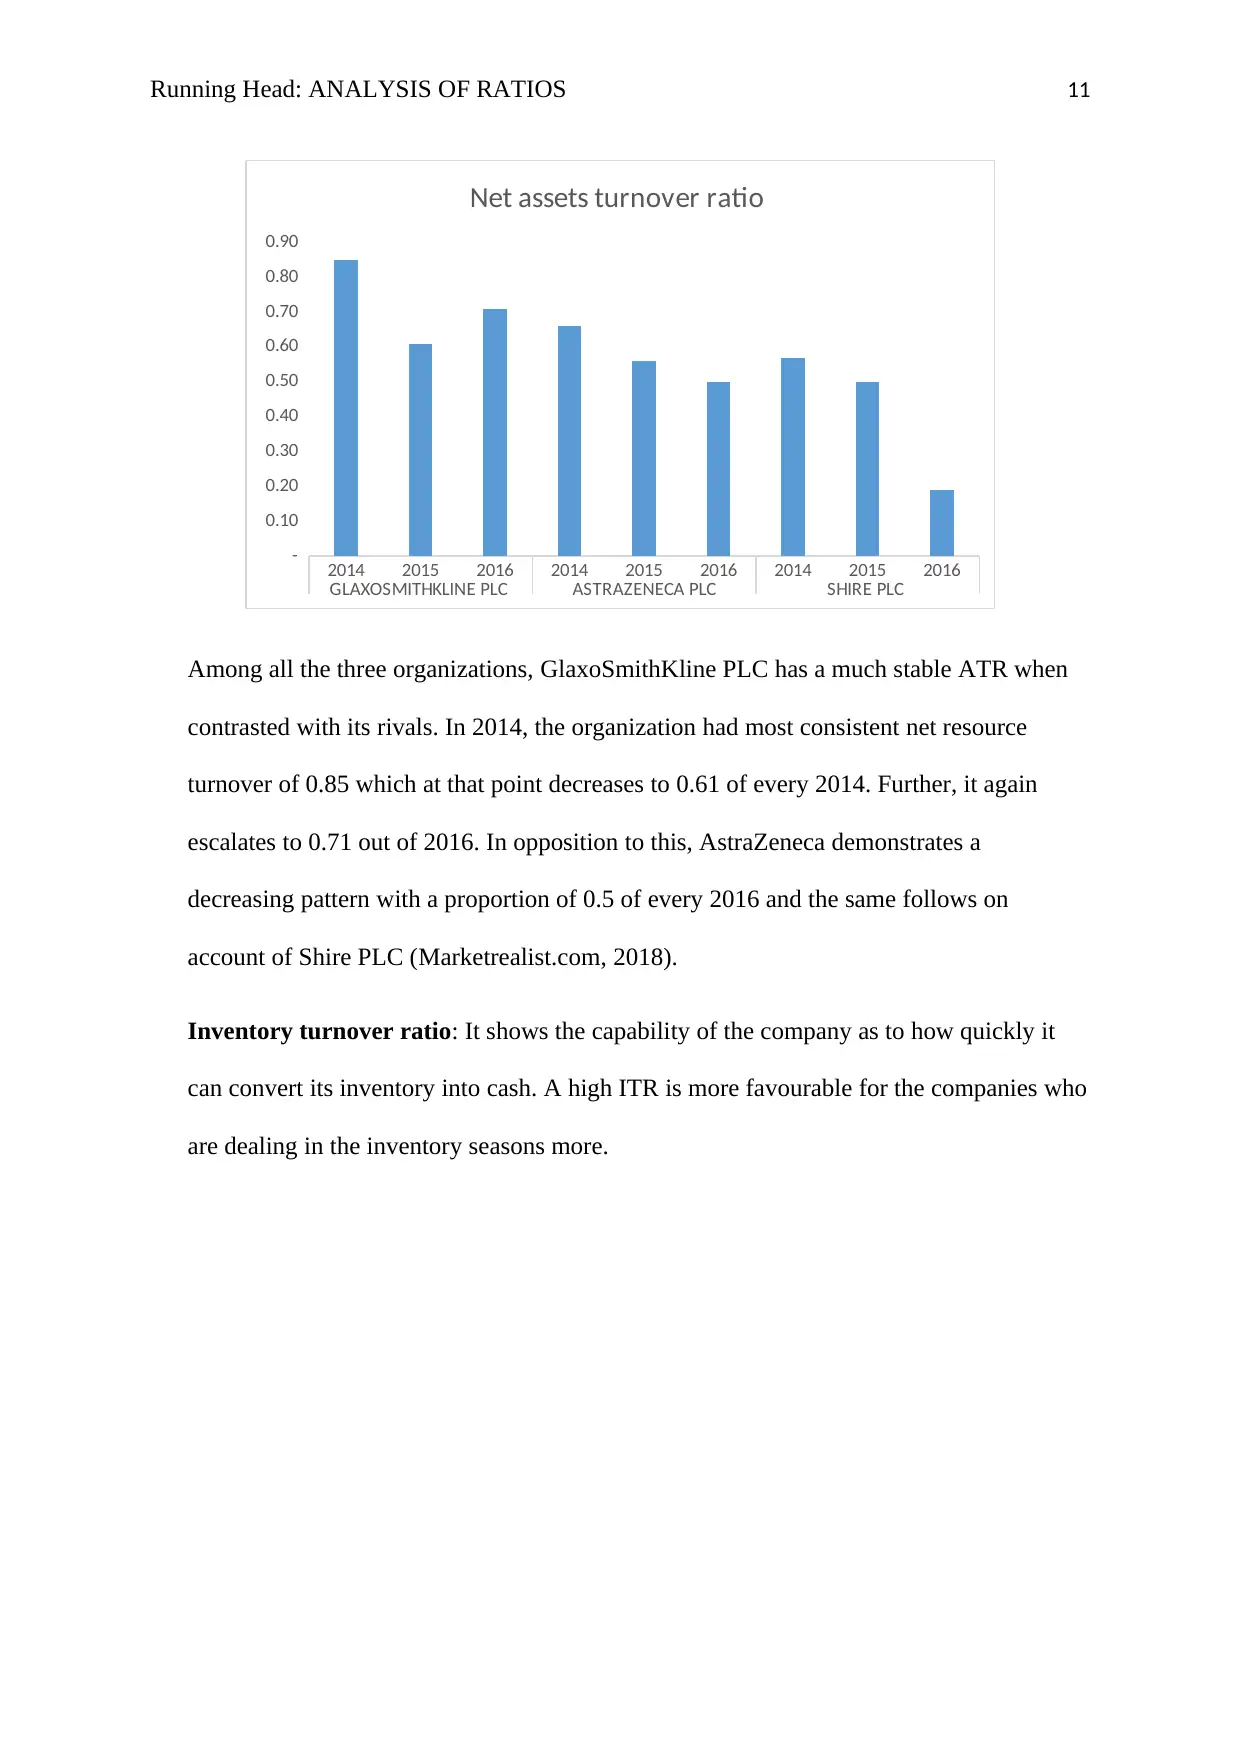
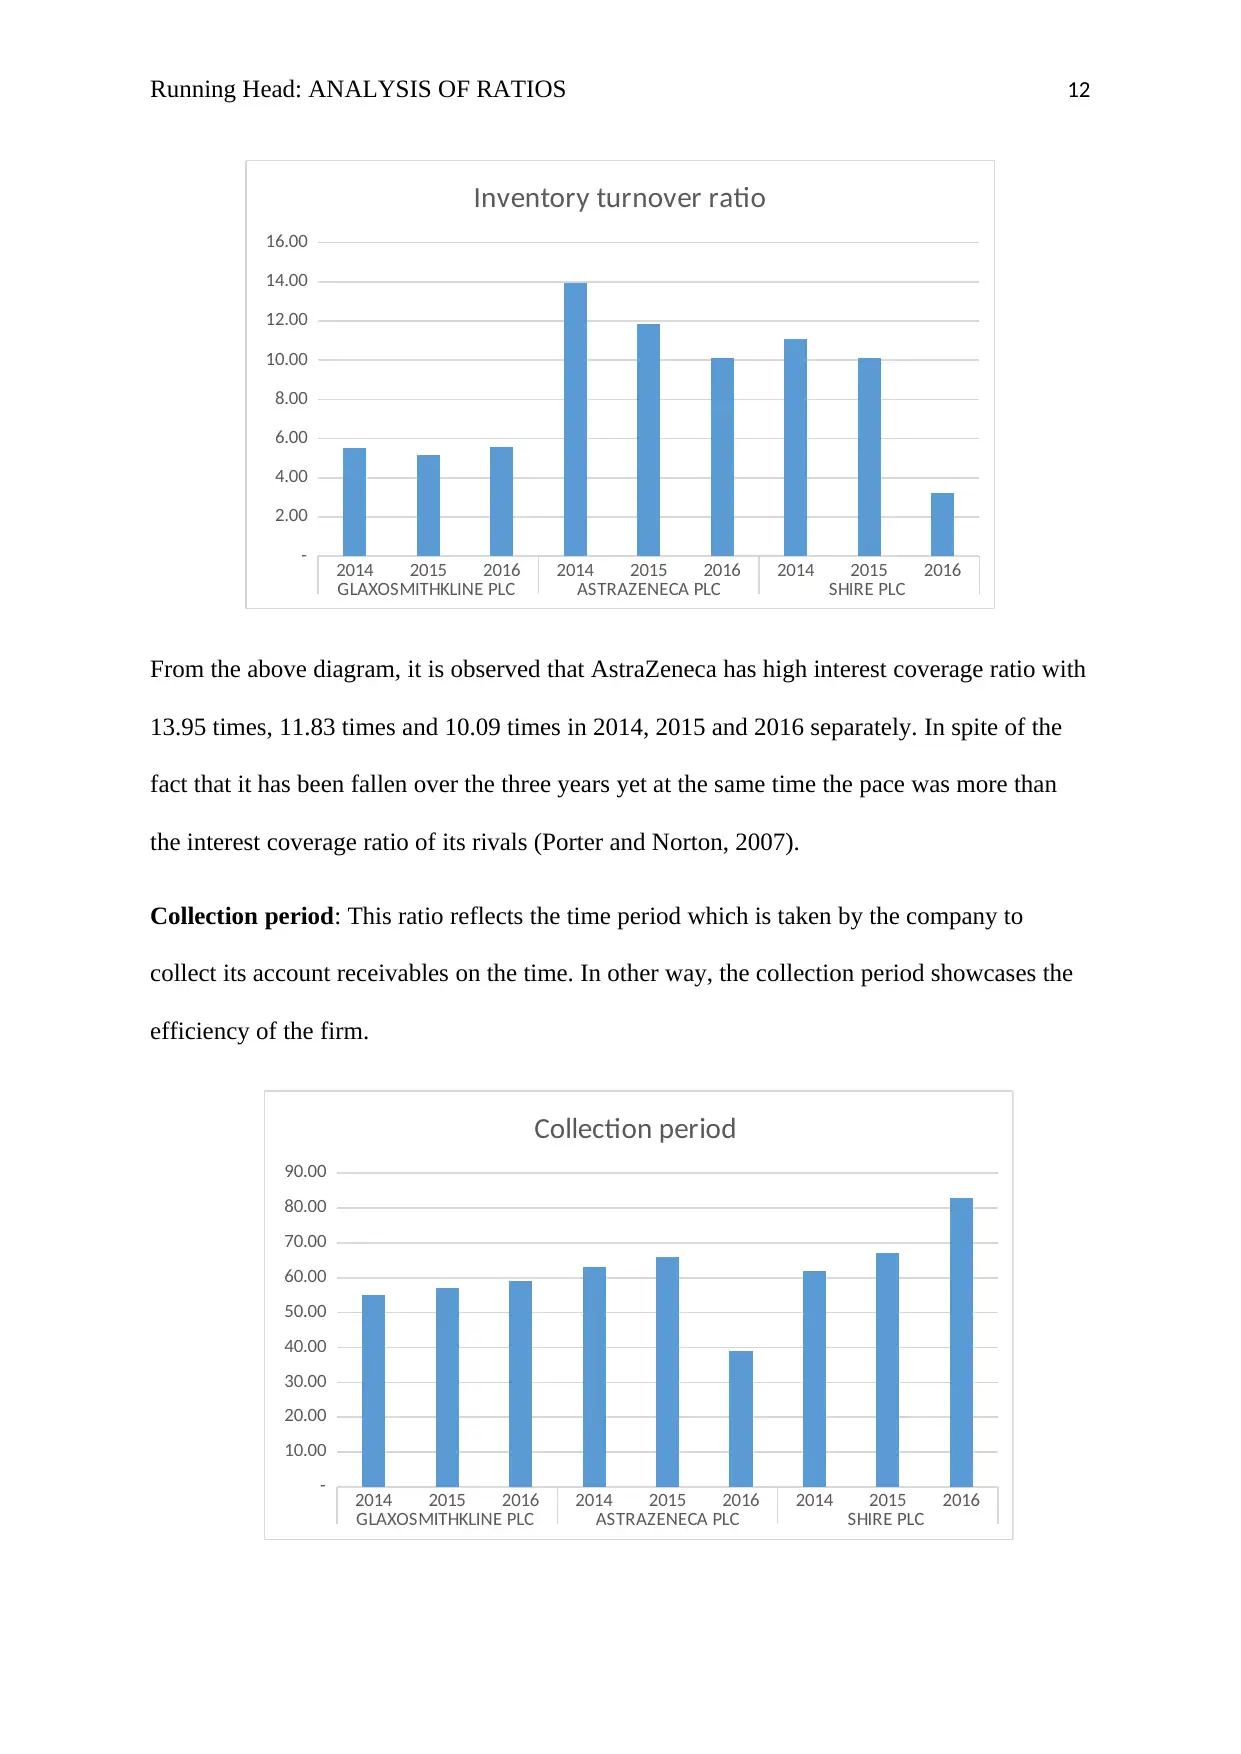
This report provides a detailed ratio analysis of three pharmaceutical companies listed on the London Stock Exchange: GlaxoSmithKline PLC, AstraZeneca PLC, and Shire PLC, over three consecutive years (2014-2016). It assesses their financial health using various financial ratios, including current ratio, quick ratio, net profit margin, return on assets, return on equity, interest coverage ratio, net asset turnover ratio, inventory turnover ratio, collection period, credit period, and gearing ratio. The analysis compares the performance of these companies across different dimensions such as liquidity, profitability, solvency, and efficiency, using graphs and interpretations to highlight key trends and differences. The report concludes by ranking the companies based on their overall financial performance and discusses potential implications for investors and stakeholders.

Running Head: ANALYSIS OF RATIOS 1
Analysis of Ratios
Analysis of Ratios
Paraphrase This Document
Need a fresh take? Get an instant paraphrase of this document with our AI Paraphraser

Running Head: ANALYSIS OF RATIOS 2
Table of Contents
Question 1..................................................................................................................................4
Part A......................................................................................................................................4
Financial ratios....................................................................................................................4
Overall ranking.................................................................................................................16
Part B....................................................................................................................................17
Part C....................................................................................................................................17
Question 2................................................................................................................................17
MEMORANDUM................................................................................................................17
Part A................................................................................................................................18
Part B....................................................................................................................................19
References................................................................................................................................23

Running Head: ANALYSIS OF RATIOS 3
Question 1
Part A
Analysis of financial position – ratio analysis
Financial ratios
Below are the financial ratios which are used to measure the financial strength of the
company and provides an overview of the same. These ratios possess several categories and
aspects of the performance of the company (Grieser, Sunak and Madlener, 2015). These
aspects include the profitability, liquidity, solvency and efficiency of a firm. The table below
shows an in-depth analysis of the three pharmaceuticals companies for the three consecutive
years on the basis of the annual report. These companies are listed on the London Stock
Exchange.
Particulars
GLAXOSMITHKLINE
PLC
2014 2015 2016
Current ratio 1.10 1.24 0.88
Quick ratio 0.79 0.89 0.61
Net profit margin (%) 12.73 43.37 6.85
Return on assets (%) 6.78 15.76 1.54
Return on equity (%) 94.86 18.38
⊘ This is a preview!⊘
Do you want full access?
Subscribe today to unlock all pages.

Trusted by 1+ million students worldwide

Running Head: ANALYSIS OF RATIOS 4
55.84
Interest coverage ratio 4.96 0.83 2.94
Net assets turnover ratio 0.85 0.61 0.71
Inventory turnover ratio 5.51 5.15 5.55
Collection period 55.00 57 59
Credit period 43.00 46 46
Gearing ratio (%) 461.89 355.78 714.27
Particulars ASTRAZENECA PLC
2014 2015 2016
Current ratio 0.96 1.08 0.87
Quick ratio 0.85 0.93 0.72
Net profit margin (%) 4.56 12.1 15.08
Return on assets (%) 2.1 4.7 5.6
Return on equity (%) 6.28 15.26 20.99
Interest coverage ratio 2.46 2.97 2.68
Net assets turnover ratio 0.66 0.56 0.5
Inventory turnover ratio 13.95 11.83 10.09
Collection period 63 66 39
Paraphrase This Document
Need a fresh take? Get an instant paraphrase of this document with our AI Paraphraser

Running Head: ANALYSIS OF RATIOS 5
Credit period 46 49 46
Gearing ratio (%) 115.68 145.16 194.76
Particulars SHIRE PLC
2014 2015 2016
Current ratio 1.72 0.61 0.97
Quick ratio 1.54 0.44 0.51
Net profit margin (%) 53.83 21.58 4.27
Return on assets (%) 24.98 7.85 0.49
Return on equity (%) 39.31 13.26 1.13
Interest coverage ratio 49.68 33.86 2.02
Net assets turnover ratio 0.57 0.5 0.19
Inventory turnover ratio 11.07 10.11 3.2
Collection period 62 67 83
Credit period 15 26 29
Gearing ratio (%) 32.29 46.66 115.42
Current ratio: Current ratio is one of the liquidity ratios that have the capacity to measure
the firm’s ability to pay its current obligations with the use of its current assets. Ideally the
ratio is 2:1 and it incorporates all the current assets and current liabilities (Rich and Rose,
2014).

Running Head: ANALYSIS OF RATIOS 6
2014 2015 2016 2014 2015 2016 2014 2015 2016
GLAXOSMITHKLINE PLC ASTRAZENECA PLC SHIRE PLC
-
0.20
0.40
0.60
0.80
1.00
1.20
1.40
1.60
1.80
2.00
Current ratio
From the above graph it can be concluded that, GlaxoSmithKline PLC is having a sound
current ratio as compared to the other companies in overall terms. In the year 2014 and 2015
the company performed better and is in association with the ideal ratio. On the contrary the
Astrazeneca PLC is having a current ratio less than 1 in the year 2016. In 2014 and 2015,
current ratio of Astrazeneca PLC was 0.96 and 1.08 respectively. The shire company could
not perform satisfactory as can be seen by the ratios of the year 2014 and 2016 (Hermann, et
al 2016).
Quick ratio: This ratio measure the firm’s liquidity where the most liquid assets of the
company are taken into consideration. The Ideal ratio is considered as 1:1. It is also known as
the acid test ratio. The quick ratio is considered as the conservative ratio in terms of other
known liquidity metric ratios (Wang and Du, 2016).
⊘ This is a preview!⊘
Do you want full access?
Subscribe today to unlock all pages.

Trusted by 1+ million students worldwide

Running Head: ANALYSIS OF RATIOS 7
2014 2015 2016 2014 2015 2016 2014 2015 2016
GLAXOSMITHKLINE PLC ASTRAZENECA PLC SHIRE PLC
-
0.20
0.40
0.60
0.80
1.00
1.20
1.40
1.60
1.80
Qucik ratio
From the above graph it can be depicted that the quick ratio of AstraZeneca PLC is up to the
mark in contrast to the other two companies which are compared. It has maintained its quick
ratio throughout the past three years. In the year 2014 and 2015, company possess a quick
RATIO of 0.85 and 0.93 which was greater than the GlaxoSmithKline’s quick ratio.
However, Shire PLC reported a quite high current ratio and quick ratio as well in the year
2014. After that a huge diminishing figure are seen in the ratios (Vogel, 2014).
Net profit margin: This ratio determines the profitability of the organisation by expressing
the net profits of the company in terms of the percentage form. A low net profit margin
generally does not mean that the company is having the low profits.
Paraphrase This Document
Need a fresh take? Get an instant paraphrase of this document with our AI Paraphraser

Running Head: ANALYSIS OF RATIOS 8
2014 2015 2016 2014 2015 2016 2014 2015 2016
GLAXOSMITHKLINE PLC ASTRAZENECA PLC SHIRE PLC
-
10.00
20.00
30.00
40.00
50.00
60.00
Net profit margin (%)
The diagram plotted above features that the AstraZeneca has demonstrated a consistent
increment in the trends of its net benefit which accelerated its net overall revenue
appropriately by 11.08% in from 2015 to 2016. In this way, it can be inferred that in terms of
productivity the AstraZeneca's organization has performed much better as its overall revenue
has been nearly at the equal level. GlaxoSmithKline company is having highest net profit
margin in 2015 which is equivalent to the Shire company but in the year 2014.
Return on asset: This ratio is an indicator of how a company’s profits are relatable to the
assets which are in a company’s pool. The ratio determines the amount generated in terms of
the revenue by utilizing the assets of the company. Basically, it is a measure of the efficiency
factor (Warren and Jones, 2018).

Running Head: ANALYSIS OF RATIOS 9
2014 2015 2016 2014 2015 2016 2014 2015 2016
GLAXOSMITHKLINE PLC ASTRAZENECA PLC SHIRE PLC
-
5.00
10.00
15.00
20.00
25.00
30.00
Return on assets (%)
The comparable patterns can be found in the ROA of AstraZeneca. Despite the fact that the
measure of return is low yet it is constantly expanding and increasing. In any case, after
taking ROAs of different organizations, it can be interpreted that in the year 2015 and 2014
there were high proportions however similar tumbles, as it was, in 2016. If only considering
the year 2016 explicitly, ROA of AstraZeneca is 5.6% and is significantly more than the
other organisation’ ROAs of 1.54% and 0.49% (Weygandt, Kimmel and Kieso, 2009).
Return on Equity: This ratio indicates the amount of return given by the company to its
shareholders. Higher the ROE, more the profitable the organisation will be (Vogel, 2014).
2014 2015 2016 2014 2015 2016 2014 2015 2016
GLAXOSMITHKLINE PLC ASTRAZENECA PLC SHIRE PLC
-
10.00
20.00
30.00
40.00
50.00
60.00
70.00
80.00
90.00
100.00
Return on equity (%)
2014 2015 2016 2014 2015 2016 2014 2015 2016
GLAXOSMITHKLINE PLC ASTRAZENECA PLC SHIRE PLC
-
5.00
10.00
15.00
20.00
25.00
30.00
Return on assets (%)
The comparable patterns can be found in the ROA of AstraZeneca. Despite the fact that the
measure of return is low yet it is constantly expanding and increasing. In any case, after
taking ROAs of different organizations, it can be interpreted that in the year 2015 and 2014
there were high proportions however similar tumbles, as it was, in 2016. If only considering
the year 2016 explicitly, ROA of AstraZeneca is 5.6% and is significantly more than the
other organisation’ ROAs of 1.54% and 0.49% (Weygandt, Kimmel and Kieso, 2009).
Return on Equity: This ratio indicates the amount of return given by the company to its
shareholders. Higher the ROE, more the profitable the organisation will be (Vogel, 2014).
2014 2015 2016 2014 2015 2016 2014 2015 2016
GLAXOSMITHKLINE PLC ASTRAZENECA PLC SHIRE PLC
-
10.00
20.00
30.00
40.00
50.00
60.00
70.00
80.00
90.00
100.00
Return on equity (%)
⊘ This is a preview!⊘
Do you want full access?
Subscribe today to unlock all pages.

Trusted by 1+ million students worldwide

Running Head: ANALYSIS OF RATIOS 10
The above diagram demonstrates that GlaxoSmithKline has most stable profit for value in
year 2014 and 2015 with a ratio of 55.84% and 94.86%. But after analysing it, the same
fell down to 18.38% of every 2016. In any case, its ROE was more than its rivals in the
course of recent years.
Interest Coverage ratio: This financial ratio shows the interest is paid by the company. This
ratio is also known as times interest earned ratio. It declares the solvency of a firm.
2014 2015 2016 2014 2015 2016 2014 2015 2016
GLAXOSMITHKLINE PLC ASTRAZENECA PLC SHIRE PLC
-
10.00
20.00
30.00
40.00
50.00
60.00
Interest coverage ratio
The above diagram depicts that Shire PLC is the one which had a most elevated interest
coverage ratio in 2014 and 2015 as contrast with the other two organizations. In these years,
the interest coverage ratio of Shire was 49.68 times and 33.86 times (Levi and Segal, 2015).
However similar ratio falls down to 2.02 times in 2016. Relatively in 2016, GlaxoSmithKline
has high interest coverage ratio of 2.94 times which is placed after by AstraZeneca with 2.68
times.
Net asset turnover ratio: This ratio comes under the category of the efficiency ratios and is
used to measure the amount of revenue generated by a company by efficiently utilizing its net
assets.
Paraphrase This Document
Need a fresh take? Get an instant paraphrase of this document with our AI Paraphraser

Running Head: ANALYSIS OF RATIOS 11
2014 2015 2016 2014 2015 2016 2014 2015 2016
GLAXOSMITHKLINE PLC ASTRAZENECA PLC SHIRE PLC
-
0.10
0.20
0.30
0.40
0.50
0.60
0.70
0.80
0.90
Net assets turnover ratio
Among all the three organizations, GlaxoSmithKline PLC has a much stable ATR when
contrasted with its rivals. In 2014, the organization had most consistent net resource
turnover of 0.85 which at that point decreases to 0.61 of every 2014. Further, it again
escalates to 0.71 out of 2016. In opposition to this, AstraZeneca demonstrates a
decreasing pattern with a proportion of 0.5 of every 2016 and the same follows on
account of Shire PLC (Marketrealist.com, 2018).
Inventory turnover ratio: It shows the capability of the company as to how quickly it
can convert its inventory into cash. A high ITR is more favourable for the companies who
are dealing in the inventory seasons more.

Running Head: ANALYSIS OF RATIOS 12
2014 2015 2016 2014 2015 2016 2014 2015 2016
GLAXOSMITHKLINE PLC ASTRAZENECA PLC SHIRE PLC
-
2.00
4.00
6.00
8.00
10.00
12.00
14.00
16.00
Inventory turnover ratio
From the above diagram, it is observed that AstraZeneca has high interest coverage ratio with
13.95 times, 11.83 times and 10.09 times in 2014, 2015 and 2016 separately. In spite of the
fact that it has been fallen over the three years yet at the same time the pace was more than
the interest coverage ratio of its rivals (Porter and Norton, 2007).
Collection period: This ratio reflects the time period which is taken by the company to
collect its account receivables on the time. In other way, the collection period showcases the
efficiency of the firm.
2014 2015 2016 2014 2015 2016 2014 2015 2016
GLAXOSMITHKLINE PLC ASTRAZENECA PLC SHIRE PLC
-
10.00
20.00
30.00
40.00
50.00
60.00
70.00
80.00
90.00
Collection period
2014 2015 2016 2014 2015 2016 2014 2015 2016
GLAXOSMITHKLINE PLC ASTRAZENECA PLC SHIRE PLC
-
2.00
4.00
6.00
8.00
10.00
12.00
14.00
16.00
Inventory turnover ratio
From the above diagram, it is observed that AstraZeneca has high interest coverage ratio with
13.95 times, 11.83 times and 10.09 times in 2014, 2015 and 2016 separately. In spite of the
fact that it has been fallen over the three years yet at the same time the pace was more than
the interest coverage ratio of its rivals (Porter and Norton, 2007).
Collection period: This ratio reflects the time period which is taken by the company to
collect its account receivables on the time. In other way, the collection period showcases the
efficiency of the firm.
2014 2015 2016 2014 2015 2016 2014 2015 2016
GLAXOSMITHKLINE PLC ASTRAZENECA PLC SHIRE PLC
-
10.00
20.00
30.00
40.00
50.00
60.00
70.00
80.00
90.00
Collection period
⊘ This is a preview!⊘
Do you want full access?
Subscribe today to unlock all pages.

Trusted by 1+ million students worldwide
1 out of 23
Related Documents

Your All-in-One AI-Powered Toolkit for Academic Success.
+13062052269
info@desklib.com
Available 24*7 on WhatsApp / Email
Unlock your academic potential
Copyright © 2020–2025 A2Z Services. All Rights Reserved. Developed and managed by ZUCOL.