Healthcare Optimization Using Pharmaceutical Production
VerifiedAdded on 2020/05/28
|9
|1334
|149
AI Summary
The assignment examines optimization strategies for a healthcare context by analyzing the production and ordering processes within a pharmaceutical company. The first part deals with determining optimal production levels for different drug quantities using Excel Solver, targeting cost minimization while satisfying demand constraints. In the second part, it addresses the procurement of pig valves from various suppliers to meet specified demands at minimal costs. Sensitivity analysis is utilized to assess how changes in demand affect total costs, providing insights into operational adjustments and strategic planning.
Running head: OPTIMIZATION USING HEALTHCARE
OPTIMIZATION USING HEALTHCARE
[Author Name(s), First M. Last, Omit Titles and Degrees]
[Institutional Affiliation(s)]
OPTIMIZATION USING HEALTHCARE
[Author Name(s), First M. Last, Omit Titles and Degrees]
[Institutional Affiliation(s)]
Paraphrase This Document
Need a fresh take? Get an instant paraphrase of this document with our AI Paraphraser
2
OPTIMIZATION USING HEALTHCARE
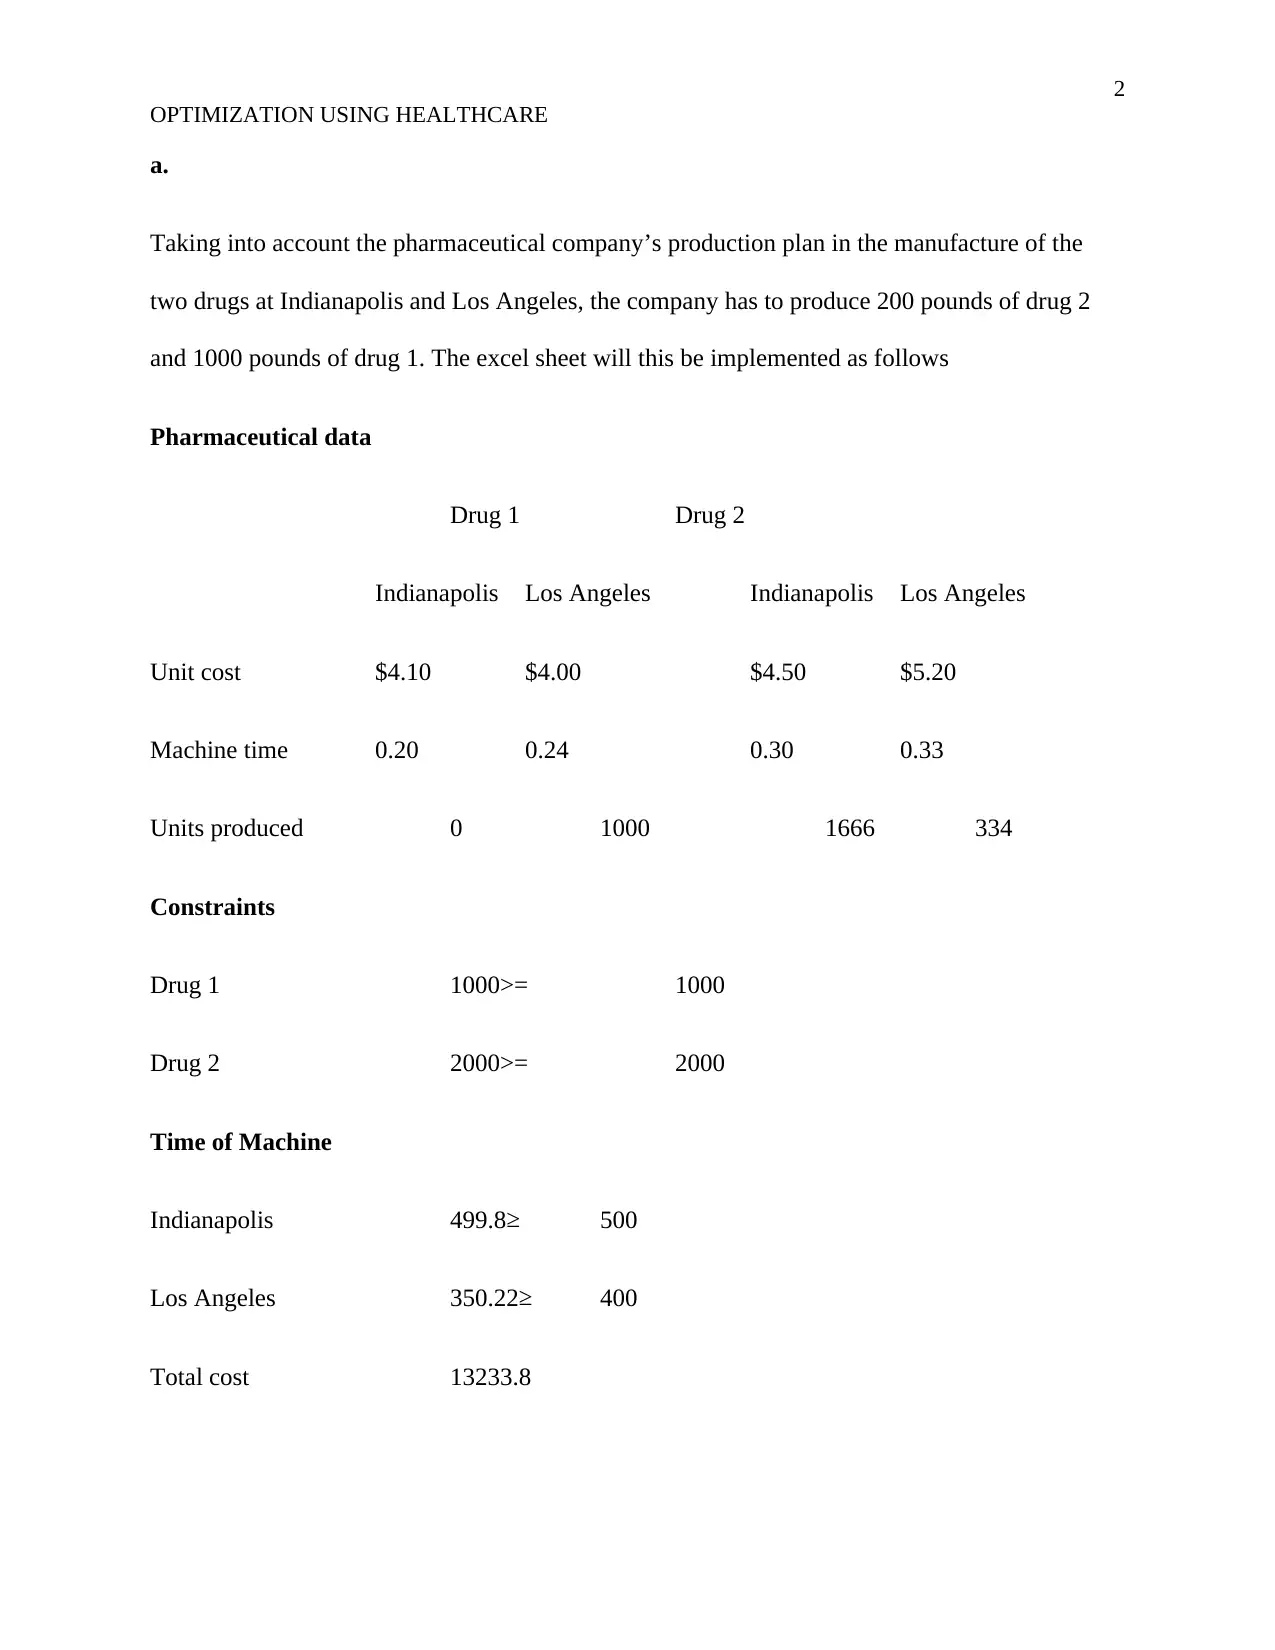
a.
Taking into account the pharmaceutical company’s production plan in the manufacture of the
two drugs at Indianapolis and Los Angeles, the company has to produce 200 pounds of drug 2
and 1000 pounds of drug 1. The excel sheet will this be implemented as follows
Pharmaceutical data
Drug 1 Drug 2
Indianapolis Los Angeles Indianapolis Los Angeles
Unit cost $4.10 $4.00 $4.50 $5.20
Machine time 0.20 0.24 0.30 0.33
Units produced 0 1000 1666 334
Constraints
Drug 1 1000>= 1000
Drug 2 2000>= 2000
Time of Machine
Indianapolis 499.8≥ 500
Los Angeles 350.22≥ 400
Total cost 13233.8
OPTIMIZATION USING HEALTHCARE
a.
Taking into account the pharmaceutical company’s production plan in the manufacture of the
two drugs at Indianapolis and Los Angeles, the company has to produce 200 pounds of drug 2
and 1000 pounds of drug 1. The excel sheet will this be implemented as follows
Pharmaceutical data
Drug 1 Drug 2
Indianapolis Los Angeles Indianapolis Los Angeles
Unit cost $4.10 $4.00 $4.50 $5.20
Machine time 0.20 0.24 0.30 0.33
Units produced 0 1000 1666 334
Constraints
Drug 1 1000>= 1000
Drug 2 2000>= 2000
Time of Machine
Indianapolis 499.8≥ 500
Los Angeles 350.22≥ 400
Total cost 13233.8
3
OPTIMIZATION USING HEALTHCARE
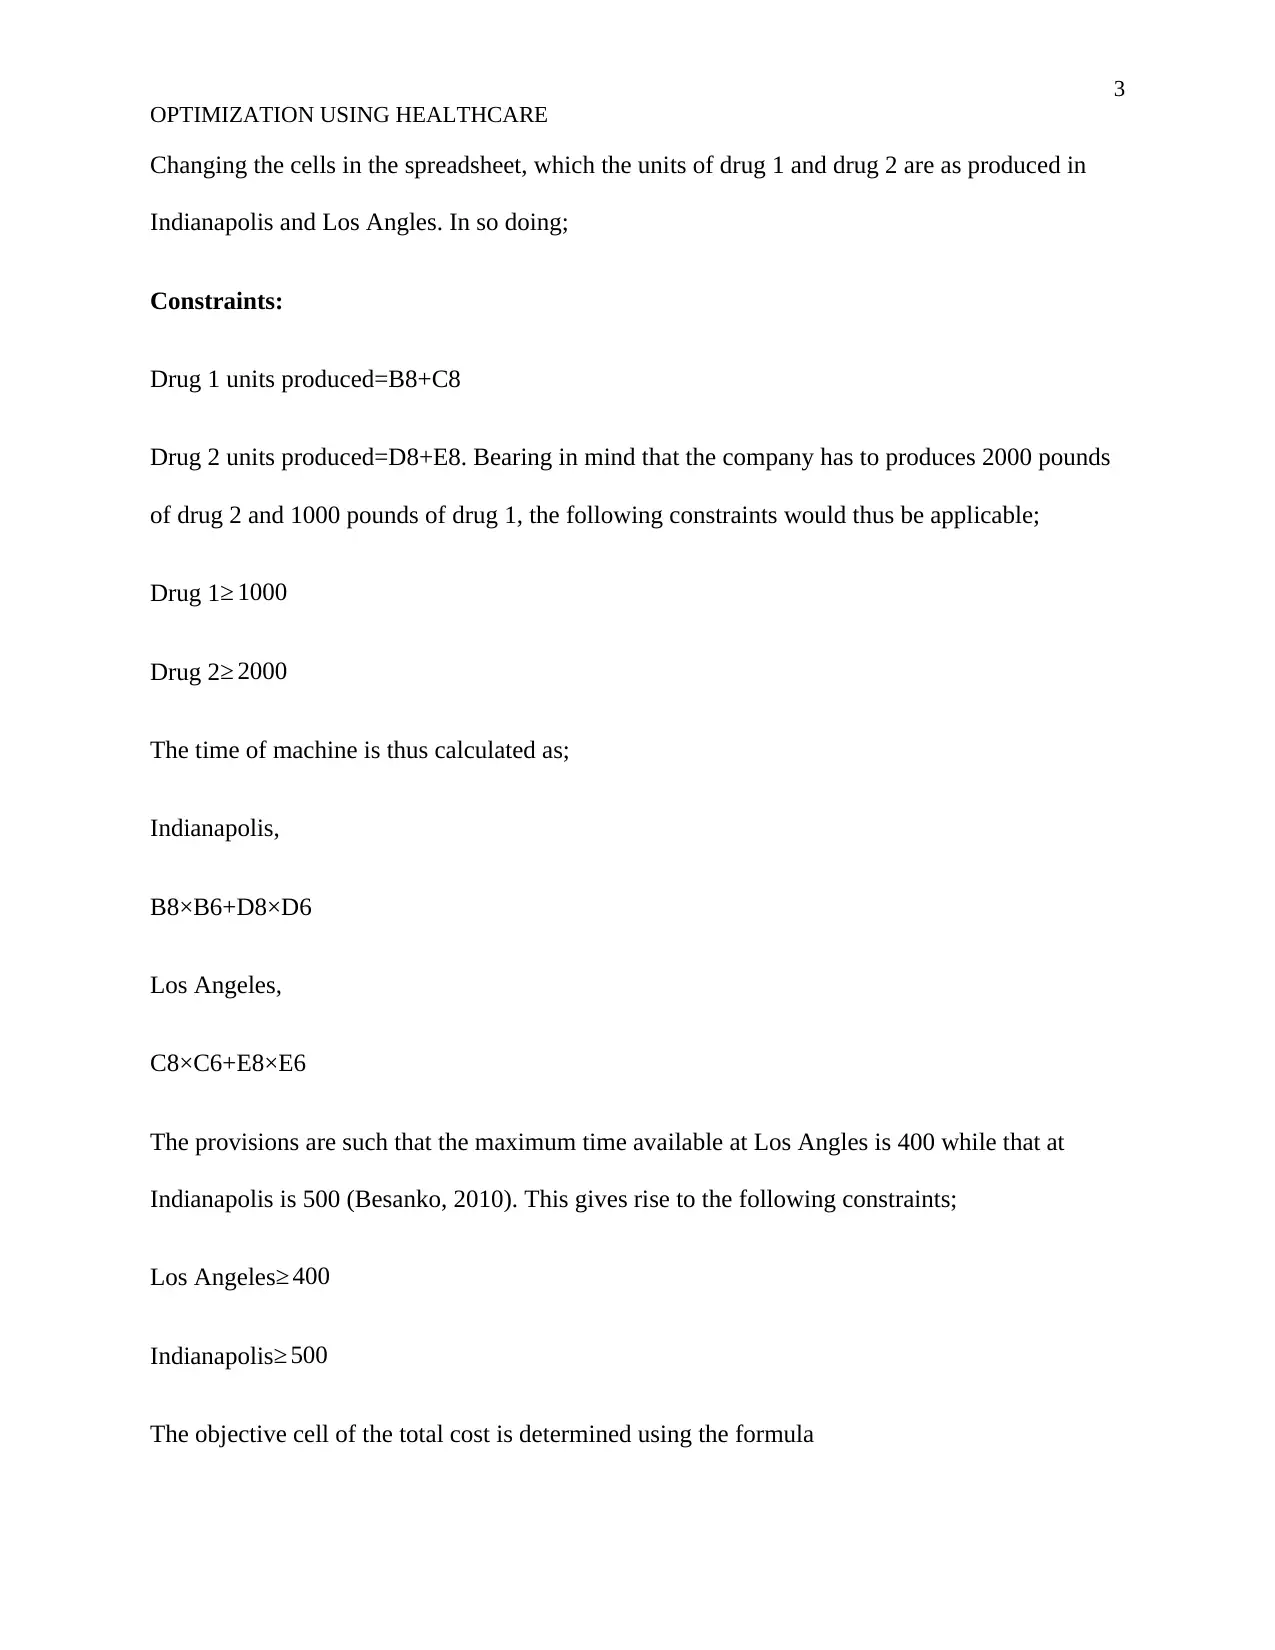
Changing the cells in the spreadsheet, which the units of drug 1 and drug 2 are as produced in
Indianapolis and Los Angles. In so doing;
Constraints:
Drug 1 units produced=B8+C8
Drug 2 units produced=D8+E8. Bearing in mind that the company has to produces 2000 pounds
of drug 2 and 1000 pounds of drug 1, the following constraints would thus be applicable;
Drug 1≥ 1000
Drug 2≥ 2000
The time of machine is thus calculated as;
Indianapolis,
B8×B6+D8×D6
Los Angeles,
C8×C6+E8×E6
The provisions are such that the maximum time available at Los Angles is 400 while that at
Indianapolis is 500 (Besanko, 2010). This gives rise to the following constraints;
Los Angeles≥ 400
Indianapolis≥ 500
The objective cell of the total cost is determined using the formula
OPTIMIZATION USING HEALTHCARE
Changing the cells in the spreadsheet, which the units of drug 1 and drug 2 are as produced in
Indianapolis and Los Angles. In so doing;
Constraints:
Drug 1 units produced=B8+C8
Drug 2 units produced=D8+E8. Bearing in mind that the company has to produces 2000 pounds
of drug 2 and 1000 pounds of drug 1, the following constraints would thus be applicable;
Drug 1≥ 1000
Drug 2≥ 2000
The time of machine is thus calculated as;
Indianapolis,
B8×B6+D8×D6
Los Angeles,
C8×C6+E8×E6
The provisions are such that the maximum time available at Los Angles is 400 while that at
Indianapolis is 500 (Besanko, 2010). This gives rise to the following constraints;
Los Angeles≥ 400
Indianapolis≥ 500
The objective cell of the total cost is determined using the formula
⊘ This is a preview!⊘
Do you want full access?
Subscribe today to unlock all pages.
Trusted by 1+ million students worldwide
4
OPTIMIZATION USING HEALTHCARE
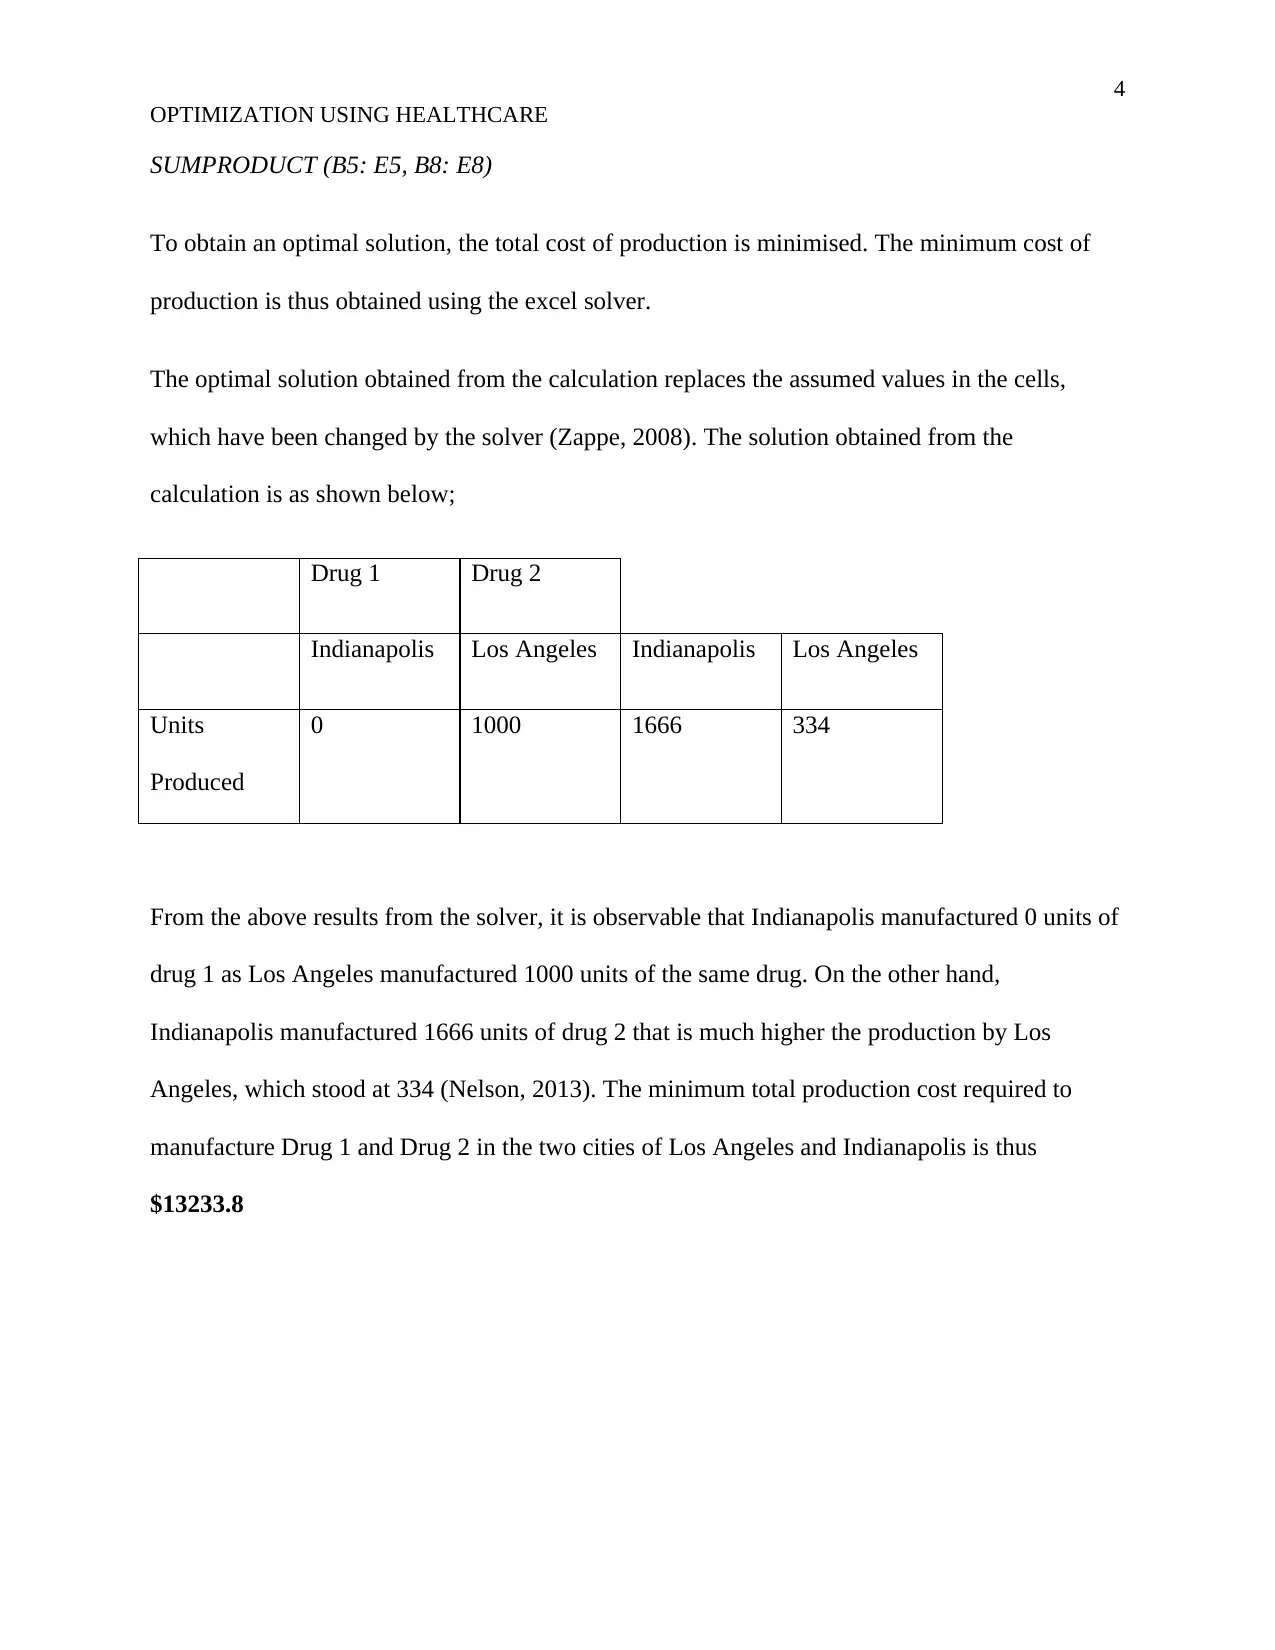
SUMPRODUCT (B5: E5, B8: E8)
To obtain an optimal solution, the total cost of production is minimised. The minimum cost of
production is thus obtained using the excel solver.
The optimal solution obtained from the calculation replaces the assumed values in the cells,
which have been changed by the solver (Zappe, 2008). The solution obtained from the
calculation is as shown below;
Drug 1 Drug 2
Indianapolis Los Angeles Indianapolis Los Angeles
Units
Produced
0 1000 1666 334
From the above results from the solver, it is observable that Indianapolis manufactured 0 units of
drug 1 as Los Angeles manufactured 1000 units of the same drug. On the other hand,
Indianapolis manufactured 1666 units of drug 2 that is much higher the production by Los
Angeles, which stood at 334 (Nelson, 2013). The minimum total production cost required to
manufacture Drug 1 and Drug 2 in the two cities of Los Angeles and Indianapolis is thus
$13233.8
OPTIMIZATION USING HEALTHCARE
SUMPRODUCT (B5: E5, B8: E8)
To obtain an optimal solution, the total cost of production is minimised. The minimum cost of
production is thus obtained using the excel solver.
The optimal solution obtained from the calculation replaces the assumed values in the cells,
which have been changed by the solver (Zappe, 2008). The solution obtained from the
calculation is as shown below;
Drug 1 Drug 2
Indianapolis Los Angeles Indianapolis Los Angeles
Units
Produced
0 1000 1666 334
From the above results from the solver, it is observable that Indianapolis manufactured 0 units of
drug 1 as Los Angeles manufactured 1000 units of the same drug. On the other hand,
Indianapolis manufactured 1666 units of drug 2 that is much higher the production by Los
Angeles, which stood at 334 (Nelson, 2013). The minimum total production cost required to
manufacture Drug 1 and Drug 2 in the two cities of Los Angeles and Indianapolis is thus
$13233.8
Paraphrase This Document
Need a fresh take? Get an instant paraphrase of this document with our AI Paraphraser
5
OPTIMIZATION USING HEALTHCARE
b.
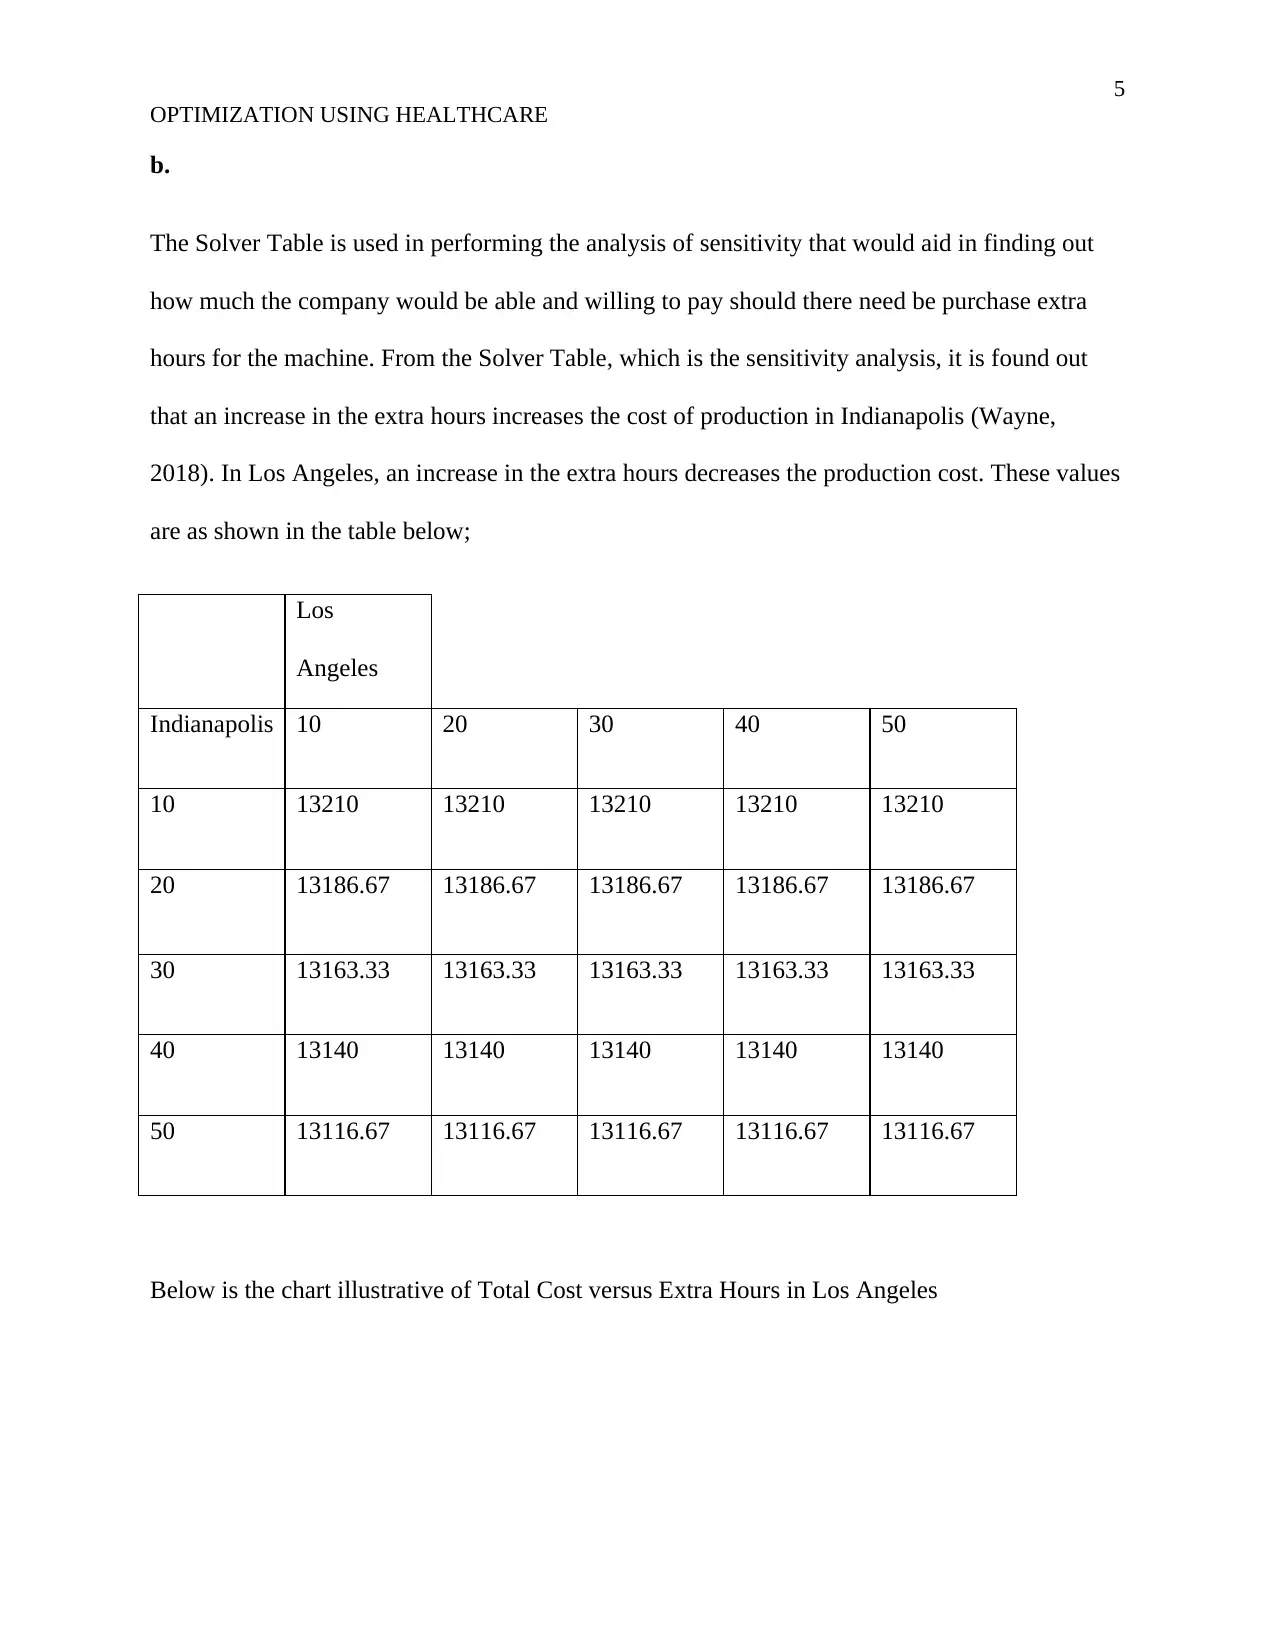
The Solver Table is used in performing the analysis of sensitivity that would aid in finding out
how much the company would be able and willing to pay should there need be purchase extra
hours for the machine. From the Solver Table, which is the sensitivity analysis, it is found out
that an increase in the extra hours increases the cost of production in Indianapolis (Wayne,
2018). In Los Angeles, an increase in the extra hours decreases the production cost. These values
are as shown in the table below;
Los
Angeles
Indianapolis 10 20 30 40 50
10 13210 13210 13210 13210 13210
20 13186.67 13186.67 13186.67 13186.67 13186.67
30 13163.33 13163.33 13163.33 13163.33 13163.33
40 13140 13140 13140 13140 13140
50 13116.67 13116.67 13116.67 13116.67 13116.67
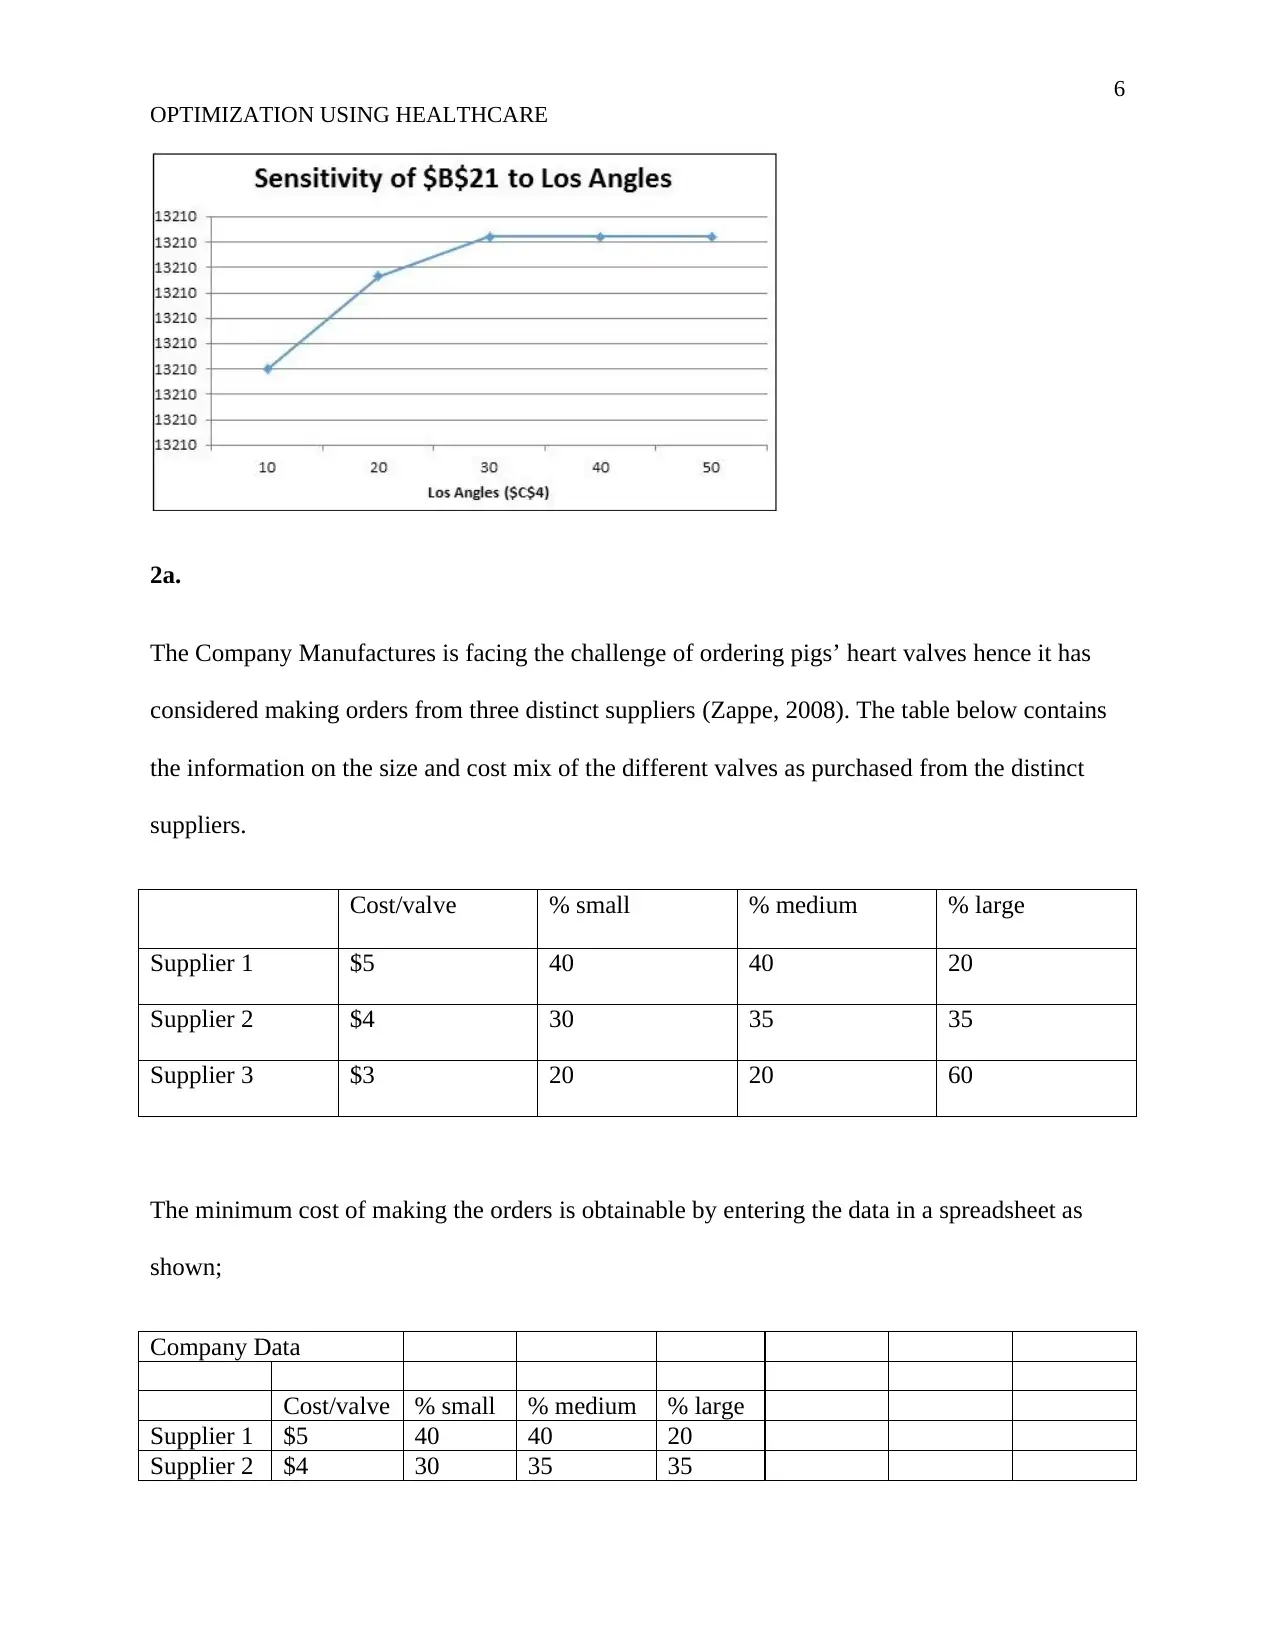
Below is the chart illustrative of Total Cost versus Extra Hours in Los Angeles
OPTIMIZATION USING HEALTHCARE
b.
The Solver Table is used in performing the analysis of sensitivity that would aid in finding out
how much the company would be able and willing to pay should there need be purchase extra
hours for the machine. From the Solver Table, which is the sensitivity analysis, it is found out
that an increase in the extra hours increases the cost of production in Indianapolis (Wayne,
2018). In Los Angeles, an increase in the extra hours decreases the production cost. These values
are as shown in the table below;
Los
Angeles
Indianapolis 10 20 30 40 50
10 13210 13210 13210 13210 13210
20 13186.67 13186.67 13186.67 13186.67 13186.67
30 13163.33 13163.33 13163.33 13163.33 13163.33
40 13140 13140 13140 13140 13140
50 13116.67 13116.67 13116.67 13116.67 13116.67
Below is the chart illustrative of Total Cost versus Extra Hours in Los Angeles
6
OPTIMIZATION USING HEALTHCARE
2a.
The Company Manufactures is facing the challenge of ordering pigs’ heart valves hence it has
considered making orders from three distinct suppliers (Zappe, 2008). The table below contains
the information on the size and cost mix of the different valves as purchased from the distinct
suppliers.
Cost/valve % small % medium % large
Supplier 1 $5 40 40 20
Supplier 2 $4 30 35 35
Supplier 3 $3 20 20 60
The minimum cost of making the orders is obtainable by entering the data in a spreadsheet as
shown;
Company Data
Cost/valve % small % medium % large
Supplier 1 $5 40 40 20
Supplier 2 $4 30 35 35
⊘ This is a preview!⊘
Do you want full access?
Subscribe today to unlock all pages.
Trusted by 1+ million students worldwide
7
OPTIMIZATION USING HEALTHCARE
Supplier 3 $3 20 20 60
Total Max.
Supply
Order 1 50 50 25 125 <= 500
Order 2 150 175 175 500 <= 500
Order 3 100 100 300 500 <= 500
Total 300 325 500
>= >= >=
Demand 300 300 500
Total Cost 4125
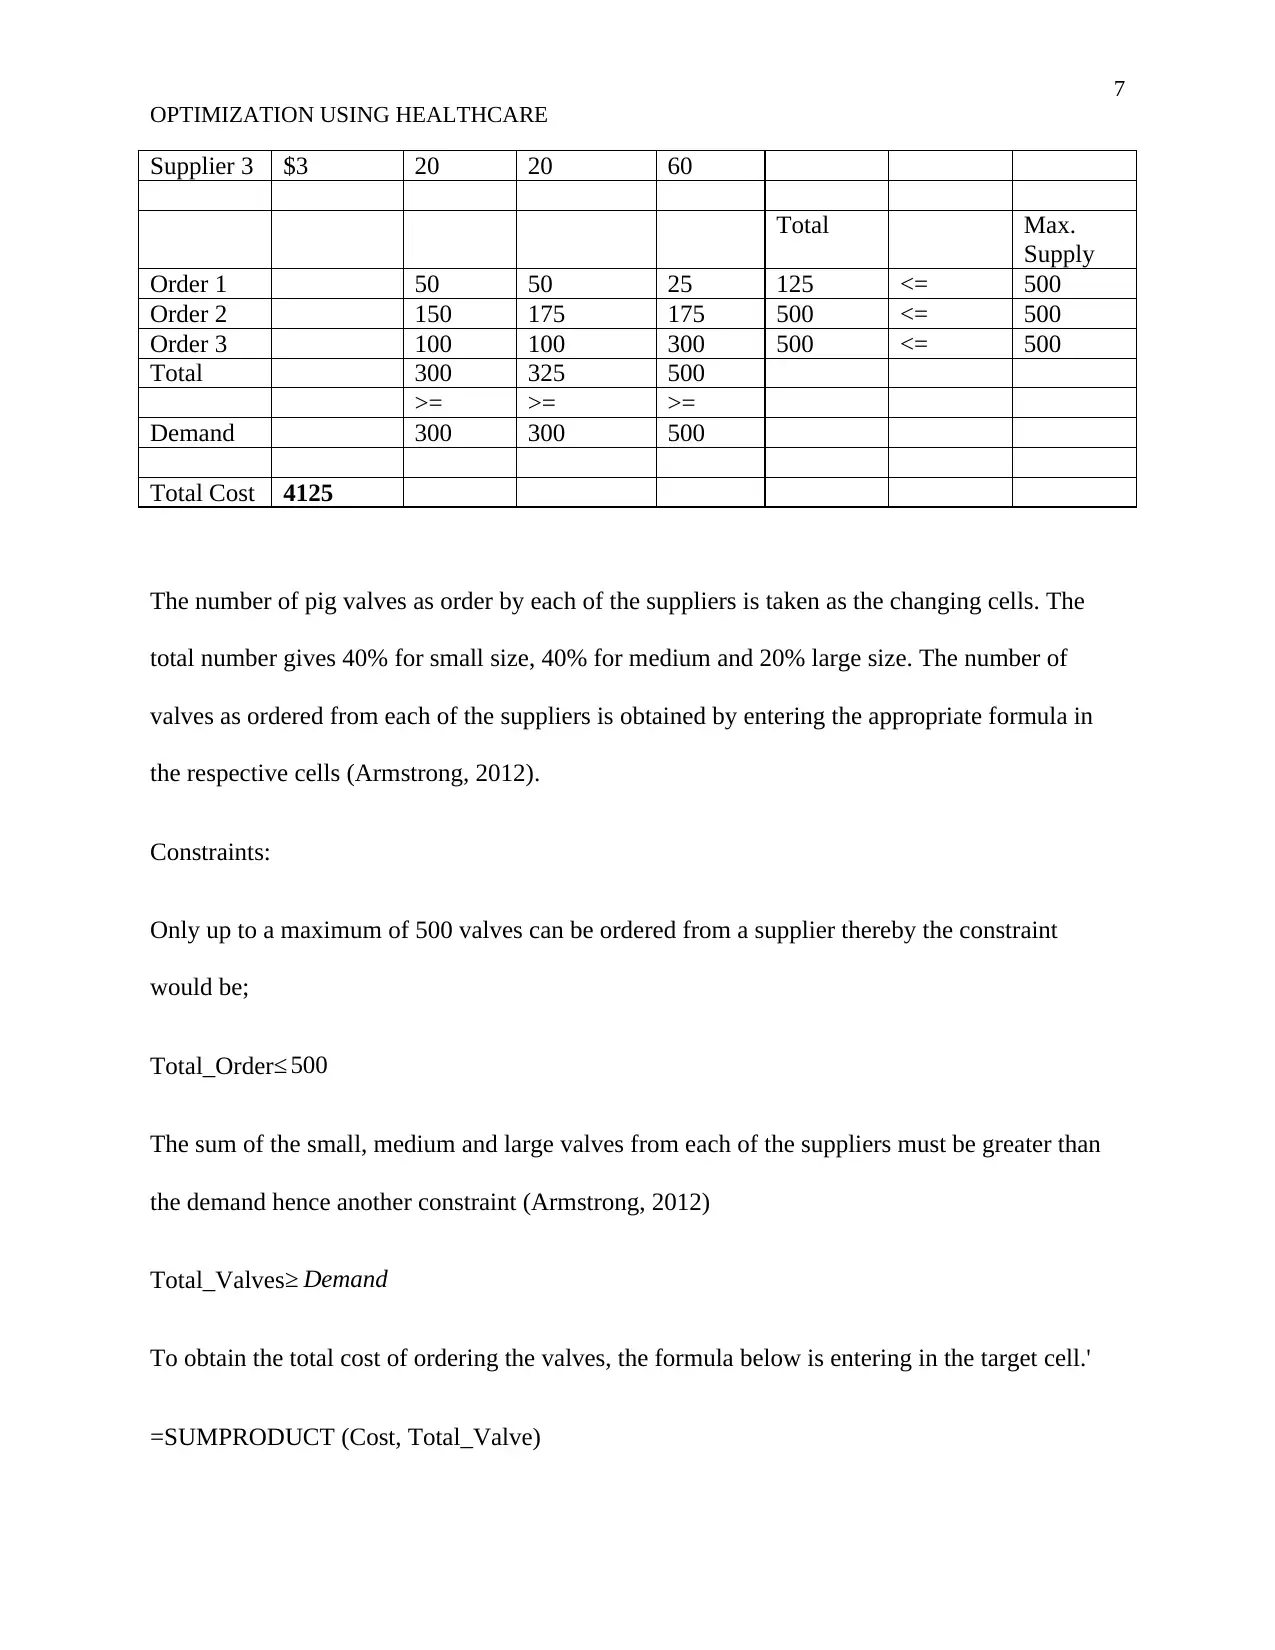
The number of pig valves as order by each of the suppliers is taken as the changing cells. The
total number gives 40% for small size, 40% for medium and 20% large size. The number of
valves as ordered from each of the suppliers is obtained by entering the appropriate formula in
the respective cells (Armstrong, 2012).
Constraints:
Only up to a maximum of 500 valves can be ordered from a supplier thereby the constraint
would be;
Total_Order≤ 500
The sum of the small, medium and large valves from each of the suppliers must be greater than
the demand hence another constraint (Armstrong, 2012)
Total_Valves≥ Demand
To obtain the total cost of ordering the valves, the formula below is entering in the target cell.'
=SUMPRODUCT (Cost, Total_Valve)
OPTIMIZATION USING HEALTHCARE
Supplier 3 $3 20 20 60
Total Max.
Supply
Order 1 50 50 25 125 <= 500
Order 2 150 175 175 500 <= 500
Order 3 100 100 300 500 <= 500
Total 300 325 500
>= >= >=
Demand 300 300 500
Total Cost 4125
The number of pig valves as order by each of the suppliers is taken as the changing cells. The
total number gives 40% for small size, 40% for medium and 20% large size. The number of
valves as ordered from each of the suppliers is obtained by entering the appropriate formula in
the respective cells (Armstrong, 2012).
Constraints:
Only up to a maximum of 500 valves can be ordered from a supplier thereby the constraint
would be;
Total_Order≤ 500
The sum of the small, medium and large valves from each of the suppliers must be greater than
the demand hence another constraint (Armstrong, 2012)
Total_Valves≥ Demand
To obtain the total cost of ordering the valves, the formula below is entering in the target cell.'
=SUMPRODUCT (Cost, Total_Valve)
Paraphrase This Document
Need a fresh take? Get an instant paraphrase of this document with our AI Paraphraser
8
OPTIMIZATION USING HEALTHCARE
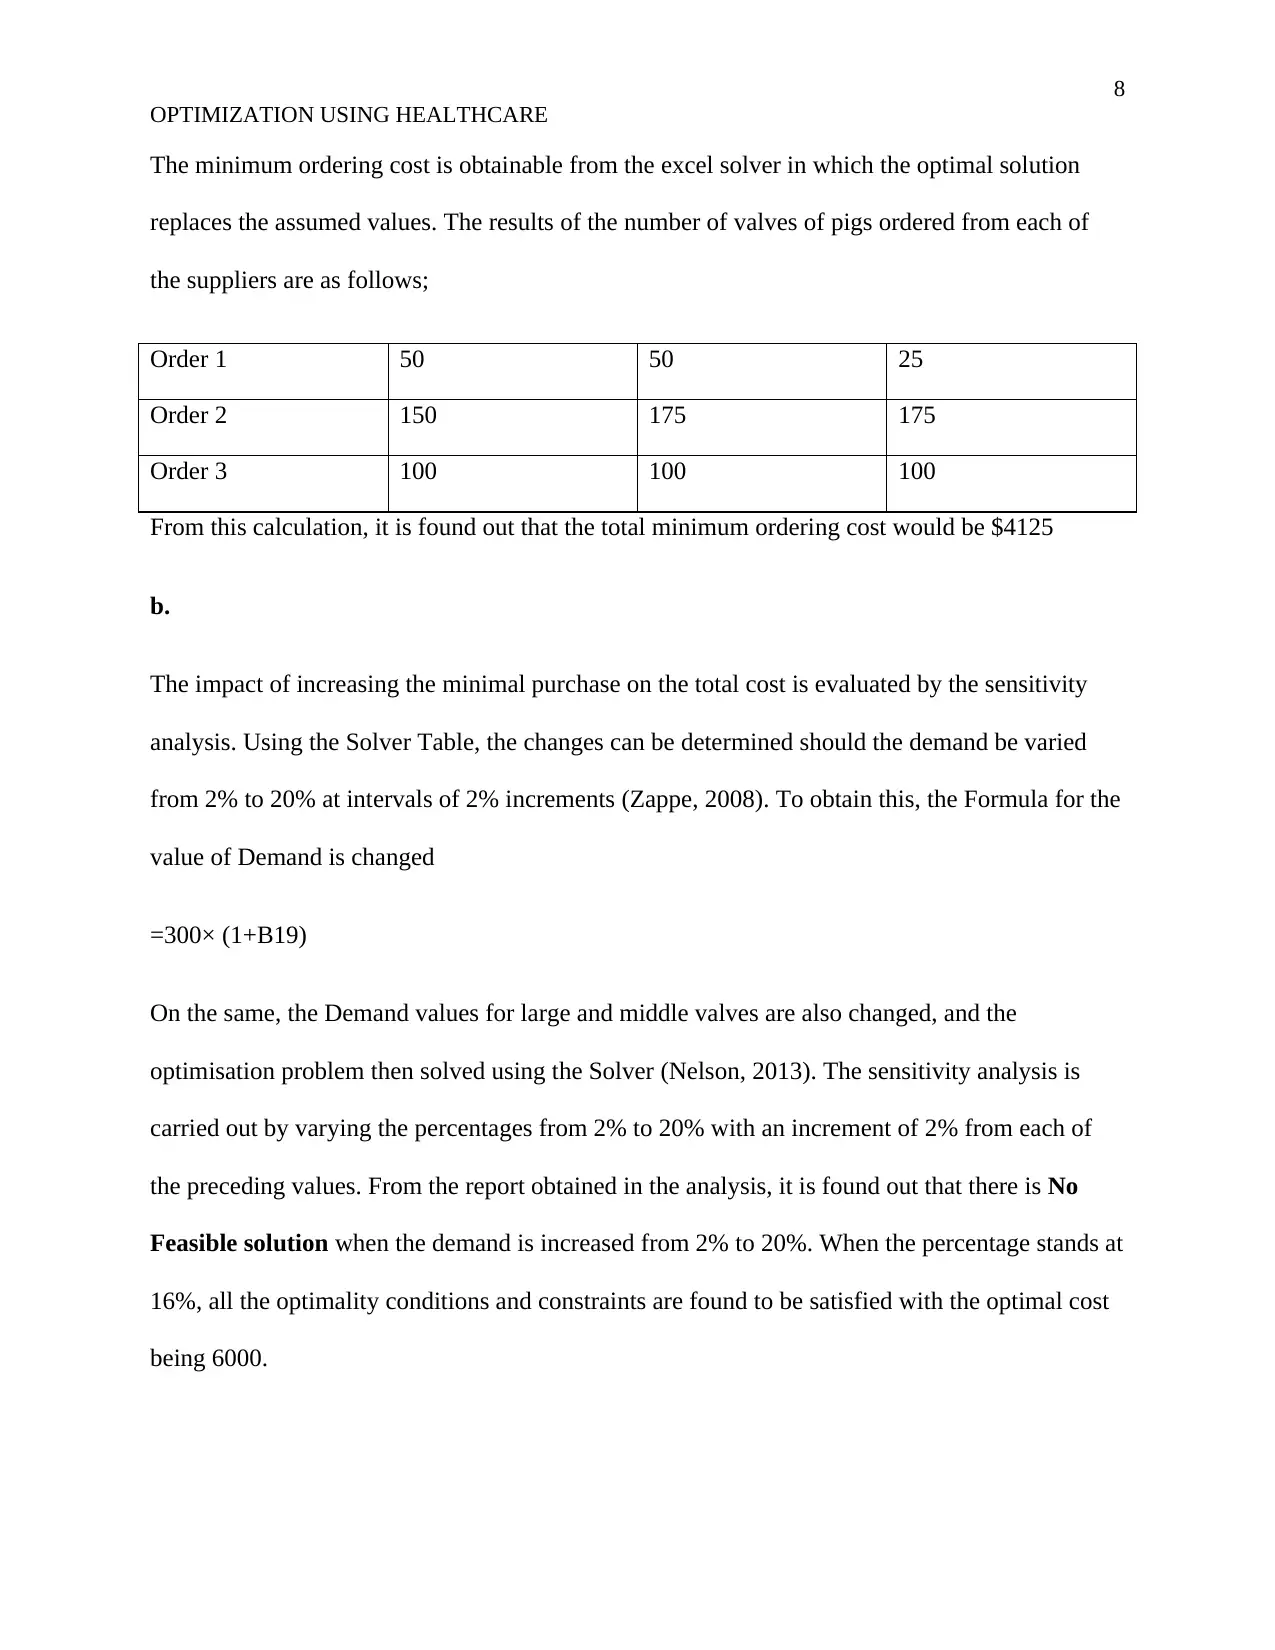
The minimum ordering cost is obtainable from the excel solver in which the optimal solution
replaces the assumed values. The results of the number of valves of pigs ordered from each of
the suppliers are as follows;
Order 1 50 50 25
Order 2 150 175 175
Order 3 100 100 100
From this calculation, it is found out that the total minimum ordering cost would be $4125
b.
The impact of increasing the minimal purchase on the total cost is evaluated by the sensitivity
analysis. Using the Solver Table, the changes can be determined should the demand be varied
from 2% to 20% at intervals of 2% increments (Zappe, 2008). To obtain this, the Formula for the
value of Demand is changed
=300× (1+B19)
On the same, the Demand values for large and middle valves are also changed, and the
optimisation problem then solved using the Solver (Nelson, 2013). The sensitivity analysis is
carried out by varying the percentages from 2% to 20% with an increment of 2% from each of
the preceding values. From the report obtained in the analysis, it is found out that there is No
Feasible solution when the demand is increased from 2% to 20%. When the percentage stands at
16%, all the optimality conditions and constraints are found to be satisfied with the optimal cost
being 6000.
OPTIMIZATION USING HEALTHCARE
The minimum ordering cost is obtainable from the excel solver in which the optimal solution
replaces the assumed values. The results of the number of valves of pigs ordered from each of
the suppliers are as follows;
Order 1 50 50 25
Order 2 150 175 175
Order 3 100 100 100
From this calculation, it is found out that the total minimum ordering cost would be $4125
b.
The impact of increasing the minimal purchase on the total cost is evaluated by the sensitivity
analysis. Using the Solver Table, the changes can be determined should the demand be varied
from 2% to 20% at intervals of 2% increments (Zappe, 2008). To obtain this, the Formula for the
value of Demand is changed
=300× (1+B19)
On the same, the Demand values for large and middle valves are also changed, and the
optimisation problem then solved using the Solver (Nelson, 2013). The sensitivity analysis is
carried out by varying the percentages from 2% to 20% with an increment of 2% from each of
the preceding values. From the report obtained in the analysis, it is found out that there is No
Feasible solution when the demand is increased from 2% to 20%. When the percentage stands at
16%, all the optimality conditions and constraints are found to be satisfied with the optimal cost
being 6000.
9
OPTIMIZATION USING HEALTHCARE
References
Armstrong, B. (2012). Brief Calculus for the Business, Social, and Life Sciences. London: Jones
& Bartlett Publishers.
Besanko, D. (2010). Microeconomics. North Carolina: John Wiley & Sons.
Nelson, M. (2013). Drugs and Money: Prices, Affordability and Cost Containment. New Delhi:
IOS Press.
Wayne, W. (2018). Practical Management Science. New York: Cengage Learning.
Winston, W. L. (2016). Business Analytics: Data Analysis & Decision Making. New York:
Cengage Learning.
Zappe, C. (2008). Data Analysis and Decision Making with Microsoft Excel, Revised. Vienna:
engage Learning.
⊘ This is a preview!⊘
Do you want full access?
Subscribe today to unlock all pages.
Trusted by 1+ million students worldwide
1 out of 9
Your All-in-One AI-Powered Toolkit for Academic Success.
+13062052269
info@desklib.com
Available 24*7 on WhatsApp / Email
![[object Object]](/_next/static/media/star-bottom.7253800d.svg)
Unlock your academic potential
Copyright © 2020–2026 A2Z Services. All Rights Reserved. Developed and managed by ZUCOL.