PHB2 Protein: Structure, Expression, Interactions, and Modifications
VerifiedAdded on 2019/10/18
|11
|5115
|297
Report
AI Summary
This report provides a comprehensive overview of the PHB2 protein, a ubiquitously expressed protein belonging to the stomatin, prohibitin, flotillin, and HflK/C superfamily. The report details the gene structure and expression of PHB2, highlighting its presence in the nucleus, mitochondria, and cytosol, where it performs distinct functions. In the mitochondria, PHB2 forms a heterodimeric complex crucial for stability, while in the nucleus, it independently suppresses target genes. The report explores PHB2's role in various cellular processes, including its correlation with reactive oxygen species (ROS) and inflammation, making it relevant to diseases like cancer and diabetes. It examines the protein's post-translational modifications (PTMs), including phosphorylation, acetylation, and ubiquitylation, and their impact on its function and interactions. Furthermore, the report discusses the protein-protein interactions of PHB2, including its association with transcription factors, DNA-modifying enzymes, and proteins involved in RNA processing, cytoskeleton, and mitochondrial function. The report also highlights the functional outcomes of these interactions, providing insights into PHB2's role in cellular signaling, mitochondrial protection, and transcriptional regulation.
Please do paraphrase and do not change in-text reference
The prohibitin
The prohibitin proteins are a ubiquitously expressed pair of proteins, prohibitin 1 and prohibitin 2 [PHB2,
also referred to as repressor of estrogen receptor activity (REA) or B-cell receptor associate protein
(BAP)-37], belonging to the stomatin, prohibitin, flotillin, and HflK/C superfamily (Mishra, Murphy &
Murphy, 2017). It was originally observed that transfection of PHB1 cDNA resulted in cell cycle arrest;
hence the designation “prohibitin” (Mishra, Murphy & Murphy, 2006), ("Isolation of a cDNA that hybrid
selects antiproliferative mRNA from rat liver - ScienceDirect", 2006). Both PHB1 and PHB2 have been
shown to be present in the nucleus, mitochondria and cytosol, as well as associated with certain cell
membrane receptors ("Prohibitin Ligands in Cell Death and Survival: Mode of Action and Therapeutic
Potential - ScienceDirect", 1989). The PHBs are currently one of the best examples presenting clear and
distinctive functions depending on intercellular localization. In the mitochondria, PHB1 and PHB2 form an
alternating heterodimeric ring-like complex required for mitochondrial stability. In contrast, in the nucleus
both PHBs result in the transcriptional suppression of target genes, but independently from one another
(Mishra, Murphy & Murphy, 2006), ("Prohibitin Ligands in Cell Death and Survival: Mode of Action and
Therapeutic Potential - ScienceDirect", 1989). Although nuclear PHBs have been demonstrated to
influence multiple transcription factors and the cell cycle, the majority of cellular effects observed following
the loss of either prohibitin can be attributed to their function in the mitochondria (Merkwirth et al.,
2008).Expression of the PHBs is correlated to the level of reactive oxygen species (ROS) and
inflammation; therefore, diseases with an inflammatory component (cancer, diabetes, and neuromuscular
degenerative disorders) likely present with alterations in PHB1/2 expression and/or localization. In fact,
experimental alteration of PHB expression in diverse model systems mimics several inflammatory
pathologies (Merkwirth et al., 2012), (Supale et al., 2013), (Theiss et al., 2007), (Kasashima, Ohta,
Kagawa & Endo, 2006). While most of the knowledge to date concerning the PHBs has been gleaned
from studies with PHB1, this review focuses on PHB2 and the recent advances in the field that implicate
the PHBs as intercellular communicators between the nucleus and mitochondria. (Bavelloni, Piazzi,
Raffini, Faenza & Blalock, 2015).
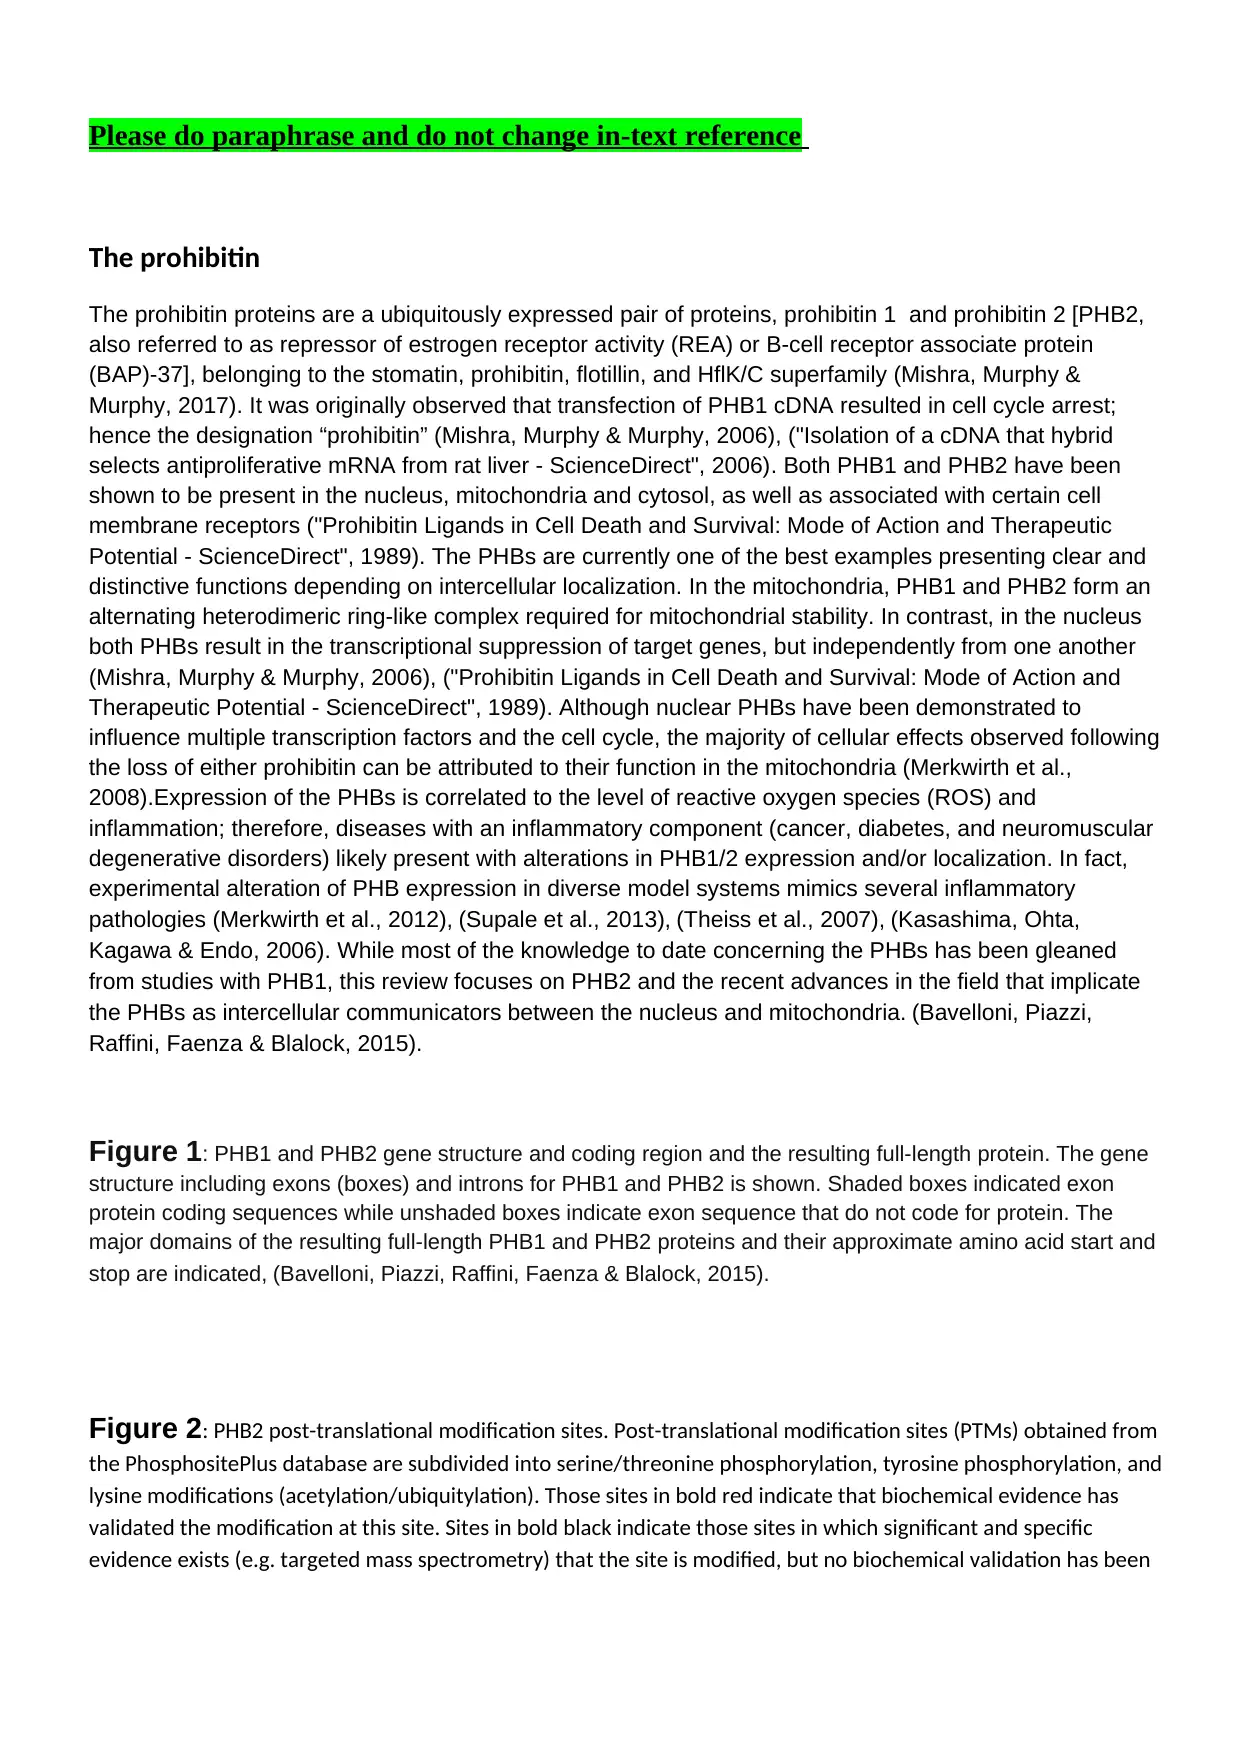
Figure 1: PHB1 and PHB2 gene structure and coding region and the resulting full-length protein. The gene
structure including exons (boxes) and introns for PHB1 and PHB2 is shown. Shaded boxes indicated exon
protein coding sequences while unshaded boxes indicate exon sequence that do not code for protein. The
major domains of the resulting full-length PHB1 and PHB2 proteins and their approximate amino acid start and
stop are indicated, (Bavelloni, Piazzi, Raffini, Faenza & Blalock, 2015).
Figure 2: PHB2 post-translational modification sites. Post-translational modification sites (PTMs) obtained from
the PhosphositePlus database are subdivided into serine/threonine phosphorylation, tyrosine phosphorylation, and
lysine modifications (acetylation/ubiquitylation). Those sites in bold red indicate that biochemical evidence has
validated the modification at this site. Sites in bold black indicate those sites in which significant and specific
evidence exists (e.g. targeted mass spectrometry) that the site is modified, but no biochemical validation has been
The prohibitin
The prohibitin proteins are a ubiquitously expressed pair of proteins, prohibitin 1 and prohibitin 2 [PHB2,
also referred to as repressor of estrogen receptor activity (REA) or B-cell receptor associate protein
(BAP)-37], belonging to the stomatin, prohibitin, flotillin, and HflK/C superfamily (Mishra, Murphy &
Murphy, 2017). It was originally observed that transfection of PHB1 cDNA resulted in cell cycle arrest;
hence the designation “prohibitin” (Mishra, Murphy & Murphy, 2006), ("Isolation of a cDNA that hybrid
selects antiproliferative mRNA from rat liver - ScienceDirect", 2006). Both PHB1 and PHB2 have been
shown to be present in the nucleus, mitochondria and cytosol, as well as associated with certain cell
membrane receptors ("Prohibitin Ligands in Cell Death and Survival: Mode of Action and Therapeutic
Potential - ScienceDirect", 1989). The PHBs are currently one of the best examples presenting clear and
distinctive functions depending on intercellular localization. In the mitochondria, PHB1 and PHB2 form an
alternating heterodimeric ring-like complex required for mitochondrial stability. In contrast, in the nucleus
both PHBs result in the transcriptional suppression of target genes, but independently from one another
(Mishra, Murphy & Murphy, 2006), ("Prohibitin Ligands in Cell Death and Survival: Mode of Action and
Therapeutic Potential - ScienceDirect", 1989). Although nuclear PHBs have been demonstrated to
influence multiple transcription factors and the cell cycle, the majority of cellular effects observed following
the loss of either prohibitin can be attributed to their function in the mitochondria (Merkwirth et al.,
2008).Expression of the PHBs is correlated to the level of reactive oxygen species (ROS) and
inflammation; therefore, diseases with an inflammatory component (cancer, diabetes, and neuromuscular
degenerative disorders) likely present with alterations in PHB1/2 expression and/or localization. In fact,
experimental alteration of PHB expression in diverse model systems mimics several inflammatory
pathologies (Merkwirth et al., 2012), (Supale et al., 2013), (Theiss et al., 2007), (Kasashima, Ohta,
Kagawa & Endo, 2006). While most of the knowledge to date concerning the PHBs has been gleaned
from studies with PHB1, this review focuses on PHB2 and the recent advances in the field that implicate
the PHBs as intercellular communicators between the nucleus and mitochondria. (Bavelloni, Piazzi,
Raffini, Faenza & Blalock, 2015).
Figure 1: PHB1 and PHB2 gene structure and coding region and the resulting full-length protein. The gene
structure including exons (boxes) and introns for PHB1 and PHB2 is shown. Shaded boxes indicated exon
protein coding sequences while unshaded boxes indicate exon sequence that do not code for protein. The
major domains of the resulting full-length PHB1 and PHB2 proteins and their approximate amino acid start and
stop are indicated, (Bavelloni, Piazzi, Raffini, Faenza & Blalock, 2015).
Figure 2: PHB2 post-translational modification sites. Post-translational modification sites (PTMs) obtained from
the PhosphositePlus database are subdivided into serine/threonine phosphorylation, tyrosine phosphorylation, and
lysine modifications (acetylation/ubiquitylation). Those sites in bold red indicate that biochemical evidence has
validated the modification at this site. Sites in bold black indicate those sites in which significant and specific
evidence exists (e.g. targeted mass spectrometry) that the site is modified, but no biochemical validation has been
Paraphrase This Document
Need a fresh take? Get an instant paraphrase of this document with our AI Paraphraser
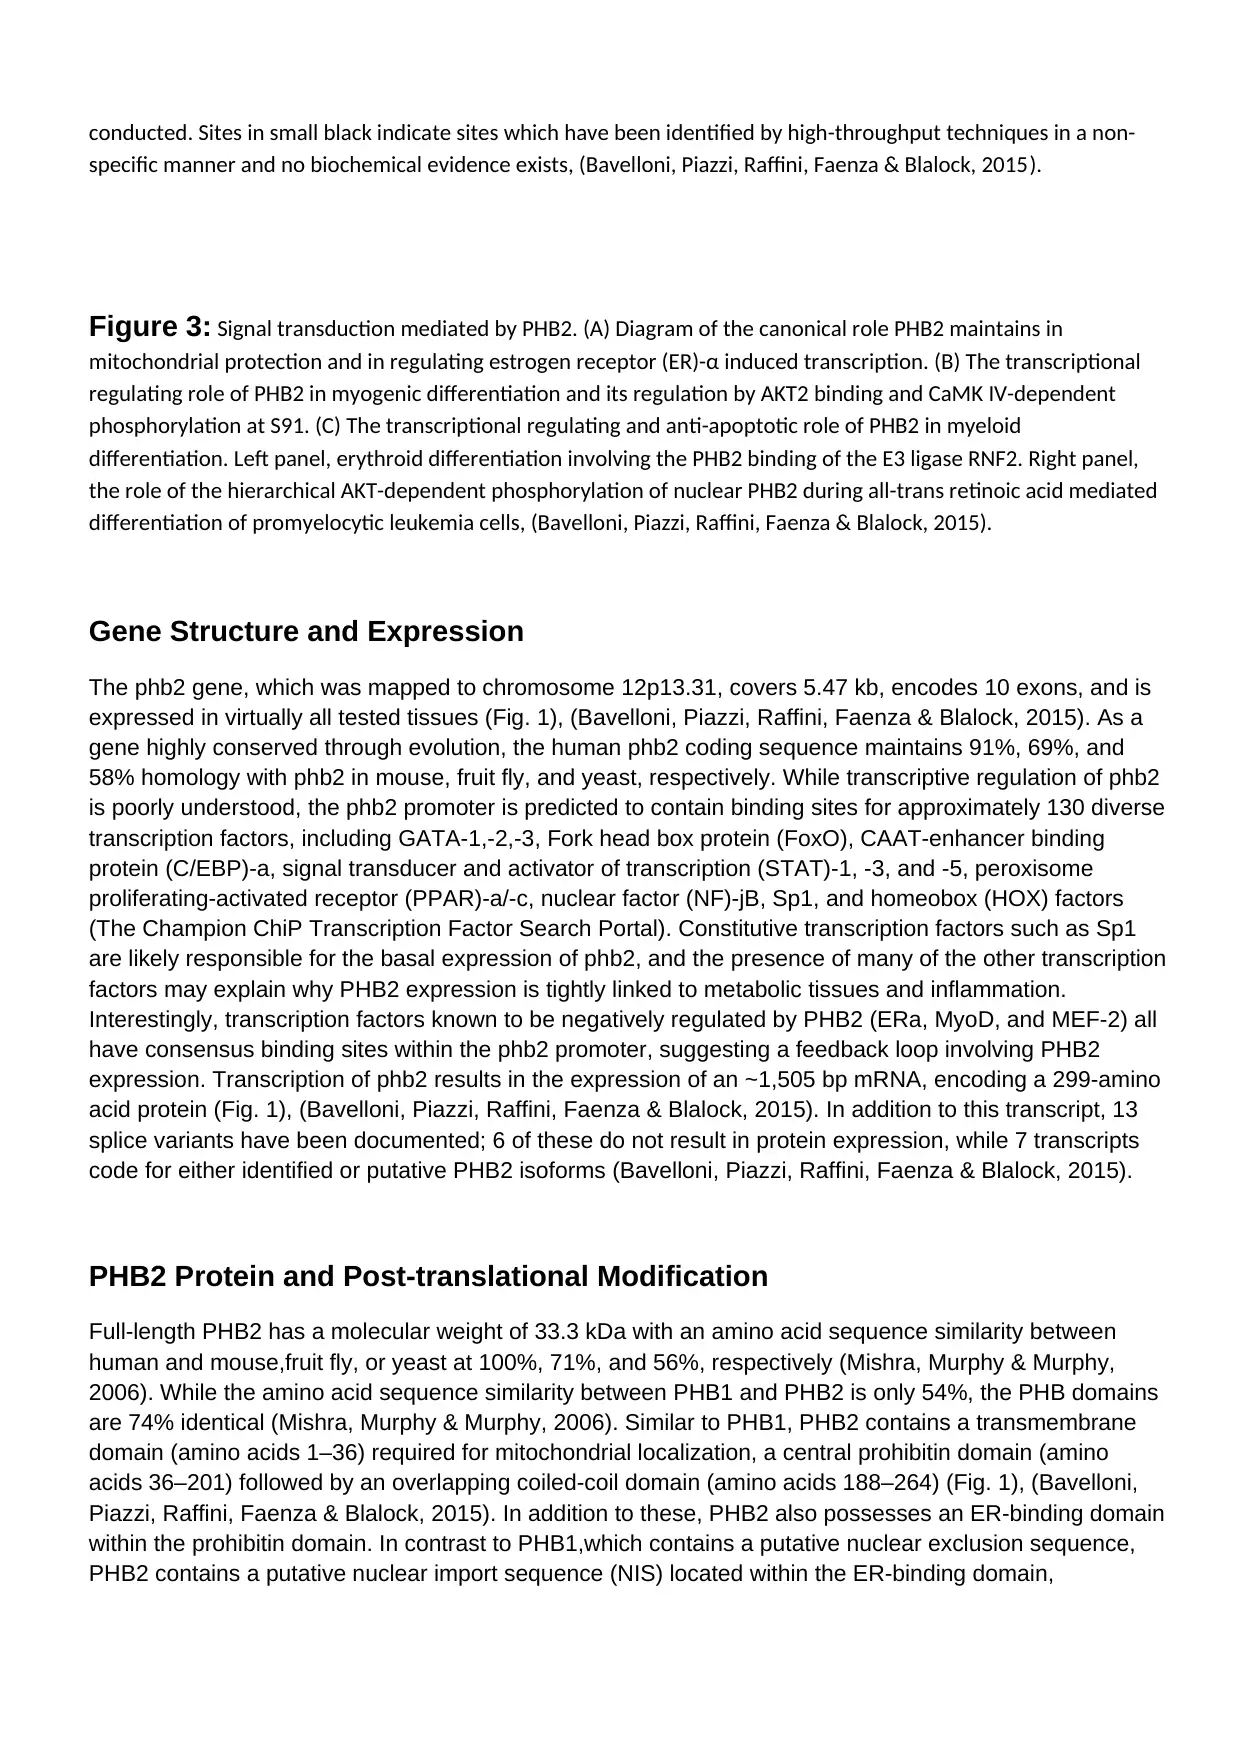
conducted. Sites in small black indicate sites which have been identified by high-throughput techniques in a non-
specific manner and no biochemical evidence exists, (Bavelloni, Piazzi, Raffini, Faenza & Blalock, 2015).
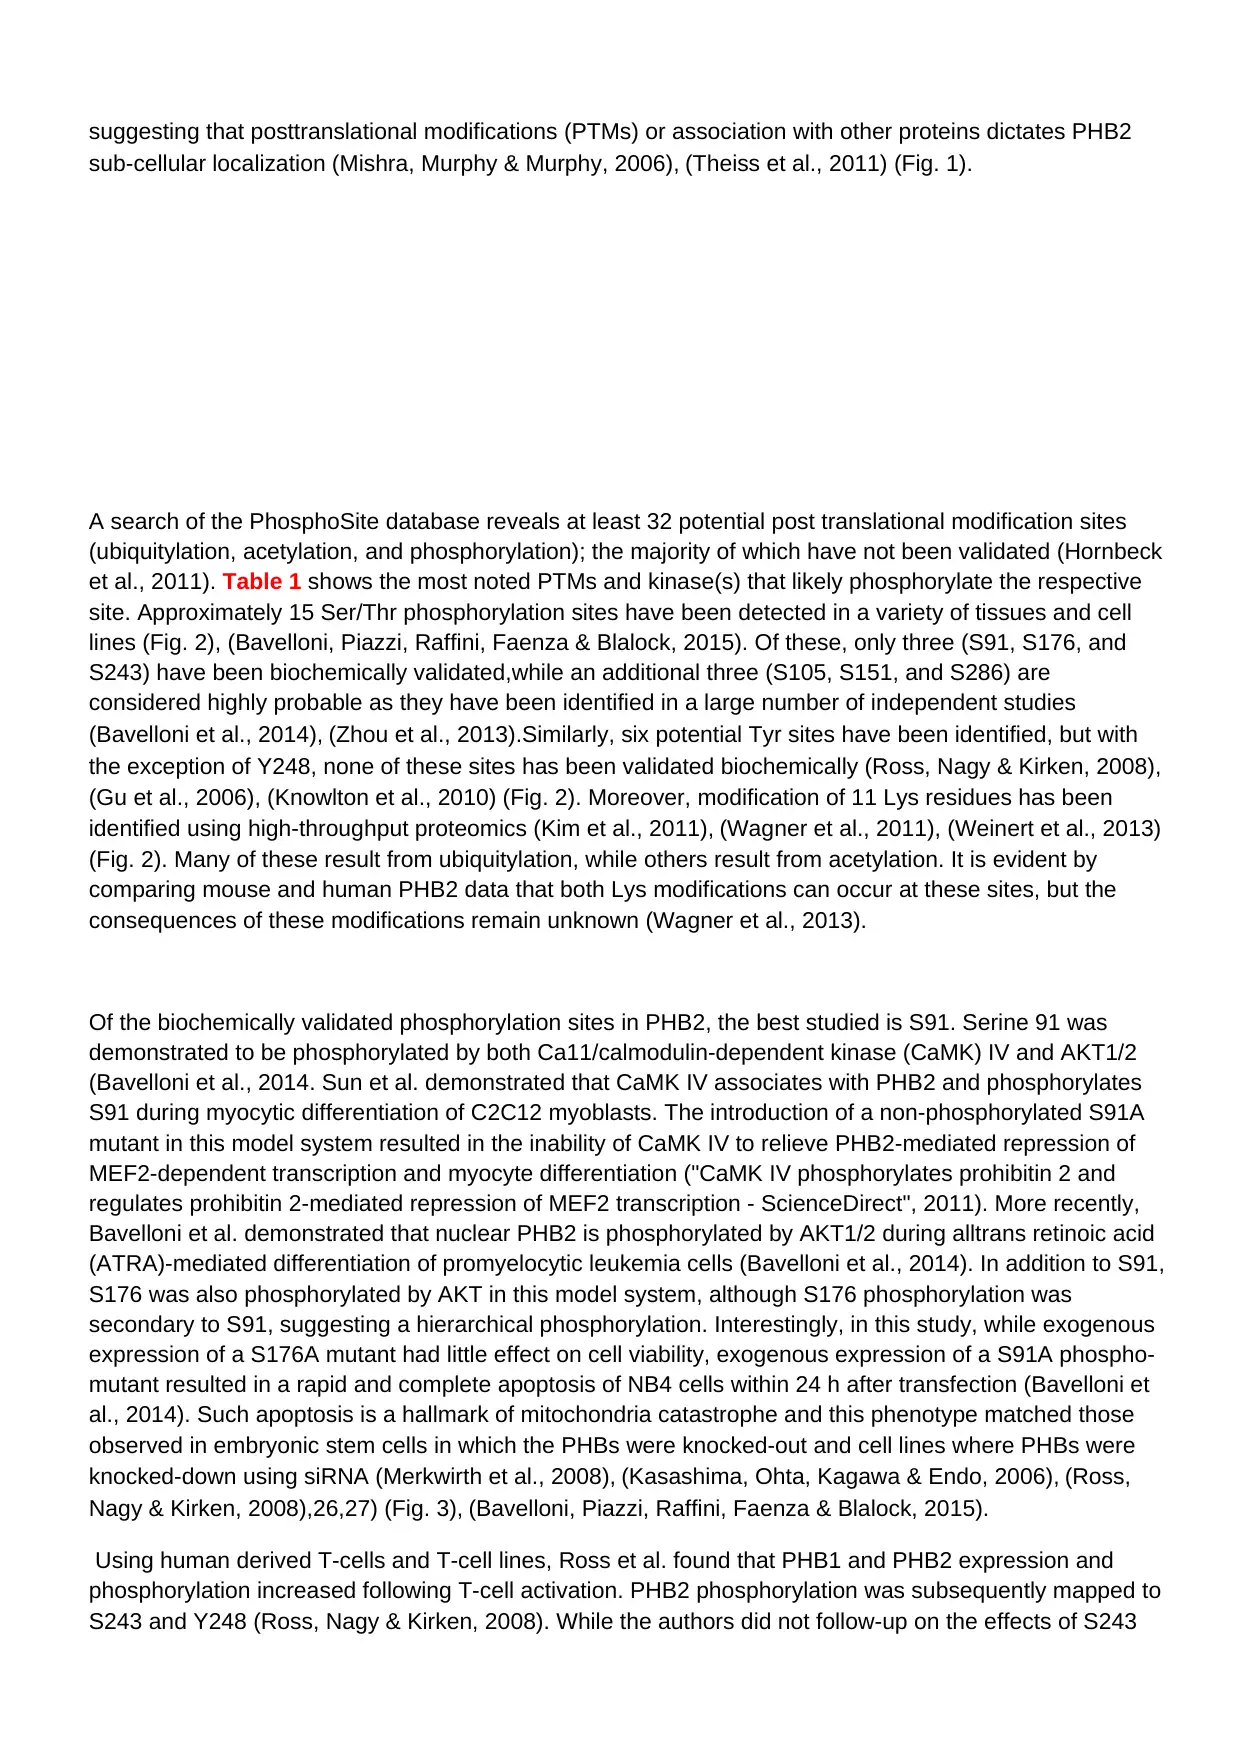
Figure 3: Signal transduction mediated by PHB2. (A) Diagram of the canonical role PHB2 maintains in
mitochondrial protection and in regulating estrogen receptor (ER)-α induced transcription. (B) The transcriptional
regulating role of PHB2 in myogenic differentiation and its regulation by AKT2 binding and CaMK IV-dependent
phosphorylation at S91. (C) The transcriptional regulating and anti-apoptotic role of PHB2 in myeloid
differentiation. Left panel, erythroid differentiation involving the PHB2 binding of the E3 ligase RNF2. Right panel,
the role of the hierarchical AKT-dependent phosphorylation of nuclear PHB2 during all-trans retinoic acid mediated
differentiation of promyelocytic leukemia cells, (Bavelloni, Piazzi, Raffini, Faenza & Blalock, 2015).
Gene Structure and Expression
The phb2 gene, which was mapped to chromosome 12p13.31, covers 5.47 kb, encodes 10 exons, and is
expressed in virtually all tested tissues (Fig. 1), (Bavelloni, Piazzi, Raffini, Faenza & Blalock, 2015). As a
gene highly conserved through evolution, the human phb2 coding sequence maintains 91%, 69%, and
58% homology with phb2 in mouse, fruit fly, and yeast, respectively. While transcriptive regulation of phb2
is poorly understood, the phb2 promoter is predicted to contain binding sites for approximately 130 diverse
transcription factors, including GATA-1,-2,-3, Fork head box protein (FoxO), CAAT-enhancer binding
protein (C/EBP)-a, signal transducer and activator of transcription (STAT)-1, -3, and -5, peroxisome
proliferating-activated receptor (PPAR)-a/-c, nuclear factor (NF)-jB, Sp1, and homeobox (HOX) factors
(The Champion ChiP Transcription Factor Search Portal). Constitutive transcription factors such as Sp1
are likely responsible for the basal expression of phb2, and the presence of many of the other transcription
factors may explain why PHB2 expression is tightly linked to metabolic tissues and inflammation.
Interestingly, transcription factors known to be negatively regulated by PHB2 (ERa, MyoD, and MEF-2) all
have consensus binding sites within the phb2 promoter, suggesting a feedback loop involving PHB2
expression. Transcription of phb2 results in the expression of an ~1,505 bp mRNA, encoding a 299-amino
acid protein (Fig. 1), (Bavelloni, Piazzi, Raffini, Faenza & Blalock, 2015). In addition to this transcript, 13
splice variants have been documented; 6 of these do not result in protein expression, while 7 transcripts
code for either identified or putative PHB2 isoforms (Bavelloni, Piazzi, Raffini, Faenza & Blalock, 2015).
PHB2 Protein and Post-translational Modification
Full-length PHB2 has a molecular weight of 33.3 kDa with an amino acid sequence similarity between
human and mouse,fruit fly, or yeast at 100%, 71%, and 56%, respectively (Mishra, Murphy & Murphy,
2006). While the amino acid sequence similarity between PHB1 and PHB2 is only 54%, the PHB domains
are 74% identical (Mishra, Murphy & Murphy, 2006). Similar to PHB1, PHB2 contains a transmembrane
domain (amino acids 1–36) required for mitochondrial localization, a central prohibitin domain (amino
acids 36–201) followed by an overlapping coiled-coil domain (amino acids 188–264) (Fig. 1), (Bavelloni,
Piazzi, Raffini, Faenza & Blalock, 2015). In addition to these, PHB2 also possesses an ER-binding domain
within the prohibitin domain. In contrast to PHB1,which contains a putative nuclear exclusion sequence,
PHB2 contains a putative nuclear import sequence (NIS) located within the ER-binding domain,
specific manner and no biochemical evidence exists, (Bavelloni, Piazzi, Raffini, Faenza & Blalock, 2015).
Figure 3: Signal transduction mediated by PHB2. (A) Diagram of the canonical role PHB2 maintains in
mitochondrial protection and in regulating estrogen receptor (ER)-α induced transcription. (B) The transcriptional
regulating role of PHB2 in myogenic differentiation and its regulation by AKT2 binding and CaMK IV-dependent
phosphorylation at S91. (C) The transcriptional regulating and anti-apoptotic role of PHB2 in myeloid
differentiation. Left panel, erythroid differentiation involving the PHB2 binding of the E3 ligase RNF2. Right panel,
the role of the hierarchical AKT-dependent phosphorylation of nuclear PHB2 during all-trans retinoic acid mediated
differentiation of promyelocytic leukemia cells, (Bavelloni, Piazzi, Raffini, Faenza & Blalock, 2015).
Gene Structure and Expression
The phb2 gene, which was mapped to chromosome 12p13.31, covers 5.47 kb, encodes 10 exons, and is
expressed in virtually all tested tissues (Fig. 1), (Bavelloni, Piazzi, Raffini, Faenza & Blalock, 2015). As a
gene highly conserved through evolution, the human phb2 coding sequence maintains 91%, 69%, and
58% homology with phb2 in mouse, fruit fly, and yeast, respectively. While transcriptive regulation of phb2
is poorly understood, the phb2 promoter is predicted to contain binding sites for approximately 130 diverse
transcription factors, including GATA-1,-2,-3, Fork head box protein (FoxO), CAAT-enhancer binding
protein (C/EBP)-a, signal transducer and activator of transcription (STAT)-1, -3, and -5, peroxisome
proliferating-activated receptor (PPAR)-a/-c, nuclear factor (NF)-jB, Sp1, and homeobox (HOX) factors
(The Champion ChiP Transcription Factor Search Portal). Constitutive transcription factors such as Sp1
are likely responsible for the basal expression of phb2, and the presence of many of the other transcription
factors may explain why PHB2 expression is tightly linked to metabolic tissues and inflammation.
Interestingly, transcription factors known to be negatively regulated by PHB2 (ERa, MyoD, and MEF-2) all
have consensus binding sites within the phb2 promoter, suggesting a feedback loop involving PHB2
expression. Transcription of phb2 results in the expression of an ~1,505 bp mRNA, encoding a 299-amino
acid protein (Fig. 1), (Bavelloni, Piazzi, Raffini, Faenza & Blalock, 2015). In addition to this transcript, 13
splice variants have been documented; 6 of these do not result in protein expression, while 7 transcripts
code for either identified or putative PHB2 isoforms (Bavelloni, Piazzi, Raffini, Faenza & Blalock, 2015).
PHB2 Protein and Post-translational Modification
Full-length PHB2 has a molecular weight of 33.3 kDa with an amino acid sequence similarity between
human and mouse,fruit fly, or yeast at 100%, 71%, and 56%, respectively (Mishra, Murphy & Murphy,
2006). While the amino acid sequence similarity between PHB1 and PHB2 is only 54%, the PHB domains
are 74% identical (Mishra, Murphy & Murphy, 2006). Similar to PHB1, PHB2 contains a transmembrane
domain (amino acids 1–36) required for mitochondrial localization, a central prohibitin domain (amino
acids 36–201) followed by an overlapping coiled-coil domain (amino acids 188–264) (Fig. 1), (Bavelloni,
Piazzi, Raffini, Faenza & Blalock, 2015). In addition to these, PHB2 also possesses an ER-binding domain
within the prohibitin domain. In contrast to PHB1,which contains a putative nuclear exclusion sequence,
PHB2 contains a putative nuclear import sequence (NIS) located within the ER-binding domain,
suggesting that posttranslational modifications (PTMs) or association with other proteins dictates PHB2
sub-cellular localization (Mishra, Murphy & Murphy, 2006), (Theiss et al., 2011) (Fig. 1).
A search of the PhosphoSite database reveals at least 32 potential post translational modification sites
(ubiquitylation, acetylation, and phosphorylation); the majority of which have not been validated (Hornbeck
et al., 2011). Table 1 shows the most noted PTMs and kinase(s) that likely phosphorylate the respective
site. Approximately 15 Ser/Thr phosphorylation sites have been detected in a variety of tissues and cell
lines (Fig. 2), (Bavelloni, Piazzi, Raffini, Faenza & Blalock, 2015). Of these, only three (S91, S176, and
S243) have been biochemically validated,while an additional three (S105, S151, and S286) are
considered highly probable as they have been identified in a large number of independent studies
(Bavelloni et al., 2014), (Zhou et al., 2013).Similarly, six potential Tyr sites have been identified, but with
the exception of Y248, none of these sites has been validated biochemically (Ross, Nagy & Kirken, 2008),
(Gu et al., 2006), (Knowlton et al., 2010) (Fig. 2). Moreover, modification of 11 Lys residues has been
identified using high-throughput proteomics (Kim et al., 2011), (Wagner et al., 2011), (Weinert et al., 2013)
(Fig. 2). Many of these result from ubiquitylation, while others result from acetylation. It is evident by
comparing mouse and human PHB2 data that both Lys modifications can occur at these sites, but the
consequences of these modifications remain unknown (Wagner et al., 2013).
Of the biochemically validated phosphorylation sites in PHB2, the best studied is S91. Serine 91 was
demonstrated to be phosphorylated by both Ca11/calmodulin-dependent kinase (CaMK) IV and AKT1/2
(Bavelloni et al., 2014. Sun et al. demonstrated that CaMK IV associates with PHB2 and phosphorylates
S91 during myocytic differentiation of C2C12 myoblasts. The introduction of a non-phosphorylated S91A
mutant in this model system resulted in the inability of CaMK IV to relieve PHB2-mediated repression of
MEF2-dependent transcription and myocyte differentiation ("CaMK IV phosphorylates prohibitin 2 and
regulates prohibitin 2-mediated repression of MEF2 transcription - ScienceDirect", 2011). More recently,
Bavelloni et al. demonstrated that nuclear PHB2 is phosphorylated by AKT1/2 during alltrans retinoic acid
(ATRA)-mediated differentiation of promyelocytic leukemia cells (Bavelloni et al., 2014). In addition to S91,
S176 was also phosphorylated by AKT in this model system, although S176 phosphorylation was
secondary to S91, suggesting a hierarchical phosphorylation. Interestingly, in this study, while exogenous
expression of a S176A mutant had little effect on cell viability, exogenous expression of a S91A phospho-
mutant resulted in a rapid and complete apoptosis of NB4 cells within 24 h after transfection (Bavelloni et
al., 2014). Such apoptosis is a hallmark of mitochondria catastrophe and this phenotype matched those
observed in embryonic stem cells in which the PHBs were knocked-out and cell lines where PHBs were
knocked-down using siRNA (Merkwirth et al., 2008), (Kasashima, Ohta, Kagawa & Endo, 2006), (Ross,
Nagy & Kirken, 2008),26,27) (Fig. 3), (Bavelloni, Piazzi, Raffini, Faenza & Blalock, 2015).
Using human derived T-cells and T-cell lines, Ross et al. found that PHB1 and PHB2 expression and
phosphorylation increased following T-cell activation. PHB2 phosphorylation was subsequently mapped to
S243 and Y248 (Ross, Nagy & Kirken, 2008). While the authors did not follow-up on the effects of S243
⊘ This is a preview!⊘
Do you want full access?
Subscribe today to unlock all pages.
Trusted by 1+ million students worldwide
phosphorylation, they did demonstrate through the use of a Y248F PHB2 mutant, that phosphorylation of
Y248 was not essential for cell survival or association with PHB1 (Ross, Nagy & Kirken, 2008).
Protein-Protein Interactions and Complex Formation
The prohibitins have been identified in complex with proteins with diverse cellular functions. While some
associations at the plasma membrane and in the mitochondria require both PHB1 and PHB2, the majority
of protein-protein interactions are specific to each prohibitin (Bavelloni, Piazzi, Raffini, Faenza & Blalock,
2015).
In the nucleus, many PHB2 interacting proteins are both global and specific transcription factors,
including: the cAMPdependent transcription factor (ATF)-2, b-catenin, COUP-TF1, COUP-TF2, the
estrogen receptor (ER)-a, interleukinenhancer binding factor (ILF)-3, MEF2A, MYOD1, Runt-related
transcription factor (RUNX3), and transcription factor (TF)-E3 (Lau et al., 2012), (Ewing et al., 2007), (Sun,
2004). Others are DNA modifying enzymes, including: the histone deacetylases (HDAC1, HDAC2,
HDAC3, and HDAC5), breast-related carcinoma antigen (BRCA)-1, cyclin-dependent kinase (CDK)-2,
polycomb-related proteins of the PRC2/EEDEZH2 complex, DNA repair associated enzymes, and cell
cycle associated proteins (Ewing et al., 2007), (Sun, 2004), (Neganova et al., 2011),(Kim et al., 2009).
Several RNA-binding proteins required for RNA processing (ATP-dependent RNA helicase DDX20),
stability [Epiplakin (EPPK1) and the basophile leukemia expressed protein (Bles03)] and transport
(Staufen) also associate with nuclear PHB2 (Ewing et al., 2007), (Milev, Ravichandran, Khan, Schriemer &
Mouland, 2012), (Bavelloni, Piazzi, Raffini, Faenza & Blalock, 2015).
In the cytosol, most PHB2 interacting proteins are associated with the cytoskeleton and cytoskeletal
transport [coatomer subunit gamma 1 (COPG1)], cellular signaling [MDM2 and receptor interacting S/T
kinase (RIPK)-2], and ubiquitylation (Kim et al., 2011), (Wagner et al., 2011), (Ewing et al., 2007), (Xu,
Cai, Yang, Huang & Ye, 2012). Other cytoplasmic proteins that interact with PHB2 are associated with
integral cell membrane proteins and cellular receptors, such as IGFR1 and integrins like VCAM1
(Humphries et al., 2009).
As the PHBs also function in the mitochondria, many critical mitochondrial proteins associate with PHB2.
These proteins consist of resident proteins belonging to the mitochondrial respiratory chain as well as
mitochondrial transporters and membrane translocases (Richter-Dennerlein et al., 2014). Some
associated proteins are involved in cristae formation and maintenance of mitochondrial structure, while
others are involved in mitochondrial-mediated translation. Prominent mitochondrial apoptosis and
autophagy regulating proteins have also been found associated with PHB2; among these are the
apoptotic related proteins SCaMC-1 (SLC25A24) and growth hormoneinducible transmembrane protein
(GHITM), and the autophagy promoting E3-ligase RNF185 (Richter-Dennerlein et al., 2014). As many of
these PHB2: protein interactions are just coming to light, the functional outcome of PHB2 association with
the majority of these proteins is still unclear (Bavelloni, Piazzi, Raffini, Faenza & Blalock, 2015).
Paraphrase This Document
Need a fresh take? Get an instant paraphrase of this document with our AI Paraphraser
Figure 4 CRISPER:
CRISPR-Cas immunity has three distinct phases. (a) First, in the adaptation phase, injected genetic
material of viral and plasmid invaders establishes a memory of infection. The CRISPR array acquires a
short sequence of the infecting virus or plasmid (Jiang & Marraffini, 2015). This spacer sequence is
integrated into the first repeat of the array by Cas1 and Cas2 and is accompanied by the duplication of this
repeat sequence. The memory recorded by the spacer is used to protect the bacterial host from infection
(Jiang & Marraffini, 2015). First the spacer sequence is transcribed from the leader/promoter region and
the resulting transcript (precursor crRNA, or pre crRNA) is processed into a short crRNA (crRNA
biogenesis phase). The crRNA is then used as a guide to specify the target of cleavage by Cas nucleases
(targeting phase) (Jiang & Marraffini, 2015). (b–d) Three types of CRISPR-Cas systems are distinguished
by cas gene content. They differ in their mechanisms of crRNA biogenesis and targeting, and possibly in
their mechanisms of adaptation as well. Closed and open arrowheads indicate RNA and DNA cleavage,
respectively. Abbreviations: crRNA, CRISPR RNA; PAM, protospacer-adjacent motif; RNAP, RNA
polymerase; tracrRNA, trans-encoded crRNA (Jiang & Marraffini, 2015).
Figure 5 receptors:
DENV E protein interacts with lectin and other molecules expressed on the host cell surface. N-Glycan at
position 67 is recognized by DC-SIGN, and N-glycans at positions 67 and/or 153 may be associated with
host lectin proteins, such as mannose-binding protein. E protein consists of three functional domains.
Domain I (red) is a flexible hinge region that contributes to the conformational change of the protein under
low pH conditions in endosomes. Domain II (yellow) contains hydrophobic amino acid residues that form a
fusion loop at the tip of the domain. In addition, this domain may contribute to dimerization of the protein
on the mature virus membrane. Finally, domain III (blue) is thought to be responsible for the direct
interaction with host receptor molecules. The structure represents E protein of DENV3, which was
modeled using PyMol with PDB accession number 1UZG (Hidari & Suzuki, 2011).

I want do all these points as paragraphs for each title:
Cell Passage:
Cell passaging is a technique that enables an individual to keep cells alive and growing under cultured conditions for
extended periods of time. Cells should be passed when they are 90%-100% confluent.
Materials:
Ethanol squirt bottle.
5 mL, 10 mL sterile pipets
Confluent cells in culture multiwell plates
Media
1.5 ml centrifuge tube
Automatic pipetters
scraper
Procedure for Passaging Cells
1. Warm media in 28C water-bath.
2. Check cells in culture multiwell plates under microscope to confirm that the cells are 90%-100%
confluent.
3. Clean hood with ethanol.
4. Sterilize all materials, bottles, etc. which are loaded into the hood. Spray gloves with ethanol. Jars of
liquid need to be sprayed with ethanol. Sterile pipets may be placed in the hood directly. Automatic
pipetters should enter the hood WITHOUT sterilization.
⊘ This is a preview!⊘
Do you want full access?
Subscribe today to unlock all pages.
Trusted by 1+ million students worldwide
5. Spray gloves with ethanol.
6. Using the Automatic pipetters, transfer 2ml of the media to the new 6-wells plates.
7. Discard 500 μl of the media that in cultured wells (previous one) out.
8. Using the scraper, detach the cells from the bottom of the wells.
9. Check cells under microscope to confirm that cells are detached from the surface.
10. Pipet 100 μl of detached cells to new wells with medium.
11. Pipet the remaining quantity of detached cells to 1.5 ml centrifuge tube and label it to lysate and extract
DNA (purification).
Cell Freezing:
1. Write information on cryovial.
2. Remove medium by pipetting.
3. Suspend cells in 900 μl Fetal calf serum (FCS).
4. Using scrapper, scrape the adherent cells.
5. Add 100 μl of freezing medium (Dimethyl sulfoxide), and Pipette up and down to ensure even mixture and
aliquot about 1ml into cryovial.
6. Put the cryovial in cryovial container in order to freezer.
7. Transfer cells immediately freezer.
Preparing Lysates–Mini Kit
Mammalian Cells Lysate
1. Set a water bath or heat block at 55°C.
2. Remove 500 μl of the growth medium from the culture plate and harvest cells by scraping. And transfer
100 μl into a new well with fresh 2ml media for passaging, transfer the rest into an Eppendorf tube.
3. Spin down by minifuge for 1 minute, and remove the supernatant.
4. Resuspend the cells from Step 2 in 200 μl PBS.
5. Add 20 μL Proteinase K to the sample.
6. Add 20 μL RNase A to the sample, mix well by brief vortexing, and incubate at room temperature for 2
minutes.
7. Add 200 μL PureLinkR Genomic Lysis/Binding Buffer and mix well by vortexing to obtain a homogenous
solution.
8. Incubate at 55°C for 10 minutes to promote protein digestion.
9. Add 200 μL 96–100% ethanol to the lysate. Mix well by vortexing for 5 seconds to yield a homogenous
solution.
10. Proceed immediately to Binding DNA.
Purification Procedure Using Spin Columns:
Binding DNA
1. Remove a PureLinkR Spin Column in a Collection Tube from the package.
Paraphrase This Document
Need a fresh take? Get an instant paraphrase of this document with our AI Paraphraser
2. Add the lysate (~640 μL) prepared with PureLinkR Genomic Lysis/Binding Buffer and ethanol to the
PureLinkR Spin Column.
3. Centrifuge the column at 10,000 × g for 1 minute at room temperature.
4. Discard the flow through and place the spin column into the same PureLinkR Collection Tube supplied with
the kit.
5. Proceed to Washing DNA.
Washing DNA
1. Add 500 μL Wash Buffer 1 prepared with ethanol (page 23) to the column.
2. Centrifuge column at room temperature at 10,000 × g for 1 minute.
3. Discard the flow throughand place the spin column into the same PureLinkR collection tube supplied with
the kit.
4. Add 500 μL Wash Buffer 2 prepared with ethanol (page 23) to the column.
5. Centrifuge the column at maximum speed for 3 minutes at room temperature. And Discard the flow
through.
6. Spin again at maximum speed for 1 minute, and discard the collection tube.
7. Proceed to Eluting DNA.
Eluting DNA
1. Place the spin column in a new collection tube.
2. Add 25μL of sterile MQW water to the column.
3. Incubate at room temperature for 1 minute. Centrifuge the column at maximum speed for 1 minute at
room temperature. The tube contains purifiedgenomic DNA.
4. Perform a second elution step using the same elution buffer volume as first elution into the same sterile
collection tube.
5. Centrifuge the column at maximum speed for 2 minutes at room temperature.
6. Transfer the purified genomic DNA into a new Eppendorf tube.
DNA Quantification:
By using Nanodrops, the DNA can be quantified as well as knowing the level of Protein and RNA contamination,
which referred to by following:
- 260/230 ratio: indicator of RNA contamination (if less than 1.8).
- 260/280 ratio: indicator of protein contamination (if less than 1.8).
Method:
1) Clickonthe“NucleicAcid”buttonintheNanoDropsoftware.
2) Add2μlofpurifiedwater tothelowerpedestal,thenlowertheupperarm.
3) Click“Okay”onthecomputerandwaitthe click sound.
4) Whenit’sdone,lifttheupperarmanddrythepedestalwithawipe.
5) Blank by adding 2 μl sterile water (MQW), which should be as same as that used in DNA suspension.
6) LowertheupperarmoftheNanoDropandclickthe“Blank”buttononthesoftware.
7) Waitfortheblankmeasurementtobemade.
8) Whenit’sdone,lifttheupperarmanddrythepedestalwithawipe.
9) Measurethesample by Adding2μlofthesampletothelowerpedestal,thenlowertheupperarm.
10) Collectthedata.
11) Add2μlofpurifiedwatertothelowerpedestal,thenlowerthearm. Lifttheupperarmanduseawipetoscrubboththe
upperandlower pedestals.
Agarose Gel Electrophoresis
Background Information
Gel electrophoresis is the standard lab procedure for separating DNA by size (e.g., length in base pairs) for
visualization and purification. Electrophoresis uses an electrical field to move the negatively charged DNA
through an agarose gel matrix toward a positive electrode. Shorter DNA fragments migrate through the
gel more quickly than longer ones. Thus, you can determine the approximate length of a DNA fragment by
running it on an agarose gel alongside a DNA ladder (a collection of DNA fragments of known lengths).
Protocol: Gel Electrophoresis
PREPARING a 2% AGAROSE GEL:
1. Measure 2 g of agarose.
2. Mix agarose powder with 100 mL 1xTAE in a microwavable flask.
Note: Make sure to use the same buffer as the one in the gel box (do not mix different
buffers and do not use water).
3. Microwave for 1-3 min until the agarose is completely dissolved (BETTER TO microwave for
1MINUTE, stop and swirl, and then continue towards a boil).
4. Let agarose solution cool down (about 6 mins).
5. Add ethidium bromide (EtBr) to a final concentration of approximately 10 μg for 100 mL (or 5μl for
50 mL). EtBr binds to the DNA and allows you to visualize the DNA under ultraviolet (UV) light.
(EtBr is a known mutagen).
6. Pour the agarose into a gel tray with the well comb in place.
Note: Pour slowly to avoid bubbles which will disrupt the gel. Any bubbles can be pushed away
with a pipette tip.
7. Place newly poured gel at room temperature for 20 mins, until it has completely solidified.
Loading Samples and Running an Agarose Gel:
1. Once solidified, place the agarose gel into the gel box (electrophoresis unit).
2. Fill gel box with 1xTAE until the gel is covered.
3. By using parafilm, Add: (2 μl loading dye + 5 μl Sample DNA + 5 μl Water), which every sample
should equal 12 μl.
4. Carefully load 5 μlof the ladder into the first lane of the gel.
5. Carefully load 12 μl samples into the additional wells of the gel.
6. Run the gel at 100 V until the dye line is approximately 75-80% (approx.1 hour) of the way down
the gel.
Note: Black is negative, red is positive. (The DNA is negatively charged and will run towards
the positive electrode.) Always Run to Red.
Note: A typical run time is about 1-1.5 hours, depending on the gel concentration and voltage.
7. Carefully remove the gel from the gel box.
8. Using any device that has UV light, visualize your DNA fragments and analyse bands comparing to
the DNA ladder as a guide of the size of each band.
POLYMERASE CHAIN REACTION
The Polymerase Chain Reaction (PCR) is an in vitro method for the selective amplification of a fragment of
double-stranded nucleic acid (DNA-DNA or RNA- cDNA). PCR amplification of nucleic acid (figure 1)
employs two short lengths of single-stranded DNA, oligonucleotide primers, chosen from the sequence of
the genome under investigation, the target DNA. The distance between these two primers determines
the size of the amplified product (amplicon). When the target double-stranded DNA is heated to a high
⊘ This is a preview!⊘
Do you want full access?
Subscribe today to unlock all pages.
Trusted by 1+ million students worldwide
temperature (90-95oC), the two strands separate (denature). Reduction of the temperature allows the
oligonucleotide primers to "stick" (anneal) to a complementary sequence on the target DNA, one on each
strand. A DNA polymerase enzyme then induces the synthesis of new strands of DNA, extending the
annealed primers by the addition of free deoxynucleotide triphosphates. Repetition of this cycle of
denaturation, annealing and synthesis (extension) 25 times may produce more than 100,000 copies of a
single target DNA molecule, the number of copies of DNA being duplicated every cycle.
PCR PROTOCOL
Materials provided
- DNA (prepared earlier)
- Components of PCR reaction mixture
- 10x PCR buffer
- 10mM deoxynucleotide triphosphate mixture (dNTP)
- 20μM primer #1
- 20μM primer #2
- Amplitaq Gold® DNA polymerase
- Ultrapure sterile distilled water
Method
1- Determine the added DNA and add H2O to achieve the final volume 16.7 by using the DNA
concentration as following:
DNA added = DNA needed (1000ng/μl) / DNA concentration =…….
Then, add water to reach 16.7 μl
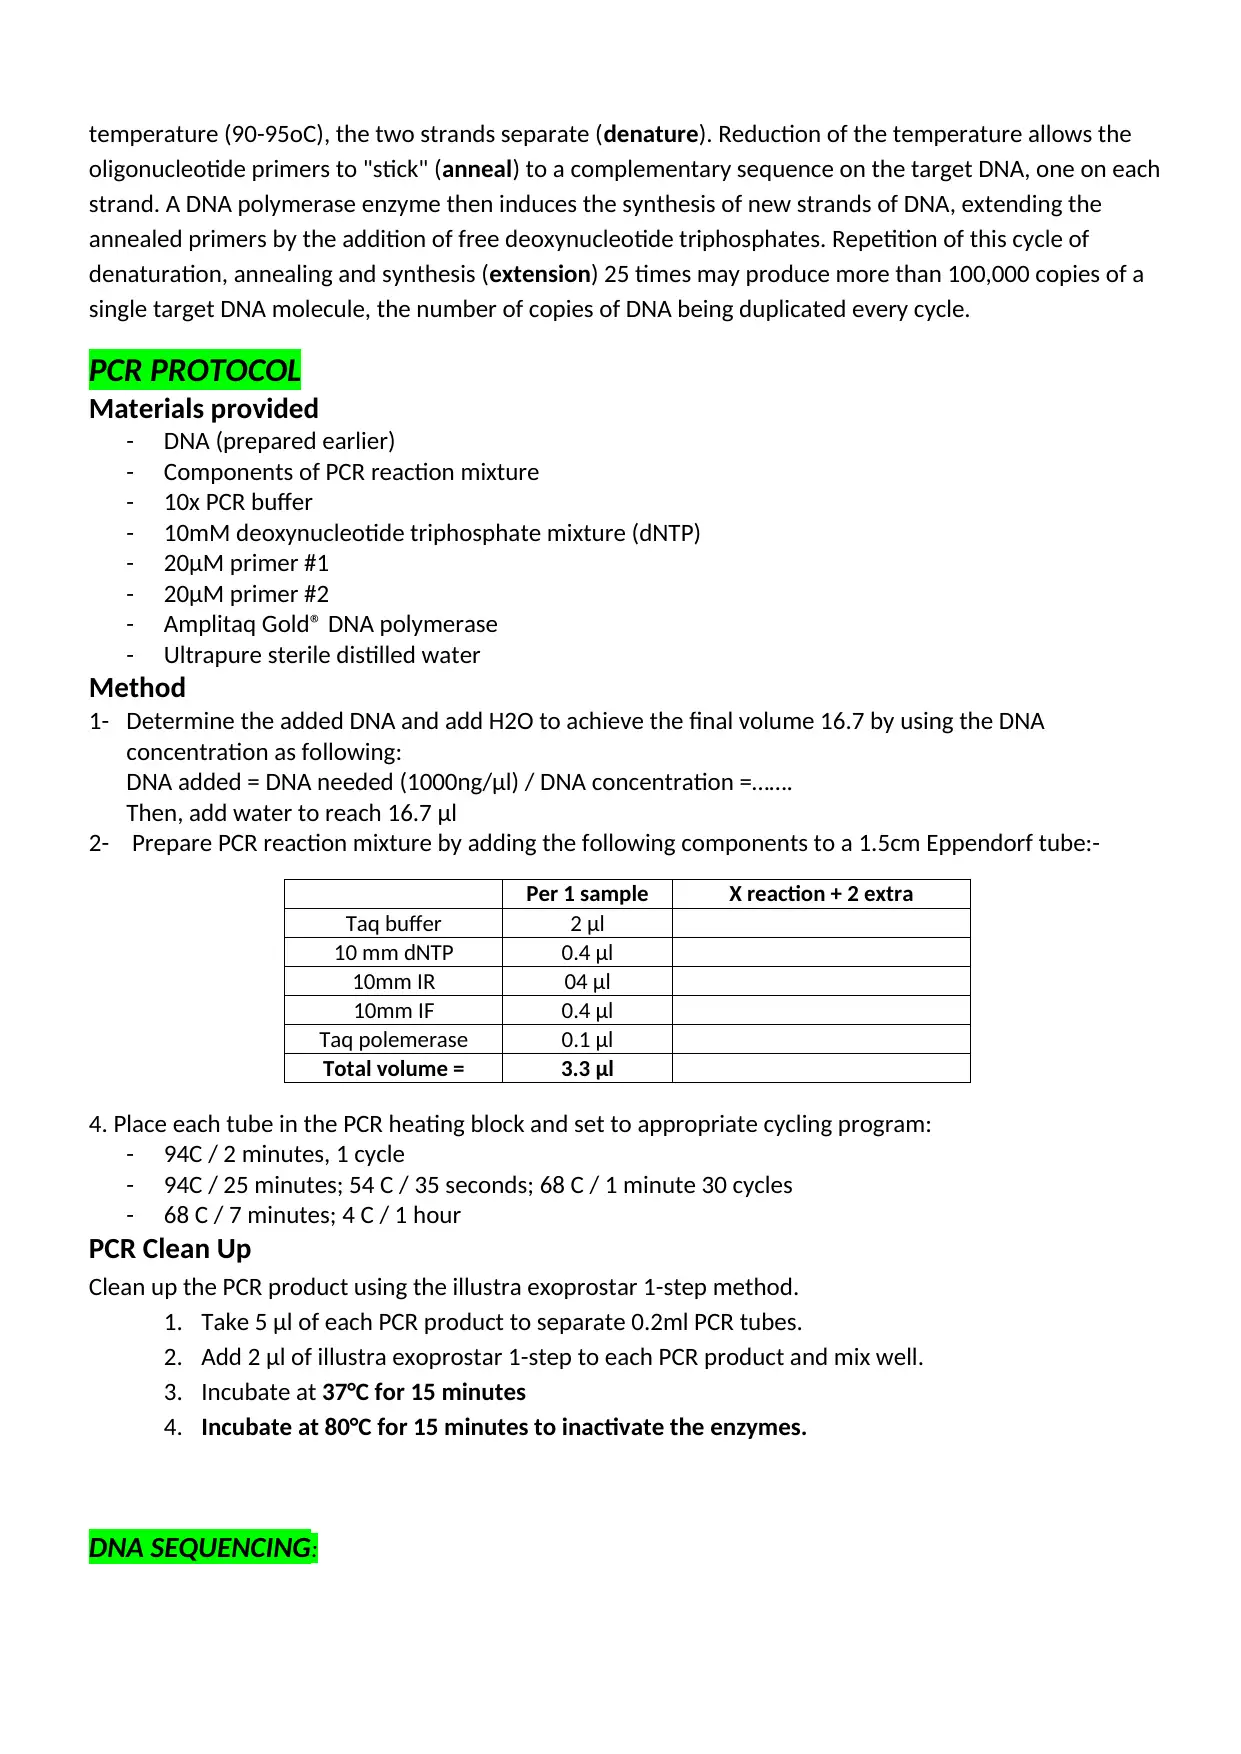
2- Prepare PCR reaction mixture by adding the following components to a 1.5cm Eppendorf tube:-
Per 1 sample X reaction + 2 extra
Taq buffer 2 μl
10 mm dNTP 0.4 μl
10mm IR 04 μl
10mm IF 0.4 μl
Taq polemerase 0.1 μl
Total volume = 3.3 μl
4. Place each tube in the PCR heating block and set to appropriate cycling program:
- 94C / 2 minutes, 1 cycle
- 94C / 25 minutes; 54 C / 35 seconds; 68 C / 1 minute 30 cycles
- 68 C / 7 minutes; 4 C / 1 hour
PCR Clean Up
Clean up the PCR product using the illustra exoprostar 1-step method.
1. Take 5 μl of each PCR product to separate 0.2ml PCR tubes.
2. Add 2 μl of illustra exoprostar 1-step to each PCR product and mix well.
3. Incubate at 37°C for 15 minutes
4. Incubate at 80°C for 15 minutes to inactivate the enzymes.
DNA SEQUENCING:
oligonucleotide primers to "stick" (anneal) to a complementary sequence on the target DNA, one on each
strand. A DNA polymerase enzyme then induces the synthesis of new strands of DNA, extending the
annealed primers by the addition of free deoxynucleotide triphosphates. Repetition of this cycle of
denaturation, annealing and synthesis (extension) 25 times may produce more than 100,000 copies of a
single target DNA molecule, the number of copies of DNA being duplicated every cycle.
PCR PROTOCOL
Materials provided
- DNA (prepared earlier)
- Components of PCR reaction mixture
- 10x PCR buffer
- 10mM deoxynucleotide triphosphate mixture (dNTP)
- 20μM primer #1
- 20μM primer #2
- Amplitaq Gold® DNA polymerase
- Ultrapure sterile distilled water
Method
1- Determine the added DNA and add H2O to achieve the final volume 16.7 by using the DNA
concentration as following:
DNA added = DNA needed (1000ng/μl) / DNA concentration =…….
Then, add water to reach 16.7 μl
2- Prepare PCR reaction mixture by adding the following components to a 1.5cm Eppendorf tube:-
Per 1 sample X reaction + 2 extra
Taq buffer 2 μl
10 mm dNTP 0.4 μl
10mm IR 04 μl
10mm IF 0.4 μl
Taq polemerase 0.1 μl
Total volume = 3.3 μl
4. Place each tube in the PCR heating block and set to appropriate cycling program:
- 94C / 2 minutes, 1 cycle
- 94C / 25 minutes; 54 C / 35 seconds; 68 C / 1 minute 30 cycles
- 68 C / 7 minutes; 4 C / 1 hour
PCR Clean Up
Clean up the PCR product using the illustra exoprostar 1-step method.
1. Take 5 μl of each PCR product to separate 0.2ml PCR tubes.
2. Add 2 μl of illustra exoprostar 1-step to each PCR product and mix well.
3. Incubate at 37°C for 15 minutes
4. Incubate at 80°C for 15 minutes to inactivate the enzymes.
DNA SEQUENCING:
Paraphrase This Document
Need a fresh take? Get an instant paraphrase of this document with our AI Paraphraser

Sanger sequencing, also known as chain-termination sequencing or dideoxy sequencing is based on the
detection of labelled chain-terminating nucleotides that are incorporated by a DNA polymerase during
the replication of a template.
detection of labelled chain-terminating nucleotides that are incorporated by a DNA polymerase during
the replication of a template.
1 out of 11

Your All-in-One AI-Powered Toolkit for Academic Success.
+13062052269
info@desklib.com
Available 24*7 on WhatsApp / Email
![[object Object]](/_next/static/media/star-bottom.7253800d.svg)
Unlock your academic potential
Copyright © 2020–2026 A2Z Services. All Rights Reserved. Developed and managed by ZUCOL.