Statistical Analysis of Unemployment in Philadelphia Study Report

Verified

Added on  2020/04/13

|6
|680
|232
Homework Assignment
AI Summary
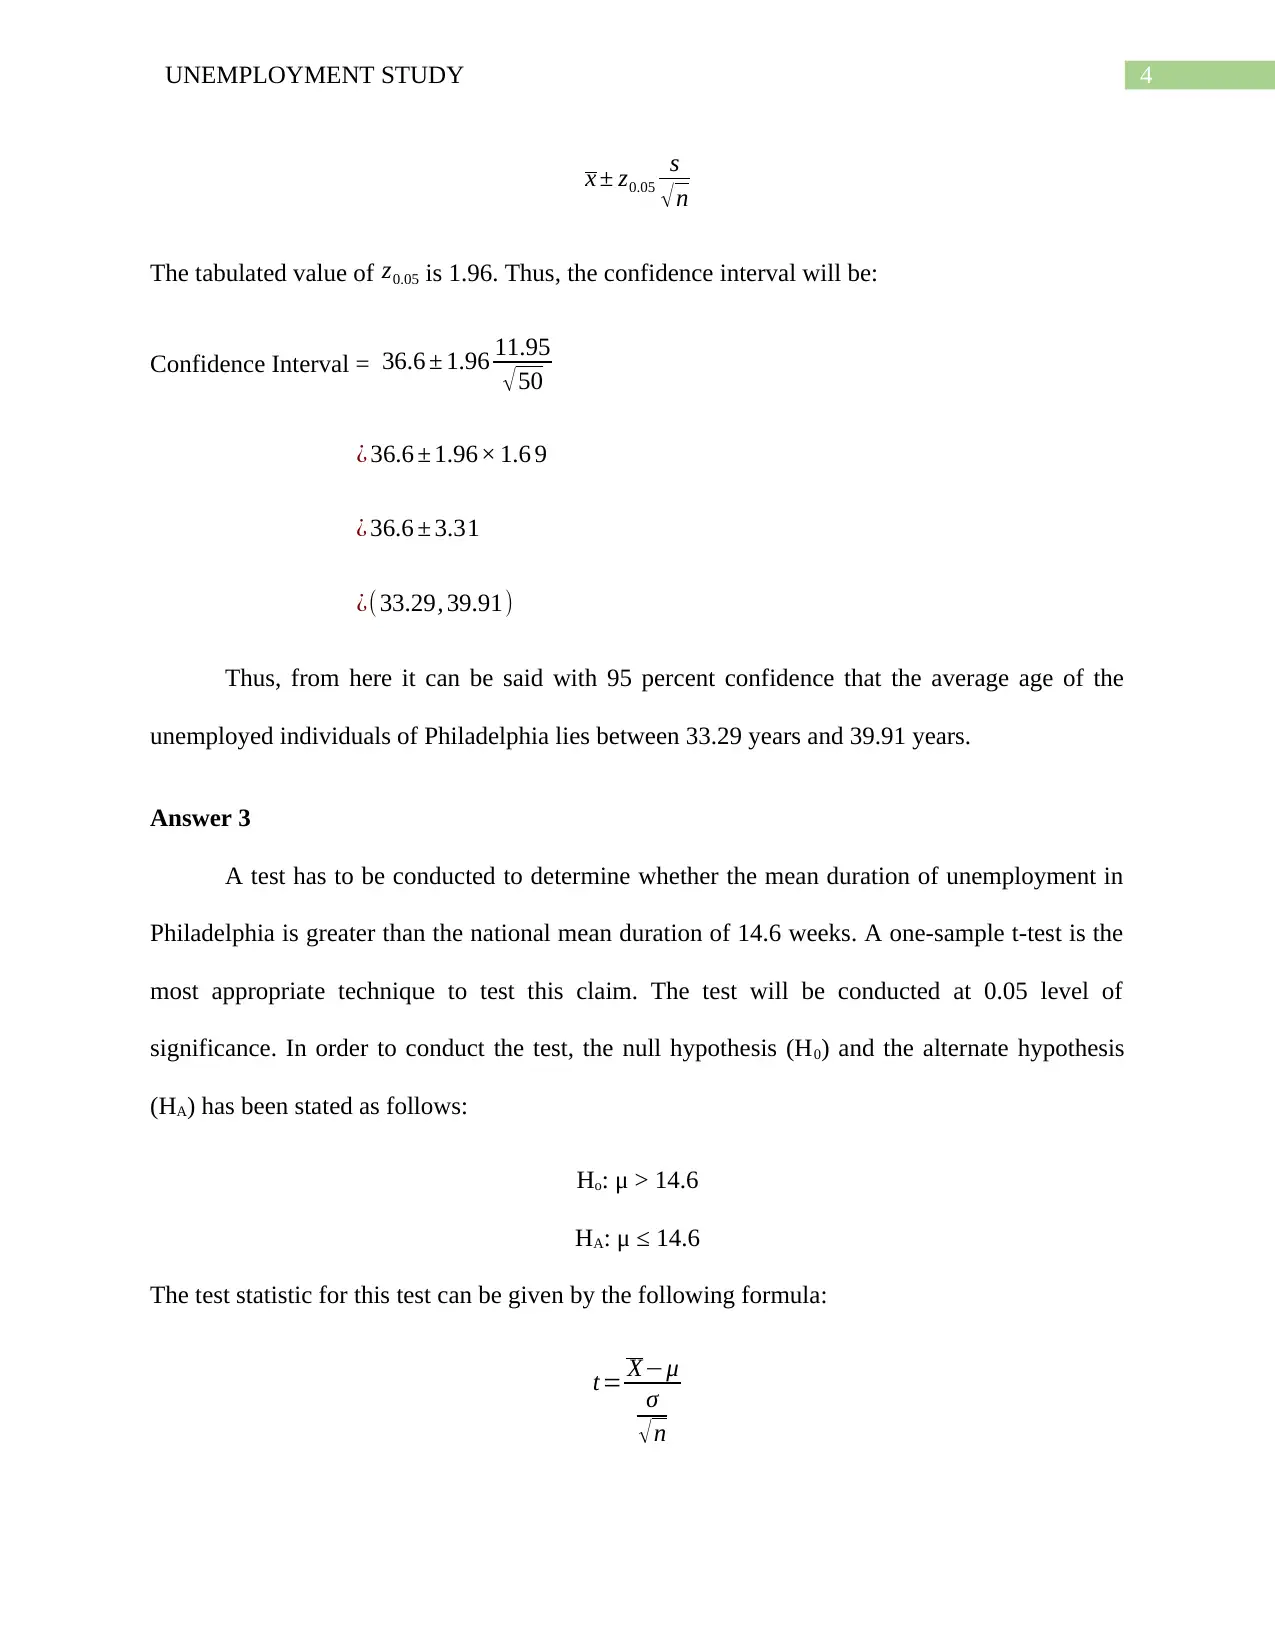
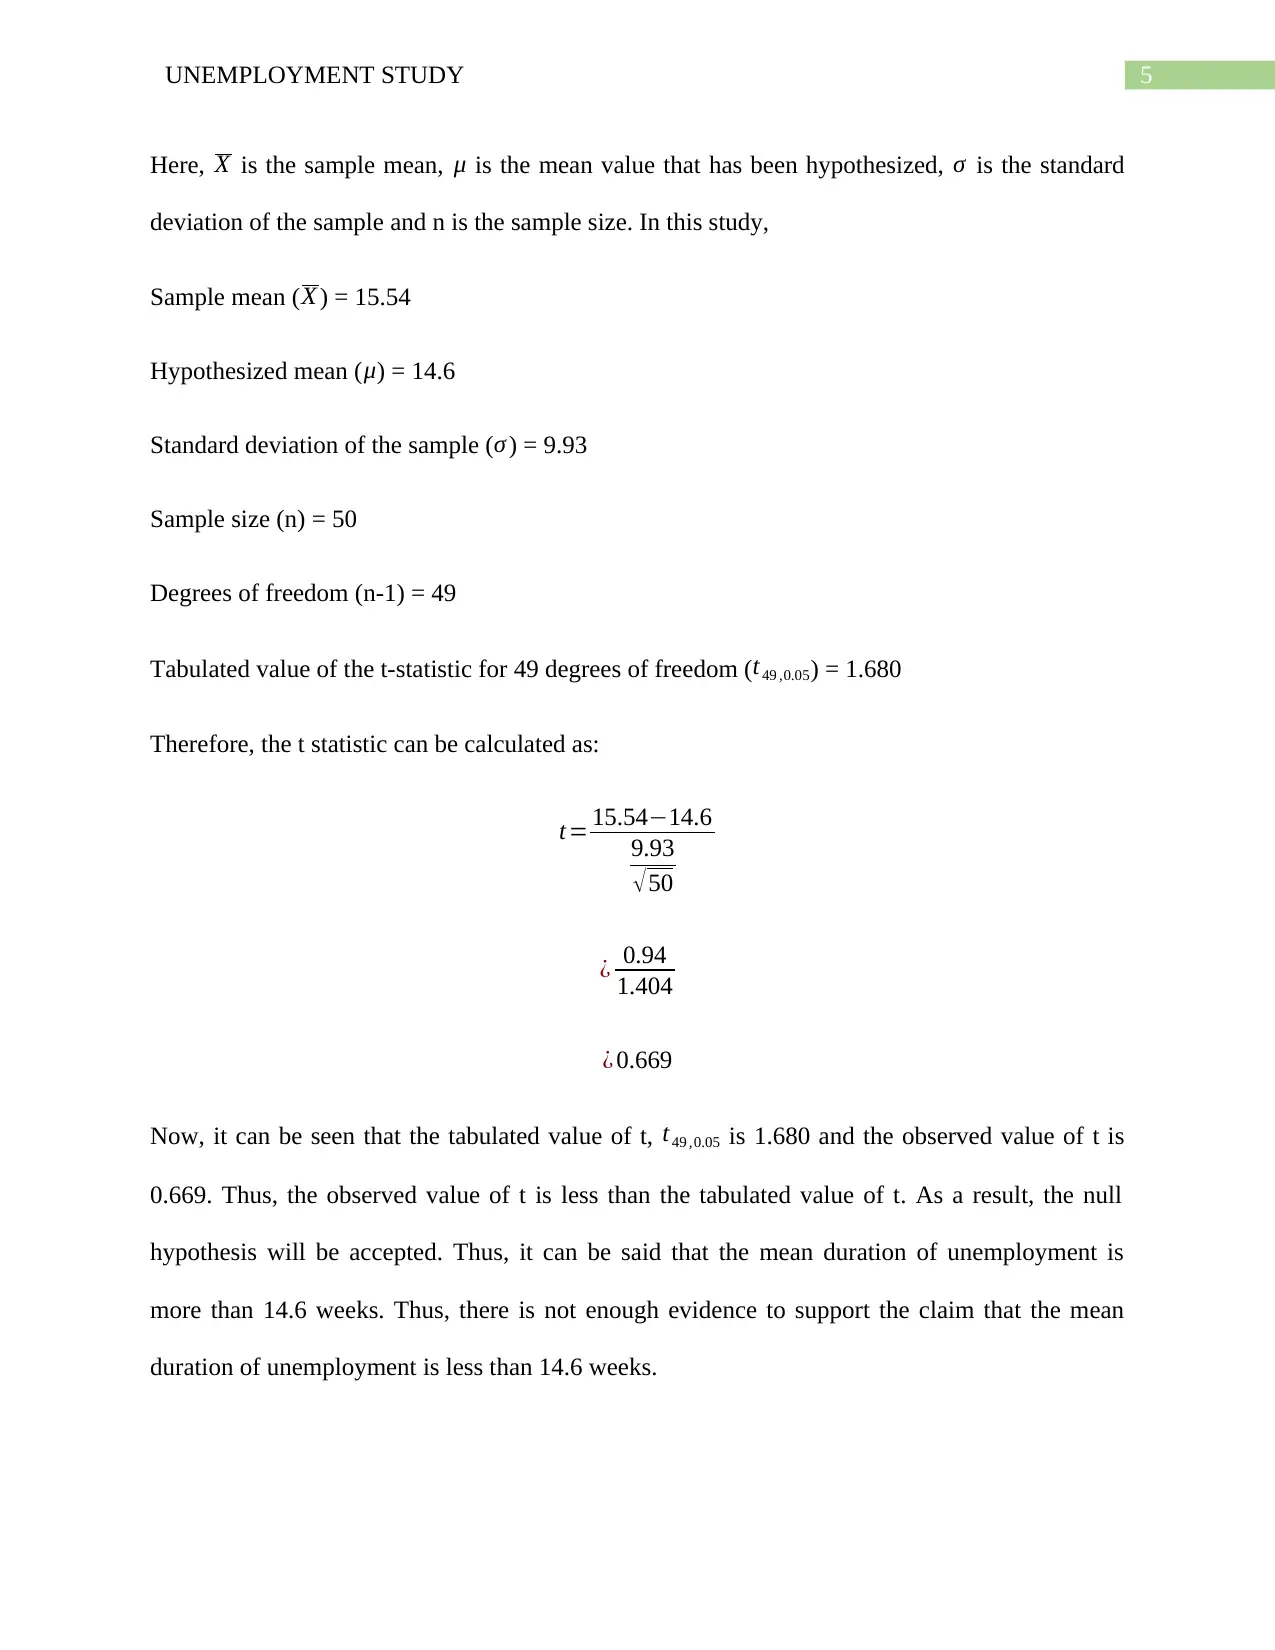
This homework assignment presents a statistical analysis of an unemployment study conducted in Philadelphia. The study examines the age and duration of unemployment among a sample of 50 individuals. The analysis includes descriptive statistics, such as mean, median, mode, standard deviation, and quartiles, revealing a positively skewed distribution for both age and weeks of unemployment. A 95% confidence interval for the population mean age is calculated. Furthermore, a one-sample t-test is performed to determine if the mean duration of unemployment in Philadelphia is greater than the national mean. The results indicate that the mean duration is indeed greater than the national average. The assignment utilizes tables, figures, and statistical formulas to present and interpret the data effectively, providing valuable insights into the unemployment situation in Philadelphia. The assignment is available on Desklib, a platform providing study resources for students.
Document Page
Running Head: UNEMPLOYMENT STUDY
Unemployment Status
Name of the Student
Name of the University
Author Note
tabler-icon-diamond-filled.svg

Paraphrase This Document

Need a fresh take? Get an instant paraphrase of this document with our AI Paraphraser
Document Page
1UNEMPLOYMENT STUDY
Answer 1
From the results in table 1, it can be said that the average age of the sample of 50
unemployed people of Philadelphia selected for thus study is 36.6 years and the average duration
of unemployment is 15.54 weeks. For the variables age and weeks of unemployment, mean is
greater than the median which is again greater than the mode. Thus, it can be said that the
distribution of values is positively skewed. This implies that most of the unemployed individuals
are less than 36.6 years and are unemployed for less than 15.54 weeks. 50 percent of the
unemployed individuals are between 26.25 years and 45 years and are unemployed for a time
between 7.25 weeks and 19.75 weeks.
Table 1: Descriptive Statistics of Age and Weeks
Age Weeks
Mean 36.60 Mean 15.54
Standard Error 1.69 Standard Error 1.40
Median 34 Median 13.5
Mode 27 Mode 7
Standard Deviation 11.95 Standard Deviation 9.93
Sample Variance 142.69 Sample Variance 98.54
Kurtosis -1.15 Kurtosis 0.05
Skewness 0.36 Skewness 0.91
Range 39 Range 38
Minimum 20 Minimum 1
Maximum 59 Maximum 39
Sum 1830 Sum 777
Count 50 Count 50
Document Page
2UNEMPLOYMENT STUDY
Table 2: Quartiles for Age and Weeks
Quartiles: Age Weeks
First Quartile 26.25 7.25
Second Quartile 34 13.5
Third Quartile 45 19.75
Figure 1: Relation between Age and Number of Weeks of Unemployment
Document Page
3UNEMPLOYMENT STUDY
10 20 30 40 50 More
0
5
10
15
20
Histogram of Age of the Respondents
Frequency
Age
Frequency
Figure 2: Histogram of Age of Respondents
0 10 20 30 40 More
0
5
10
15
20
25
Histogram of Number of Weeks of
Unemployment
Frequency
Weeks
Frequency
Figure 2: Histogram of Number of Weeks of Unemployment
Answer 2
The mean age (x) of the sample of unemployed individuals in Philadelphia is 36.6 years
and the standard deviation (s) of the age of the sample of unemployed individuals in Philadelphia
is 11.95 years. Let n be denoted as the sample size which is 50 in this case. The confidence
interval for the population mean is given by the following formula:
tabler-icon-diamond-filled.svg

Paraphrase This Document

Need a fresh take? Get an instant paraphrase of this document with our AI Paraphraser
Document Page
4UNEMPLOYMENT STUDY
x ± z0.05
s
n
The tabulated value of z0.05 is 1.96. Thus, the confidence interval will be:
Confidence Interval = 36.6 ± 1.96 11.95
50
¿ 36.6 ± 1.96× 1.6 9
¿ 36.6 ± 3.31
¿( 33.29, 39.91)
Thus, from here it can be said with 95 percent confidence that the average age of the
unemployed individuals of Philadelphia lies between 33.29 years and 39.91 years.
Answer 3
A test has to be conducted to determine whether the mean duration of unemployment in
Philadelphia is greater than the national mean duration of 14.6 weeks. A one-sample t-test is the
most appropriate technique to test this claim. The test will be conducted at 0.05 level of
significance. In order to conduct the test, the null hypothesis (H0) and the alternate hypothesis
(HA) has been stated as follows:
Ho: μ > 14.6
HA: μ ≤ 14.6
The test statistic for this test can be given by the following formula:
t= Xμ
σ
n
Document Page
5UNEMPLOYMENT STUDY
Here, X is the sample mean, μ is the mean value that has been hypothesized, σ is the standard
deviation of the sample and n is the sample size. In this study,
Sample mean ( X ) = 15.54
Hypothesized mean ( μ) = 14.6
Standard deviation of the sample ( σ ) = 9.93
Sample size (n) = 50
Degrees of freedom (n-1) = 49
Tabulated value of the t-statistic for 49 degrees of freedom ( t49 ,0.05) = 1.680
Therefore, the t statistic can be calculated as:
t= 15.5414.6
9.93
50
¿ 0.94
1.404
¿ 0.669
Now, it can be seen that the tabulated value of t, t49 ,0.05 is 1.680 and the observed value of t is
0.669. Thus, the observed value of t is less than the tabulated value of t. As a result, the null
hypothesis will be accepted. Thus, it can be said that the mean duration of unemployment is
more than 14.6 weeks. Thus, there is not enough evidence to support the claim that the mean
duration of unemployment is less than 14.6 weeks.
chevron_up_icon
1 out of 6
circle_padding
hide_on_mobile
zoom_out_icon
[object Object]