Numeracy and Data Analysis: Phone Call Forecasting Assignment

Verified

Added on  2023/01/07

|11
|1332
|67
Homework Assignment
AI Summary
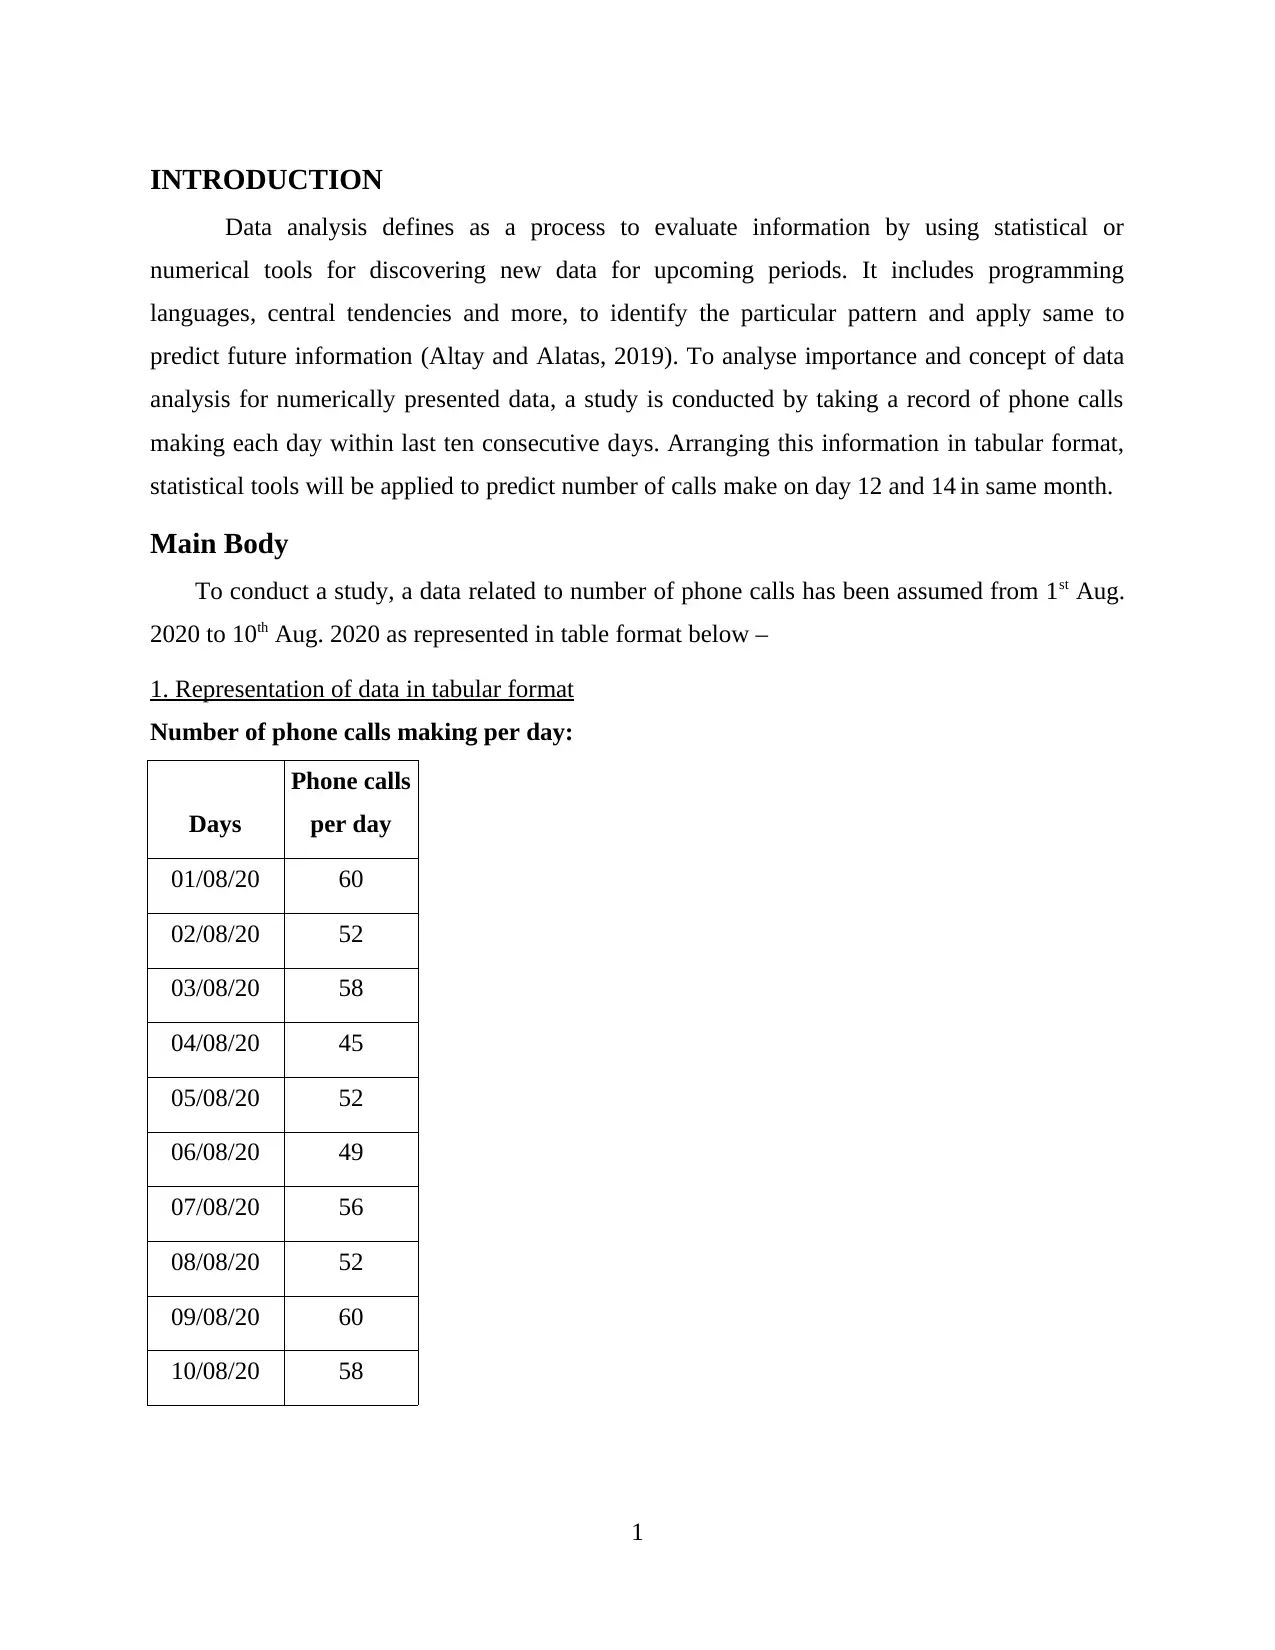
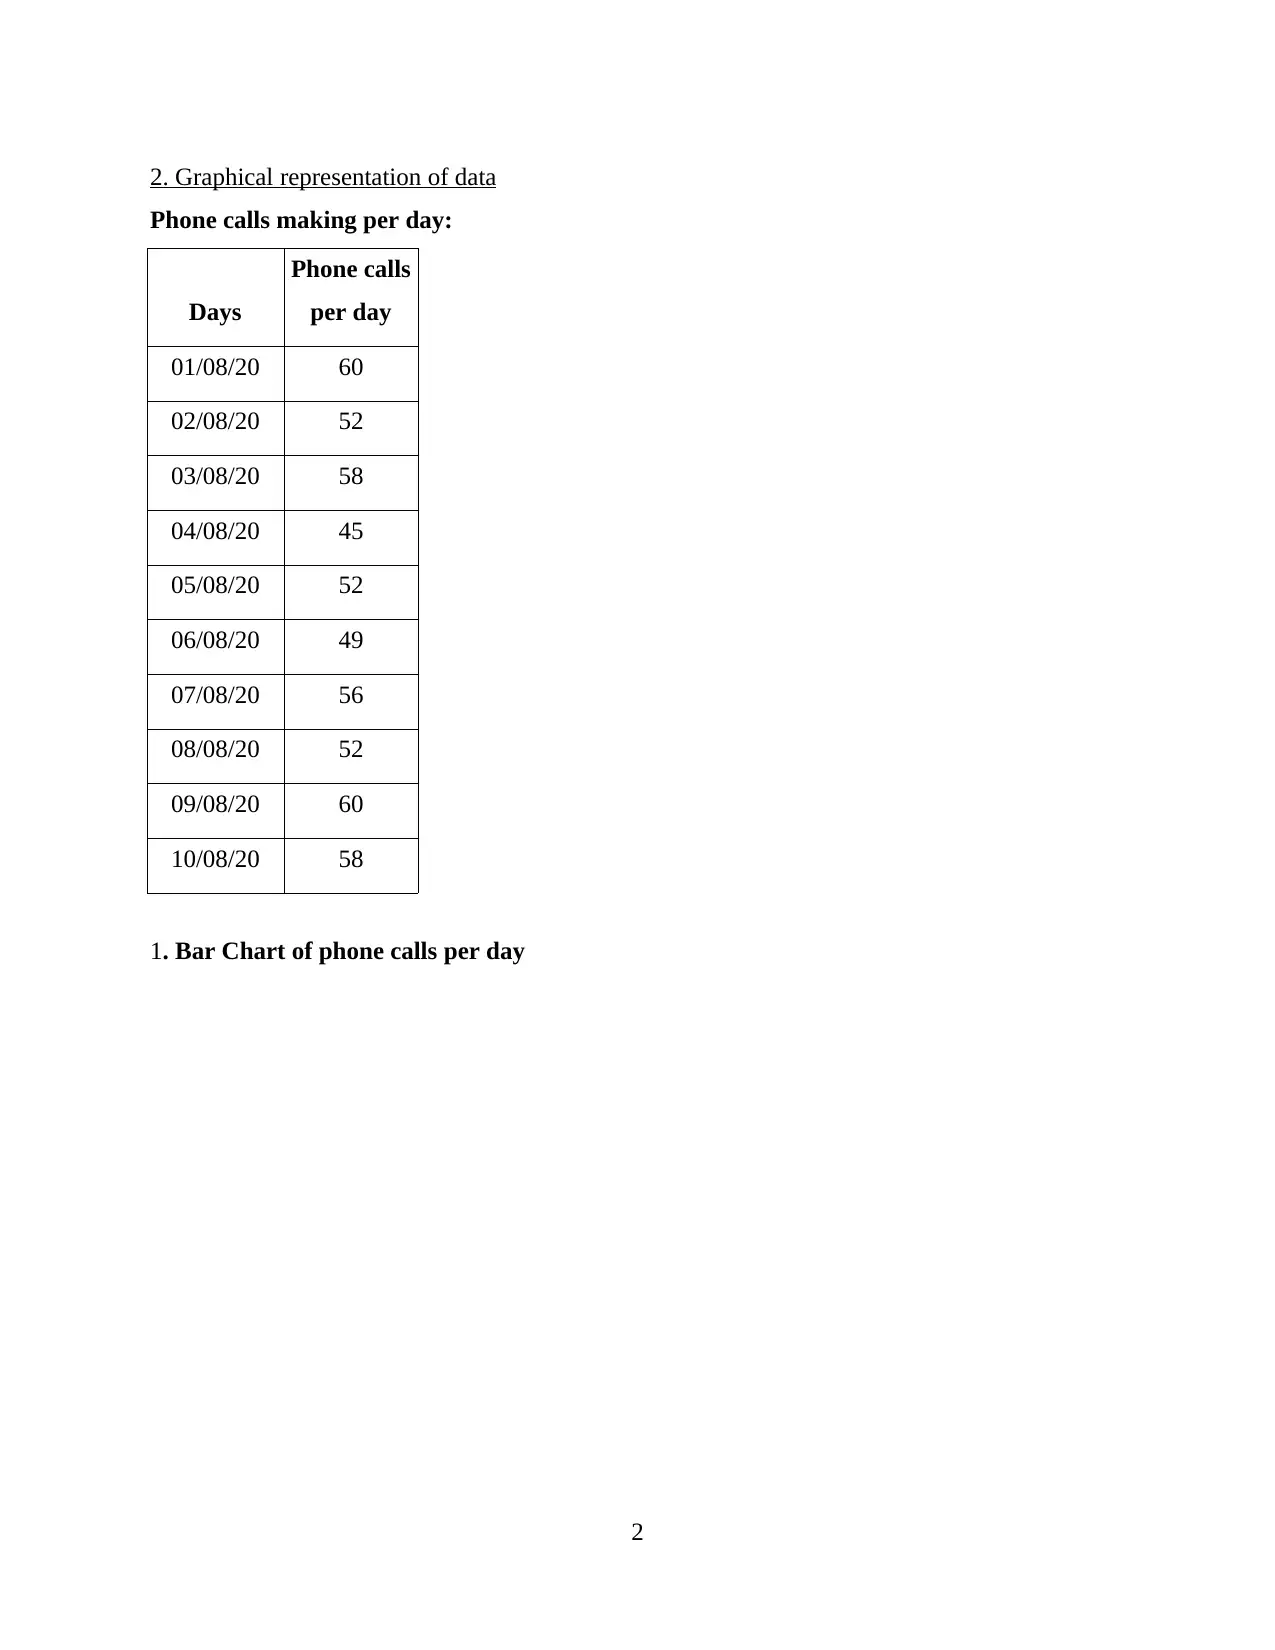
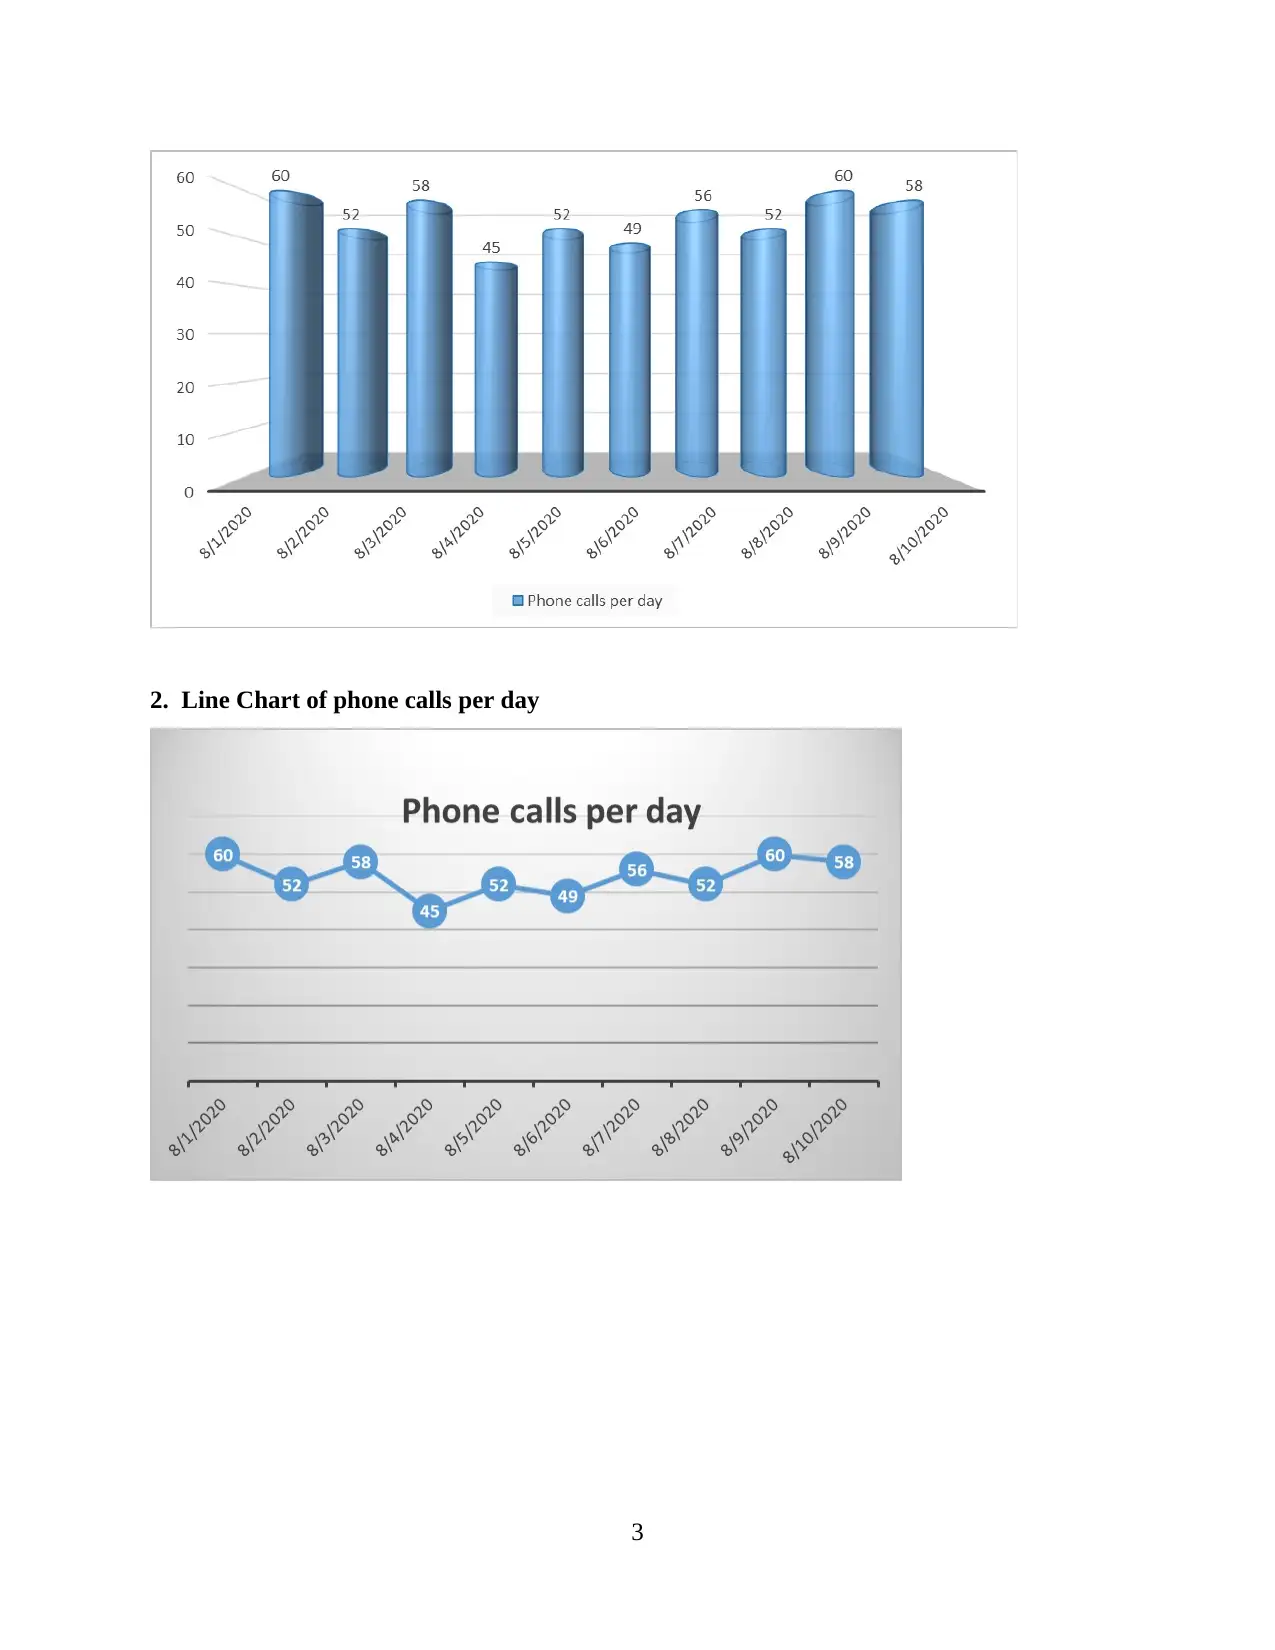
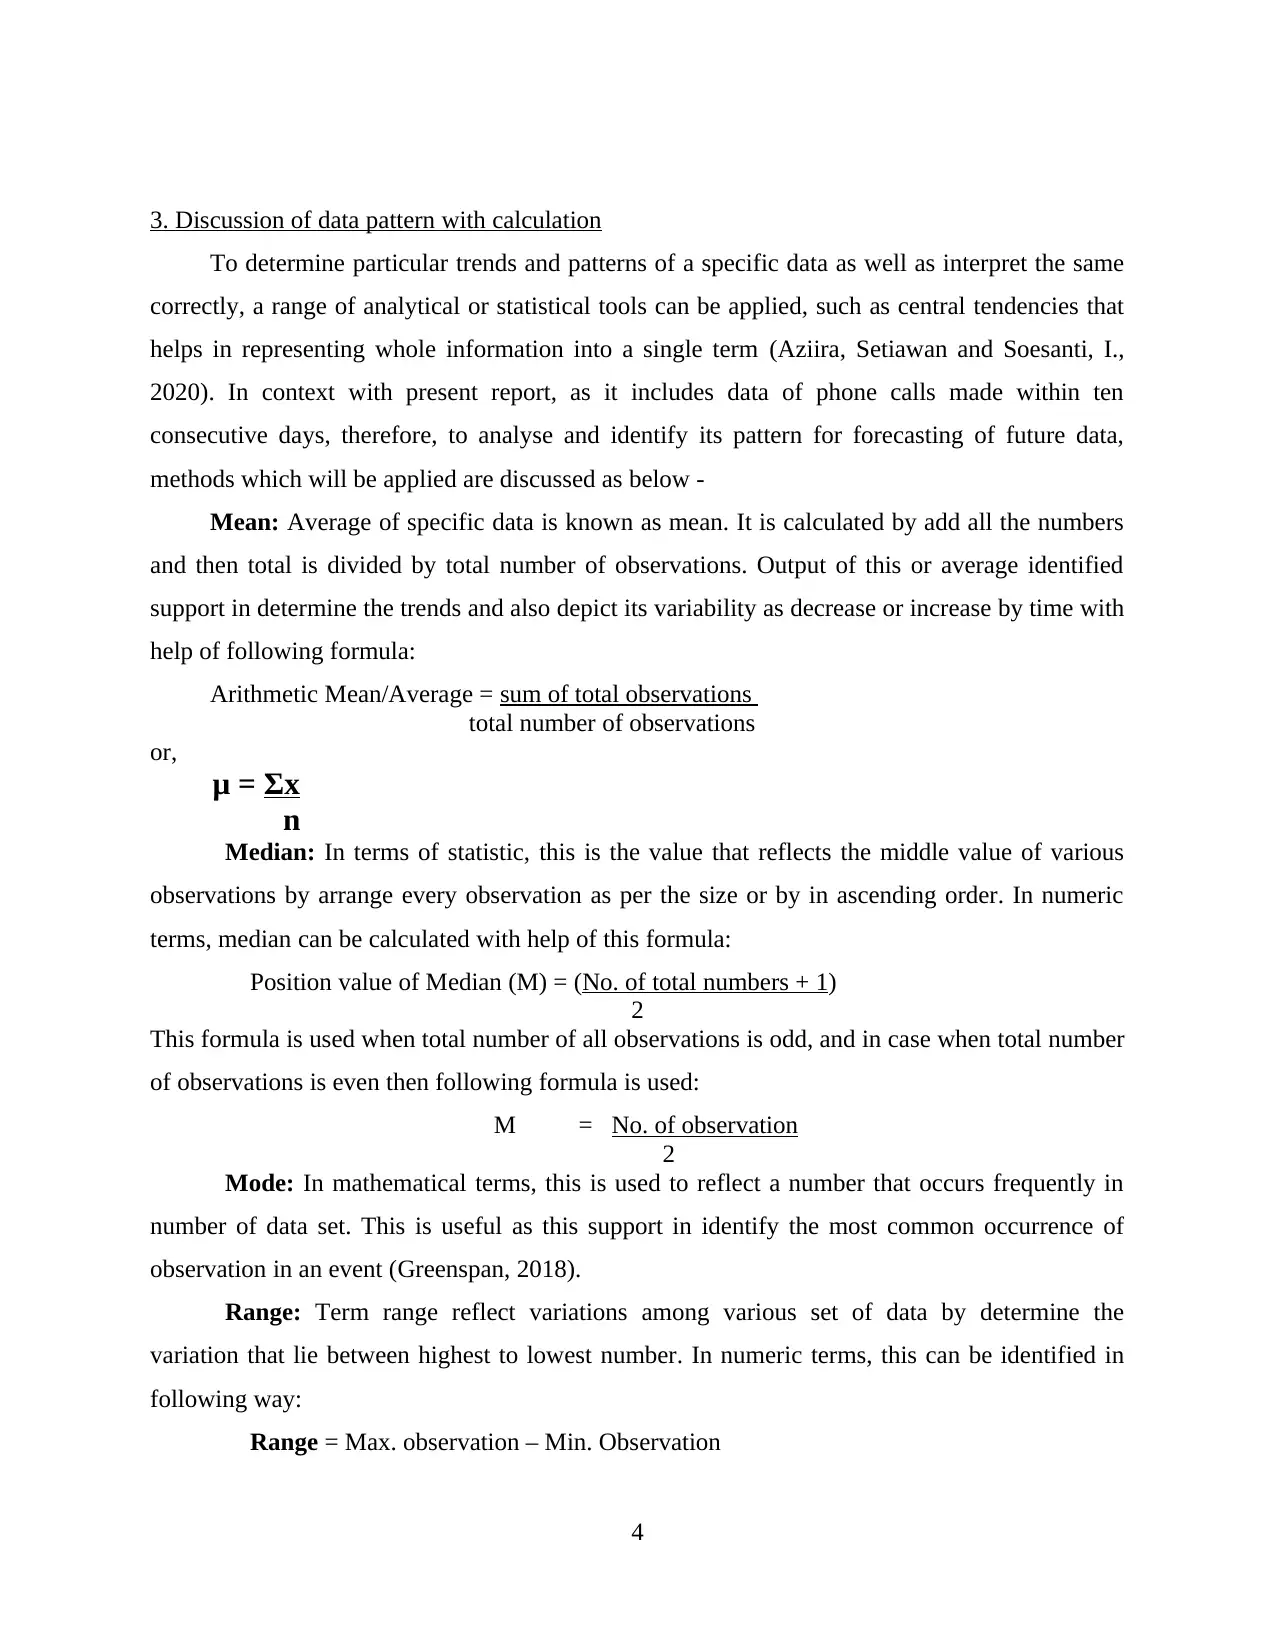
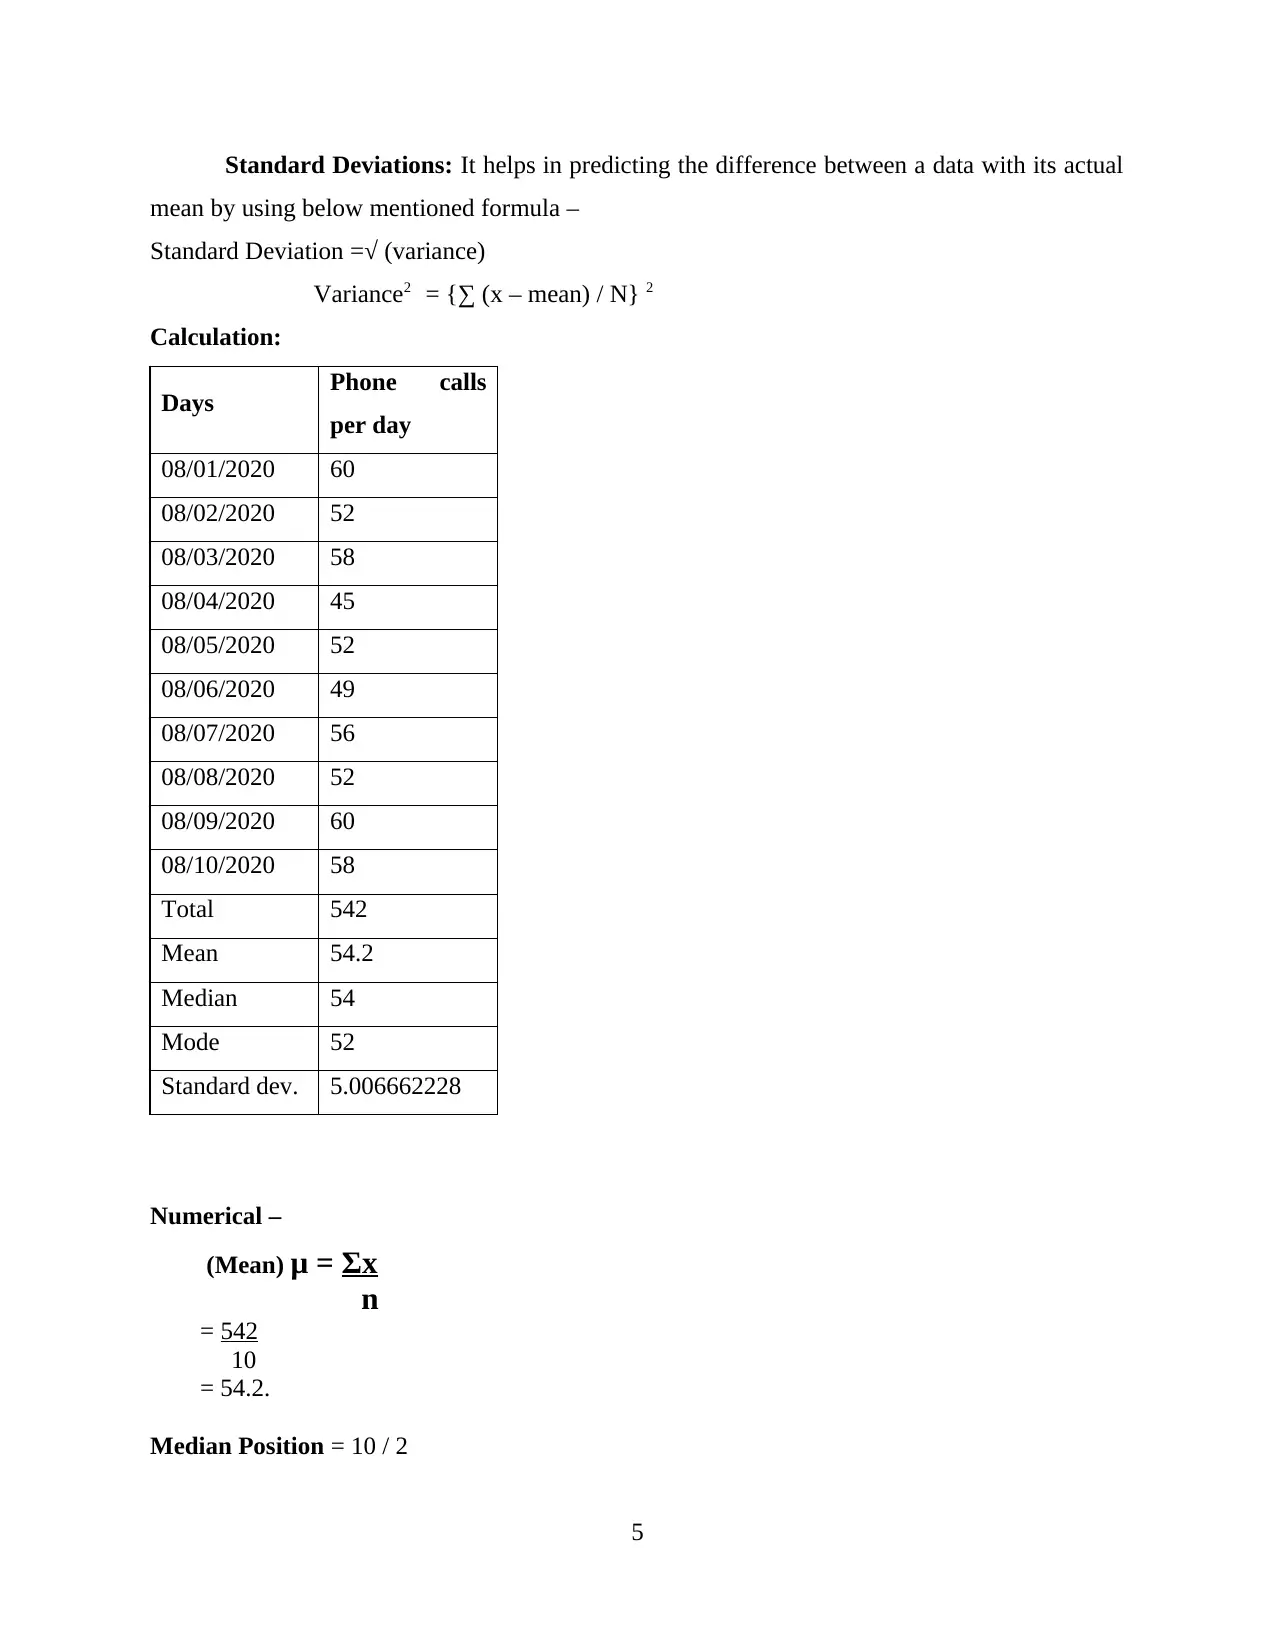
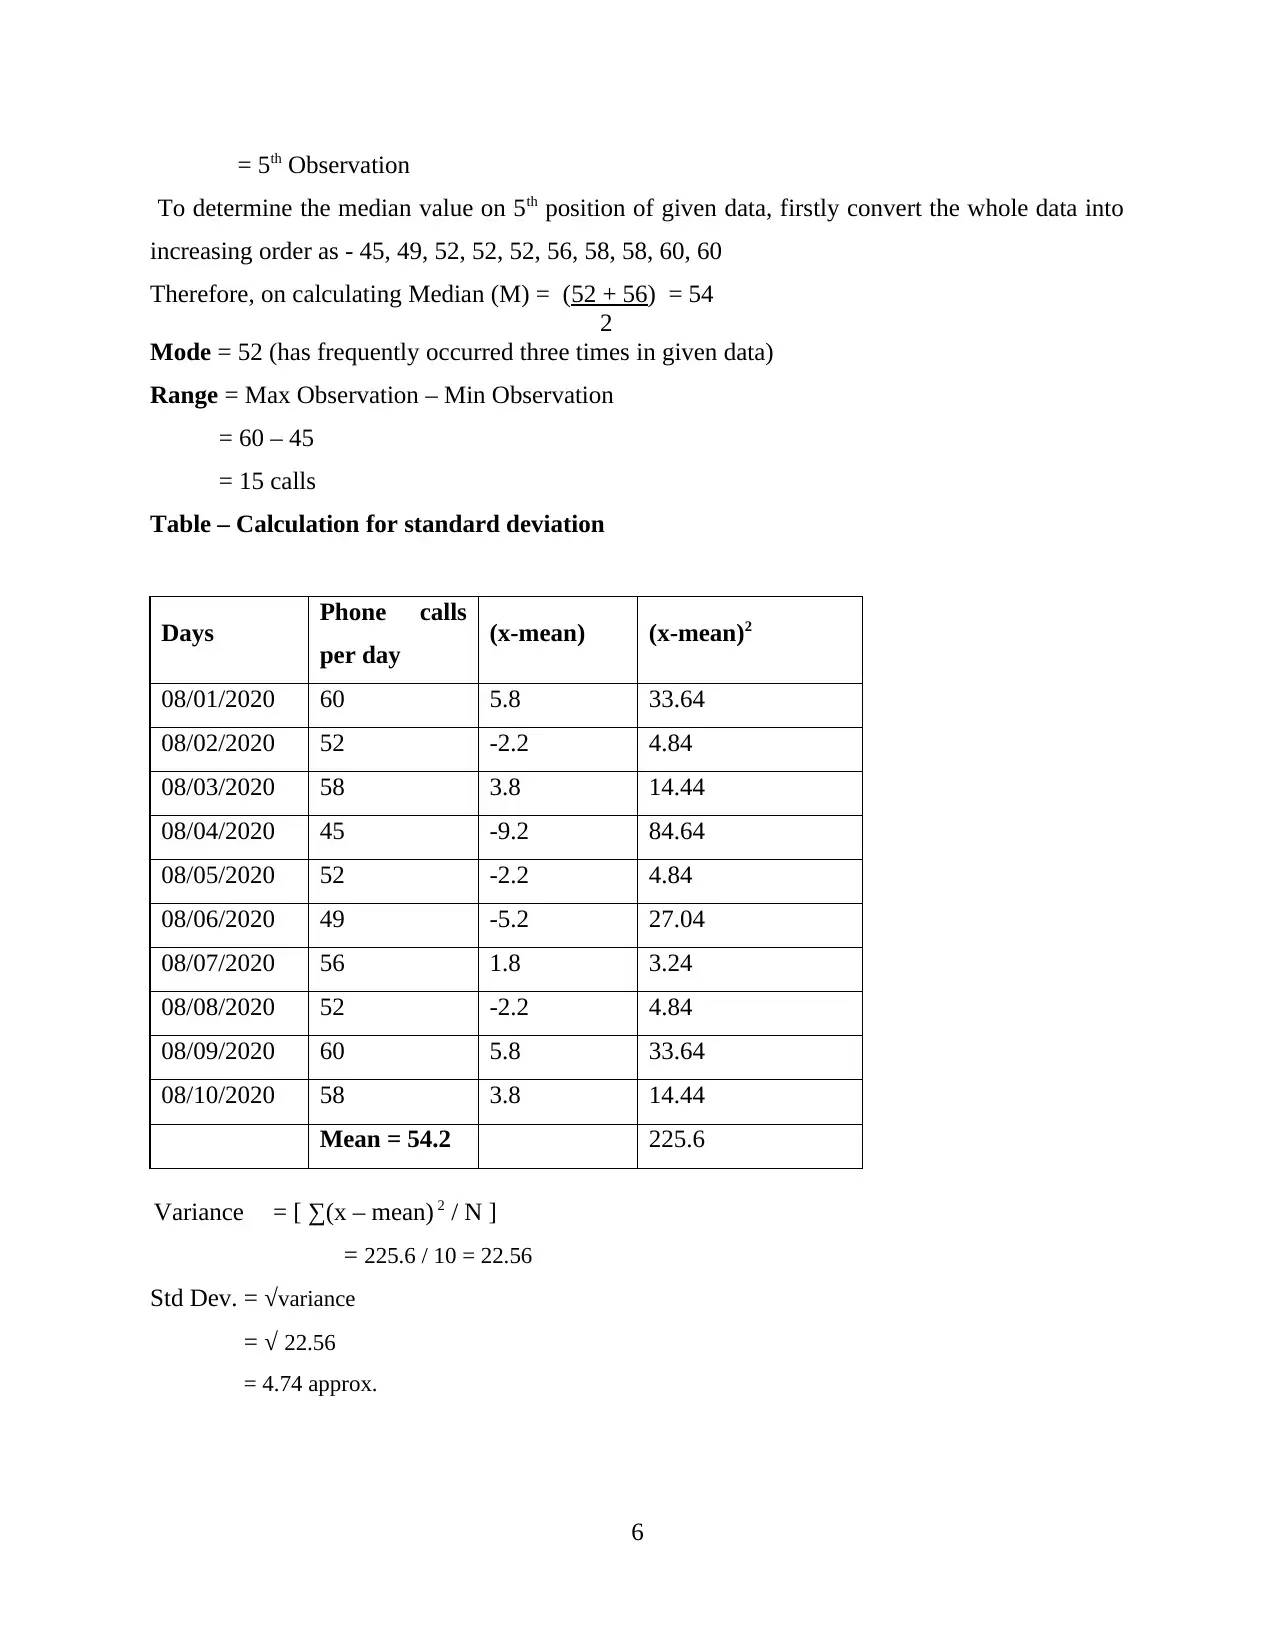
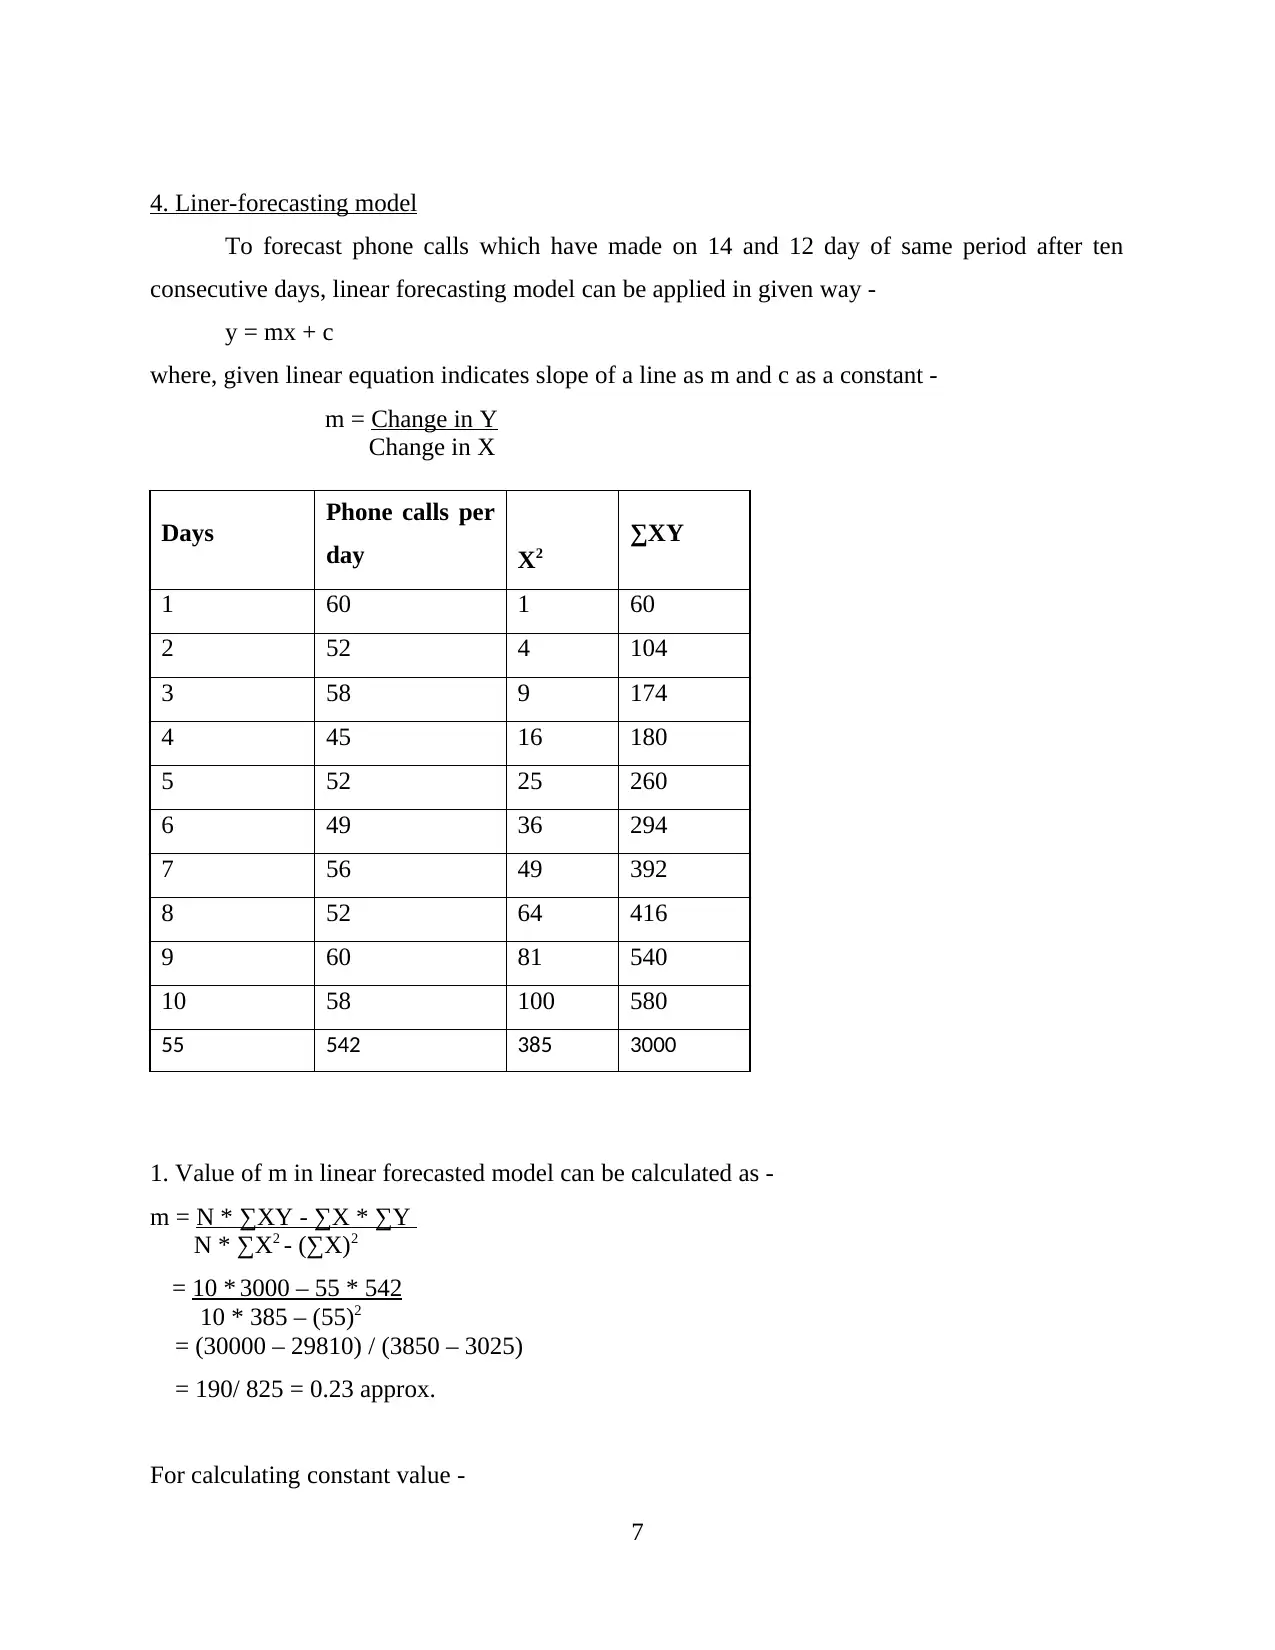
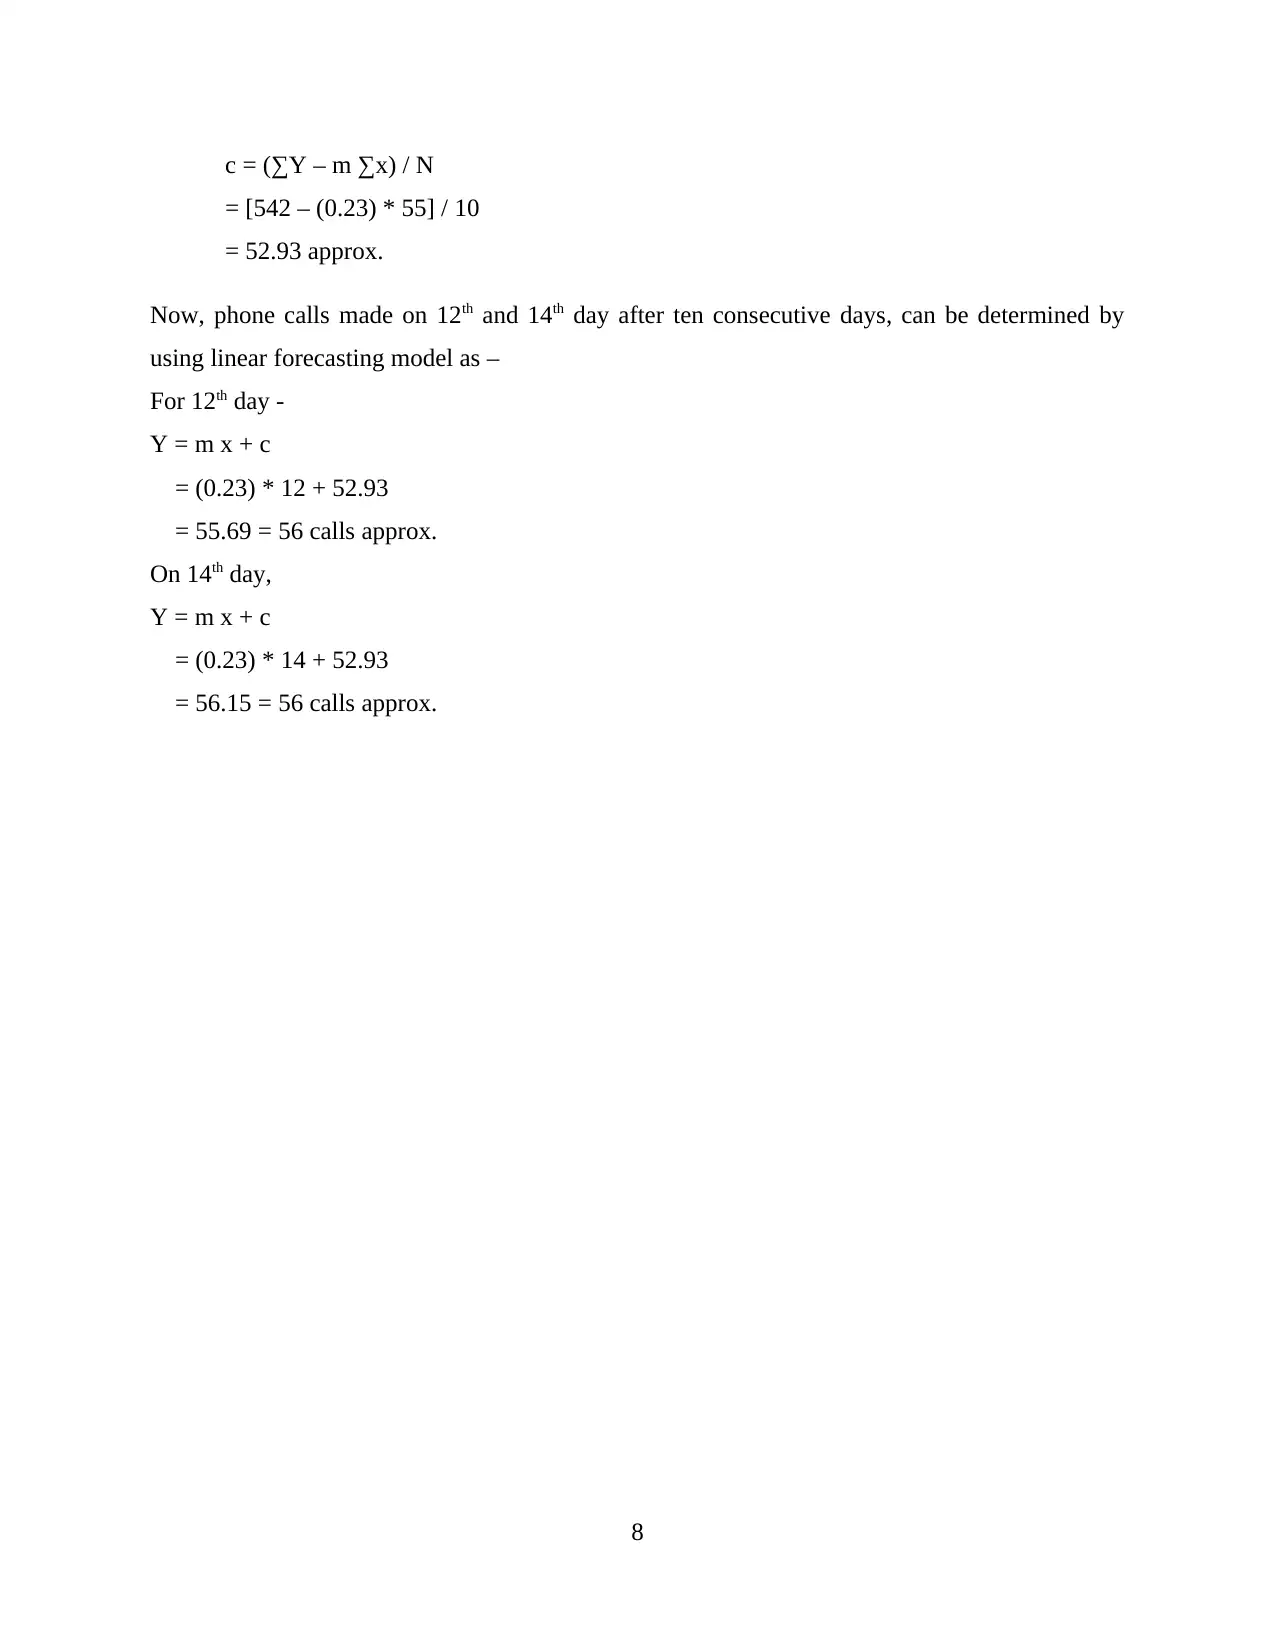
This assignment delves into the analysis of phone call data collected over a ten-day period. It begins with representing the data in a tabular format and follows with graphical representations, including bar and line charts, to visualize the call patterns. The core of the assignment involves applying various statistical tools, such as calculating the mean, median, mode, range, and standard deviation, to identify trends and patterns within the data. Detailed calculations are provided for each statistical measure. Furthermore, the assignment employs a linear forecasting model to predict the number of phone calls on the 12th and 14th days, demonstrating the practical application of data analysis in forecasting future outcomes. The conclusion provides the predicted number of calls for those days. The assignment is well-structured, including an introduction, main body with detailed calculations, and references, showcasing a comprehensive understanding of data analysis techniques.
tabler-icon-diamond-filled.svg

Contribute Materials

Your contribution can guide someone’s learning journey. Share your documents today.
Document Page
Numeracy and Data
Analysis
tabler-icon-diamond-filled.svg

Secure Best Marks with AI Grader

Need help grading? Try our AI Grader for instant feedback on your assignments.
Document Page
Table of Contents
INTRODUCTION...........................................................................................................................1
Main Body.......................................................................................................................................1
1. Representation of data in tabular format............................................................................1
2. Graphical representation of data.........................................................................................2
3. Discussion of data pattern with calculation........................................................................4
4. Liner-forecasting model.....................................................................................................7
REFERENCES................................................................................................................................9
Document Page
INTRODUCTION
Data analysis defines as a process to evaluate information by using statistical or
numerical tools for discovering new data for upcoming periods. It includes programming
languages, central tendencies and more, to identify the particular pattern and apply same to
predict future information (Altay and Alatas, 2019). To analyse importance and concept of data
analysis for numerically presented data, a study is conducted by taking a record of phone calls
making each day within last ten consecutive days. Arranging this information in tabular format,
statistical tools will be applied to predict number of calls make on day 12 and 14 in same month.
Main Body
To conduct a study, a data related to number of phone calls has been assumed from 1st Aug.
2020 to 10th Aug. 2020 as represented in table format below –
1. Representation of data in tabular format
Number of phone calls making per day:
Days
Phone calls
per day
01/08/20 60
02/08/20 52
03/08/20 58
04/08/20 45
05/08/20 52
06/08/20 49
07/08/20 56
08/08/20 52
09/08/20 60
10/08/20 58
1
Document Page
2. Graphical representation of data
Phone calls making per day:
Days
Phone calls
per day
01/08/20 60
02/08/20 52
03/08/20 58
04/08/20 45
05/08/20 52
06/08/20 49
07/08/20 56
08/08/20 52
09/08/20 60
10/08/20 58
1. Bar Chart of phone calls per day
2
tabler-icon-diamond-filled.svg

Secure Best Marks with AI Grader

Need help grading? Try our AI Grader for instant feedback on your assignments.
Document Page
2. Line Chart of phone calls per day
3
Document Page
3. Discussion of data pattern with calculation
To determine particular trends and patterns of a specific data as well as interpret the same
correctly, a range of analytical or statistical tools can be applied, such as central tendencies that
helps in representing whole information into a single term (Aziira, Setiawan and Soesanti, I.,
2020). In context with present report, as it includes data of phone calls made within ten
consecutive days, therefore, to analyse and identify its pattern for forecasting of future data,
methods which will be applied are discussed as below -
Mean: Average of specific data is known as mean. It is calculated by add all the numbers
and then total is divided by total number of observations. Output of this or average identified
support in determine the trends and also depict its variability as decrease or increase by time with
help of following formula:
Arithmetic Mean/Average = sum of total observations
total number of observations
or,
μ = Σx
n
Median: In terms of statistic, this is the value that reflects the middle value of various
observations by arrange every observation as per the size or by in ascending order. In numeric
terms, median can be calculated with help of this formula:
Position value of Median (M) = (No. of total numbers + 1)
2
This formula is used when total number of all observations is odd, and in case when total number
of observations is even then following formula is used:
M = No. of observation
2
Mode: In mathematical terms, this is used to reflect a number that occurs frequently in
number of data set. This is useful as this support in identify the most common occurrence of
observation in an event (Greenspan, 2018).
Range: Term range reflect variations among various set of data by determine the
variation that lie between highest to lowest number. In numeric terms, this can be identified in
following way:
Range = Max. observation – Min. Observation
4
Document Page
Standard Deviations: It helps in predicting the difference between a data with its actual
mean by using below mentioned formula –
Standard Deviation = (variance)
Variance2 = {∑ (x – mean) / N} 2
Calculation:
Days Phone calls
per day
08/01/2020 60
08/02/2020 52
08/03/2020 58
08/04/2020 45
08/05/2020 52
08/06/2020 49
08/07/2020 56
08/08/2020 52
08/09/2020 60
08/10/2020 58
Total 542
Mean 54.2
Median 54
Mode 52
Standard dev. 5.006662228
Numerical –
(Mean) μ = Σx
n
= 542
10
= 54.2.
Median Position = 10 / 2
5
tabler-icon-diamond-filled.svg

Paraphrase This Document

Need a fresh take? Get an instant paraphrase of this document with our AI Paraphraser
Document Page
= 5th Observation
To determine the median value on 5th position of given data, firstly convert the whole data into
increasing order as - 45, 49, 52, 52, 52, 56, 58, 58, 60, 60
Therefore, on calculating Median (M) = (52 + 56) = 54
2
Mode = 52 (has frequently occurred three times in given data)
Range = Max Observation – Min Observation
= 60 – 45
= 15 calls
Table – Calculation for standard deviation
Days Phone calls
per day (x-mean) (x-mean)2
08/01/2020 60 5.8 33.64
08/02/2020 52 -2.2 4.84
08/03/2020 58 3.8 14.44
08/04/2020 45 -9.2 84.64
08/05/2020 52 -2.2 4.84
08/06/2020 49 -5.2 27.04
08/07/2020 56 1.8 3.24
08/08/2020 52 -2.2 4.84
08/09/2020 60 5.8 33.64
08/10/2020 58 3.8 14.44
Mean = 54.2 225.6
Variance = [ ∑(x – mean) 2 / N ]
= 225.6 / 10 = 22.56
Std Dev. = variance
= 22.56
= 4.74 approx.
6
Document Page
4. Liner-forecasting model
To forecast phone calls which have made on 14 and 12 day of same period after ten
consecutive days, linear forecasting model can be applied in given way -
y = mx + c
where, given linear equation indicates slope of a line as m and c as a constant -
m = Change in Y
Change in X
Days Phone calls per
day X2
∑XY
1 60 1 60
2 52 4 104
3 58 9 174
4 45 16 180
5 52 25 260
6 49 36 294
7 56 49 392
8 52 64 416
9 60 81 540
10 58 100 580
55 542 385 3000
1. Value of m in linear forecasted model can be calculated as -
m = N * ∑XY - ∑X * ∑Y
N * ∑X2 - (∑X)2
= 10 * 3000 – 55 * 542
10 * 385 – (55)2
= (30000 – 29810) / (3850 – 3025)
= 190/ 825 = 0.23 approx.
For calculating constant value -
7
Document Page
c = (∑Y – m ∑x) / N
= [542 – (0.23) * 55] / 10
= 52.93 approx.
Now, phone calls made on 12th and 14th day after ten consecutive days, can be determined by
using linear forecasting model as –
For 12th day -
Y = m x + c
= (0.23) * 12 + 52.93
= 55.69 = 56 calls approx.
On 14th day,
Y = m x + c
= (0.23) * 14 + 52.93
= 56.15 = 56 calls approx.
8
tabler-icon-diamond-filled.svg

Secure Best Marks with AI Grader

Need help grading? Try our AI Grader for instant feedback on your assignments.
Document Page
REFERENCES
Books and Journals
Altay, E. V. and Alatas, B., 2019. Performance analysis of multi-objective artificial intelligence
optimization algorithms in numerical association rule mining. Journal of Ambient
Intelligence and Humanized Computing, pp.1-21.
Aziira, A. H., Setiawan, N. A. and Soesanti, I., 2020, July. Generation of Synthetic Continuous
Numerical Data Using Generative Adversarial Networks. In Journal of Physics:
Conference Series (Vol. 1577, No. 1, p. 012027). IOP Publishing.
Greenspan, D., 2018. Numerical Analysis. CRC Press.
9
chevron_up_icon
1 out of 11
circle_padding
hide_on_mobile
zoom_out_icon
logo.png

Your All-in-One AI-Powered Toolkit for Academic Success.

Available 24*7 on WhatsApp / Email

[object Object]