Phylogenetic Prediction: Tree Analysis and Species Relationships
VerifiedAdded on 2022/07/21
|7
|1247
|19
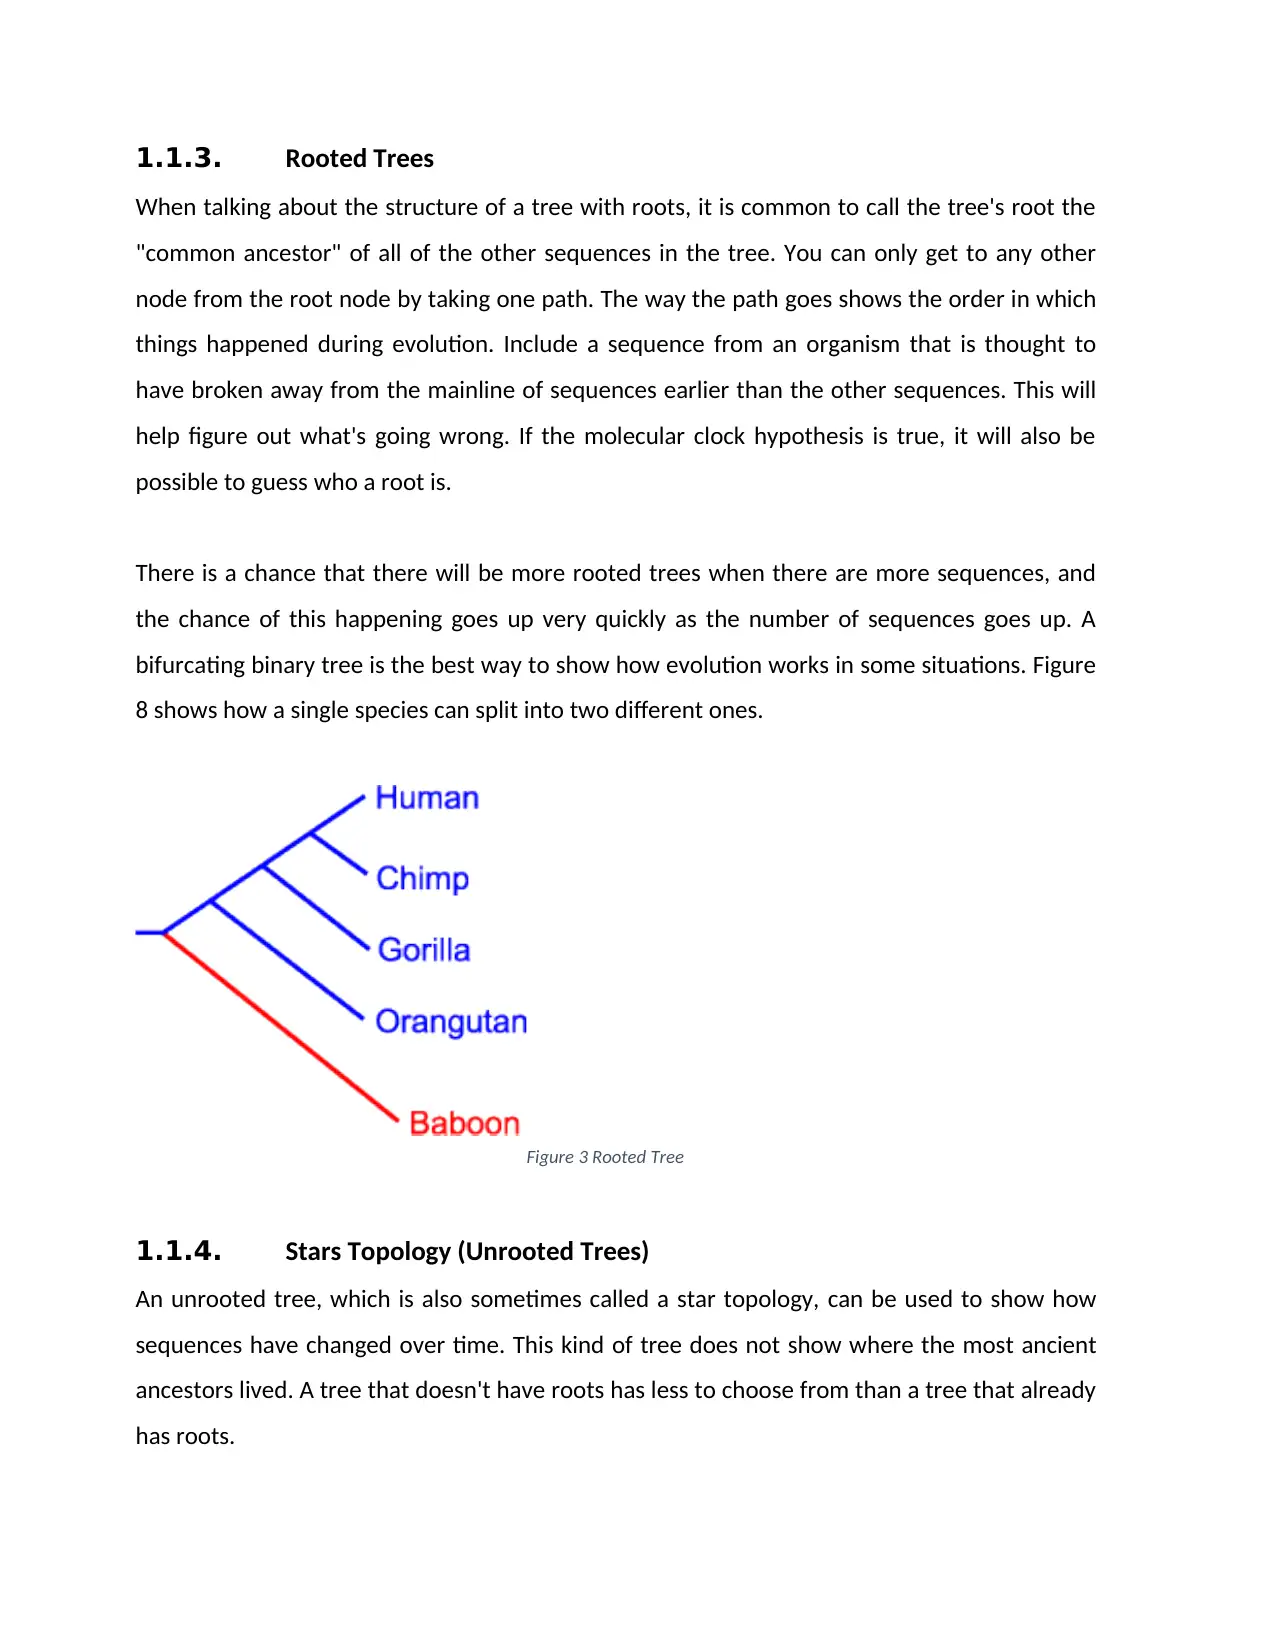
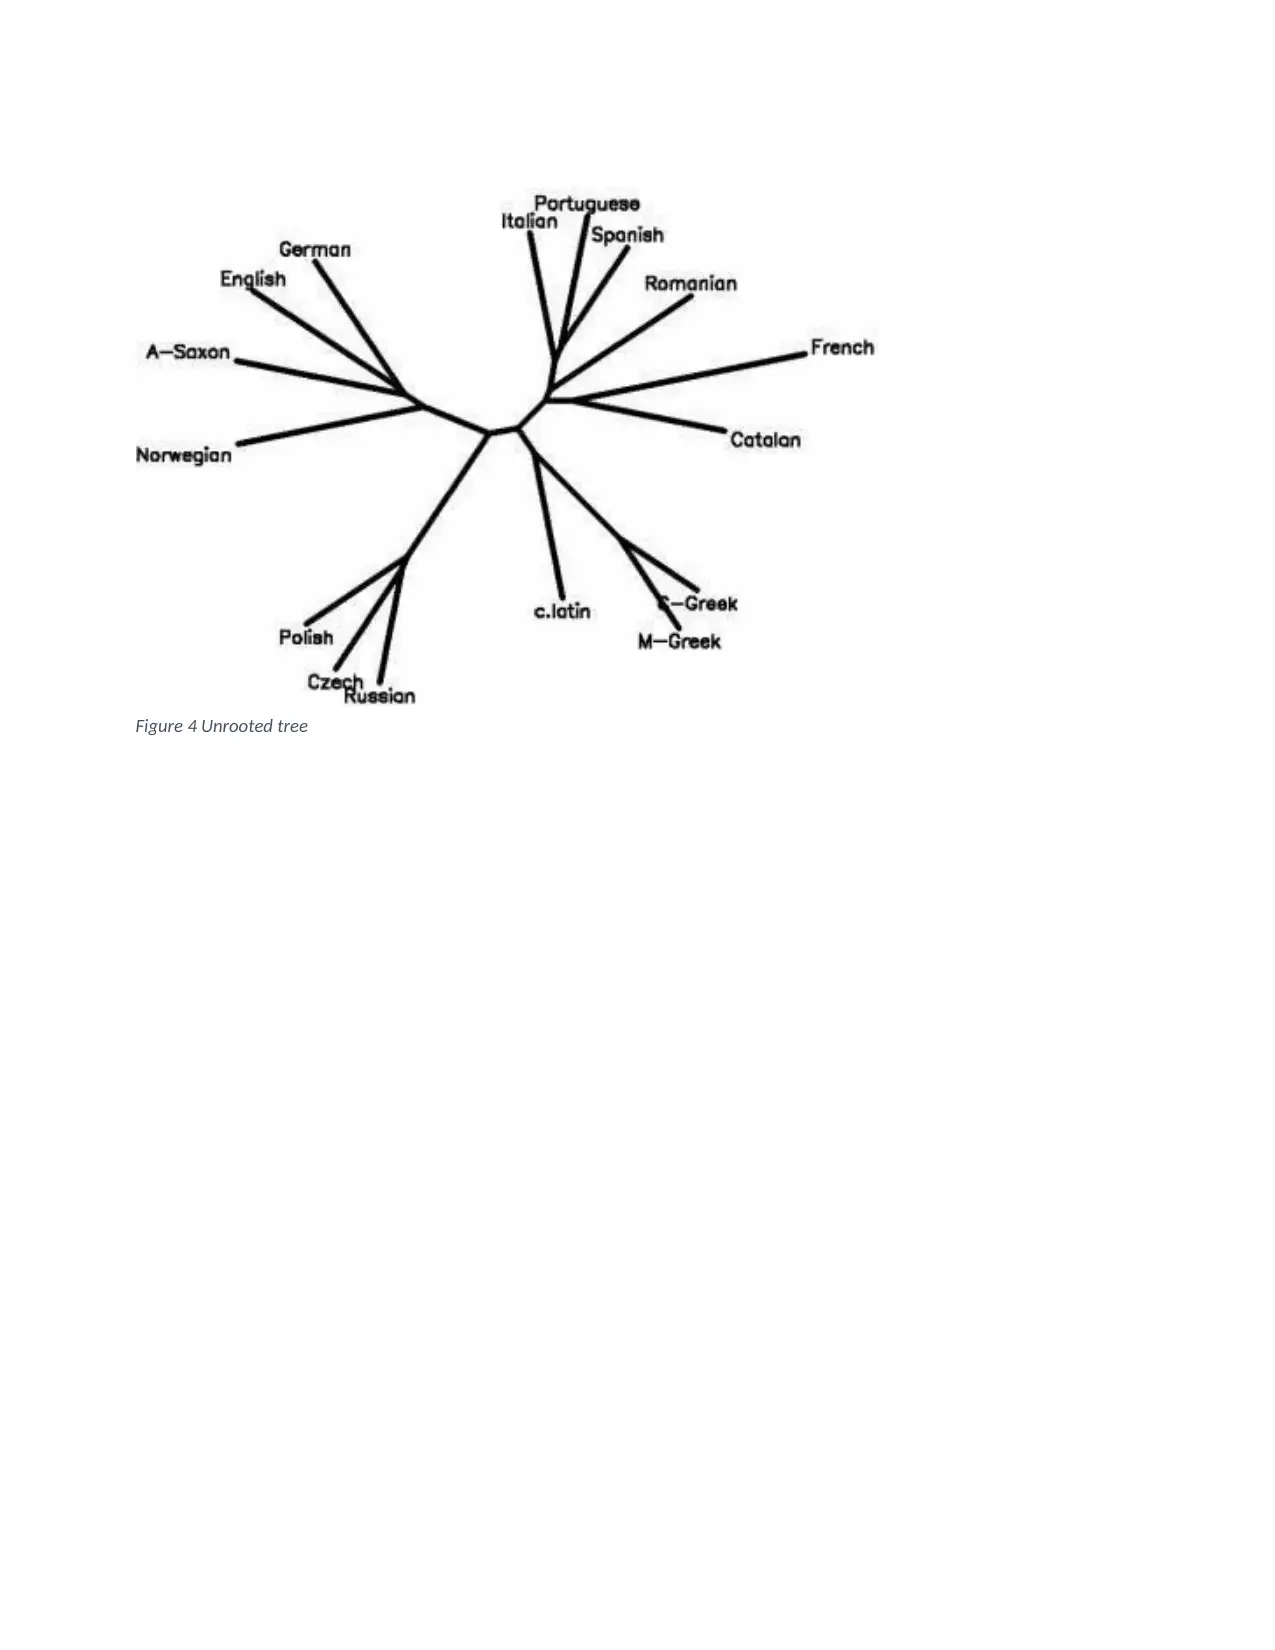
Homework Assignment
AI Summary
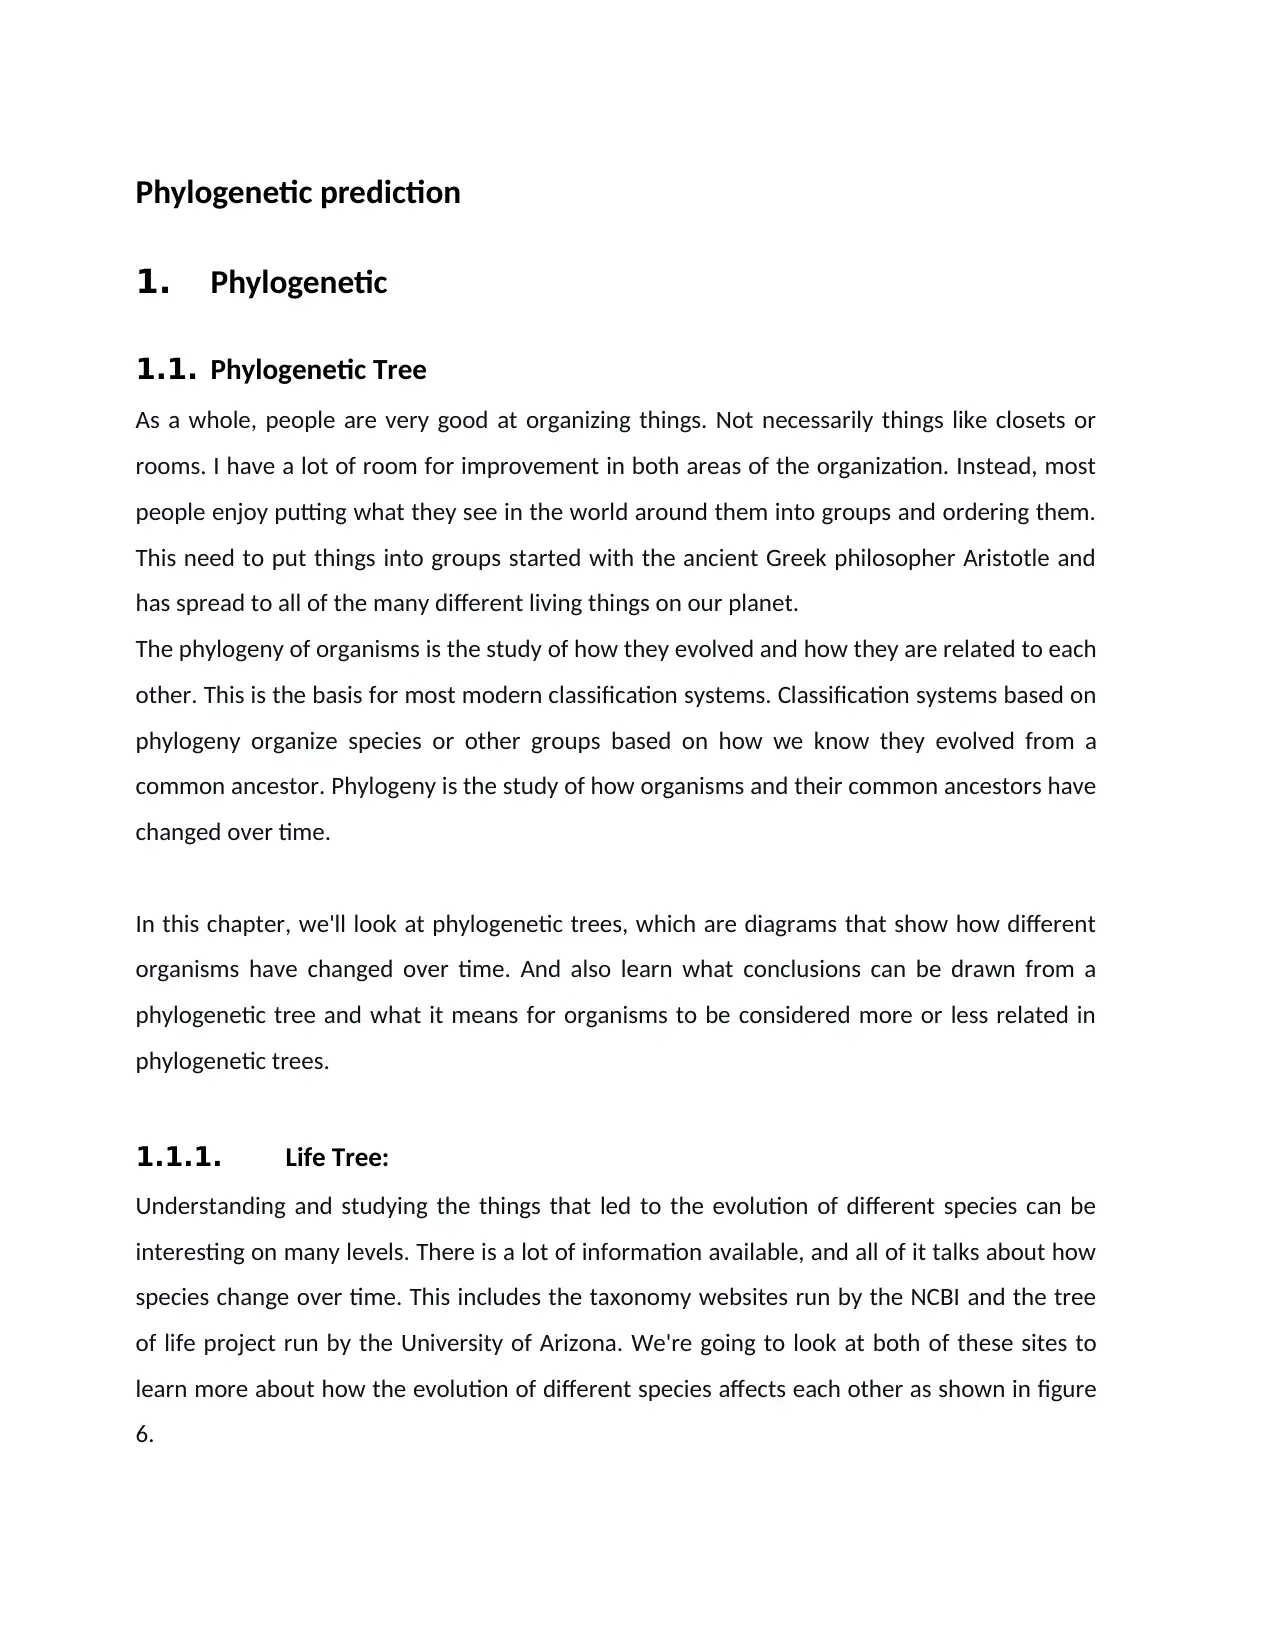
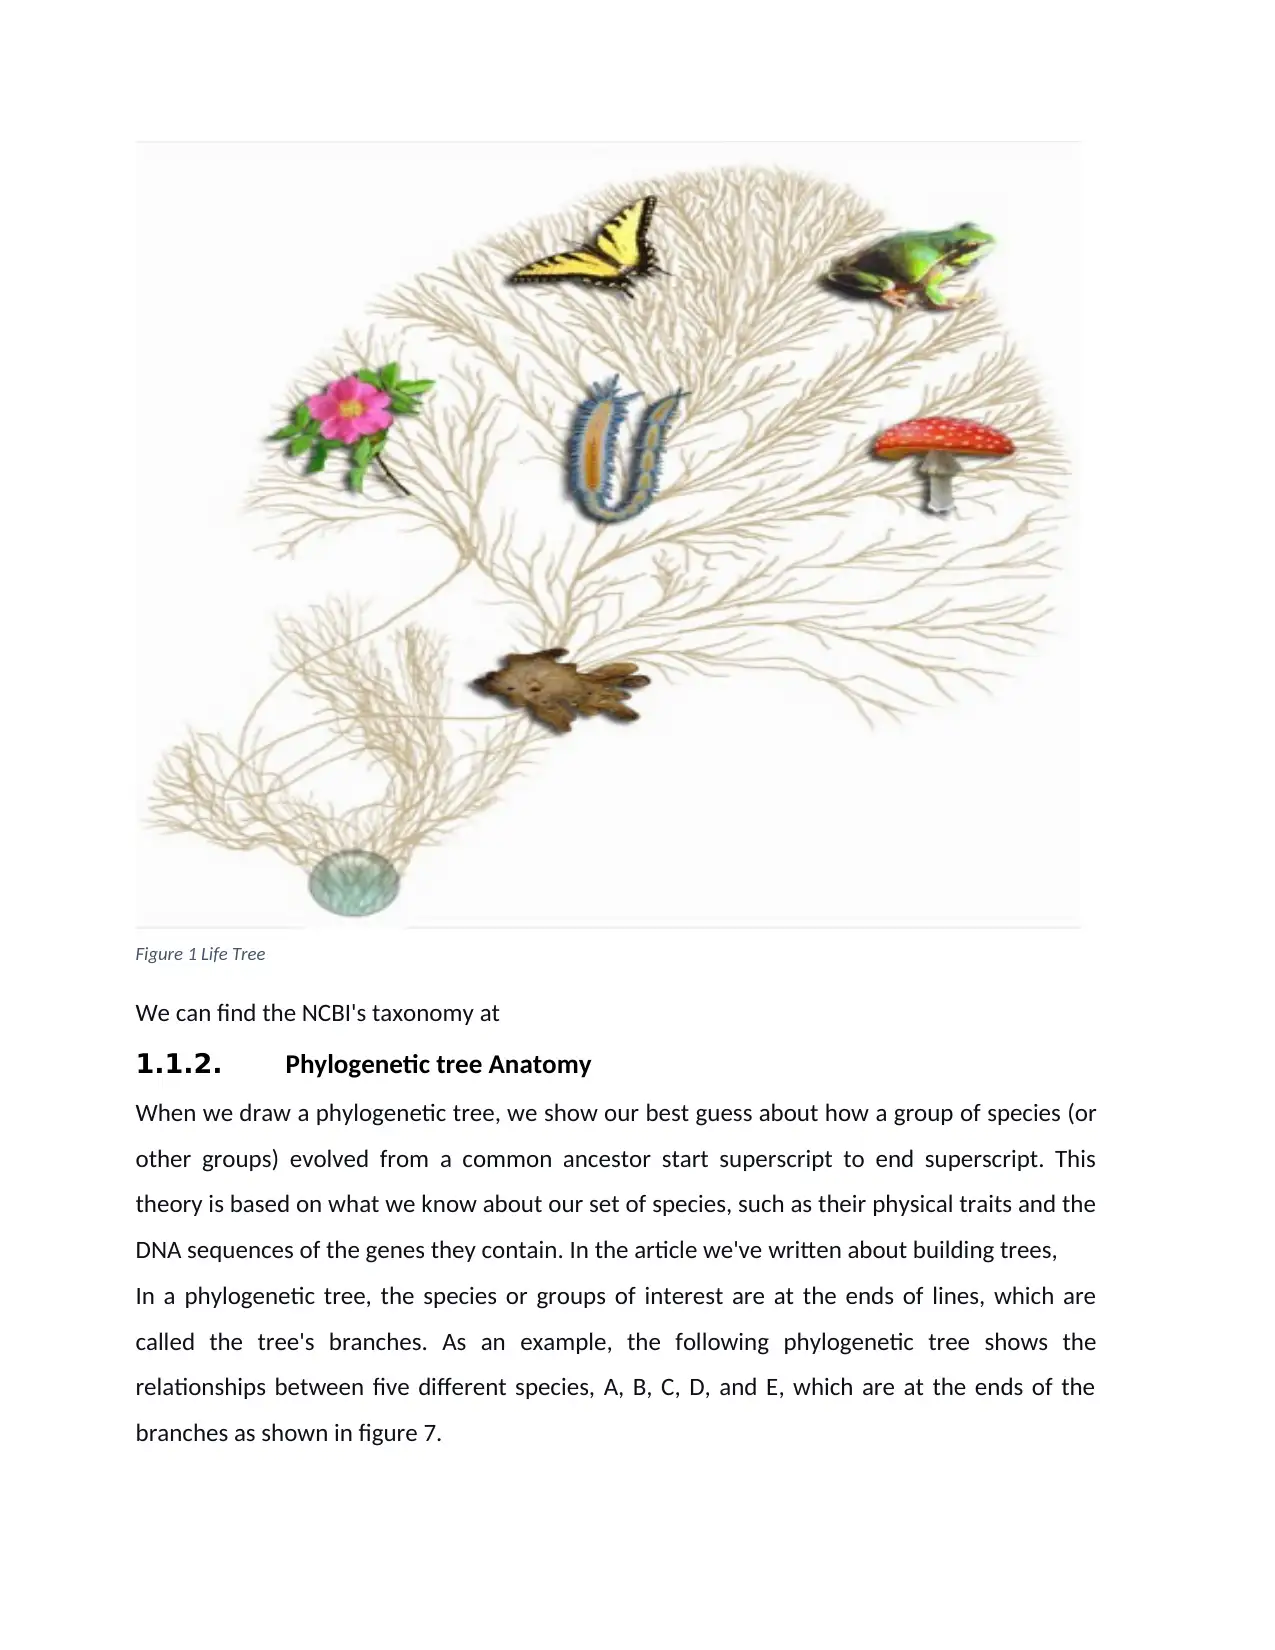
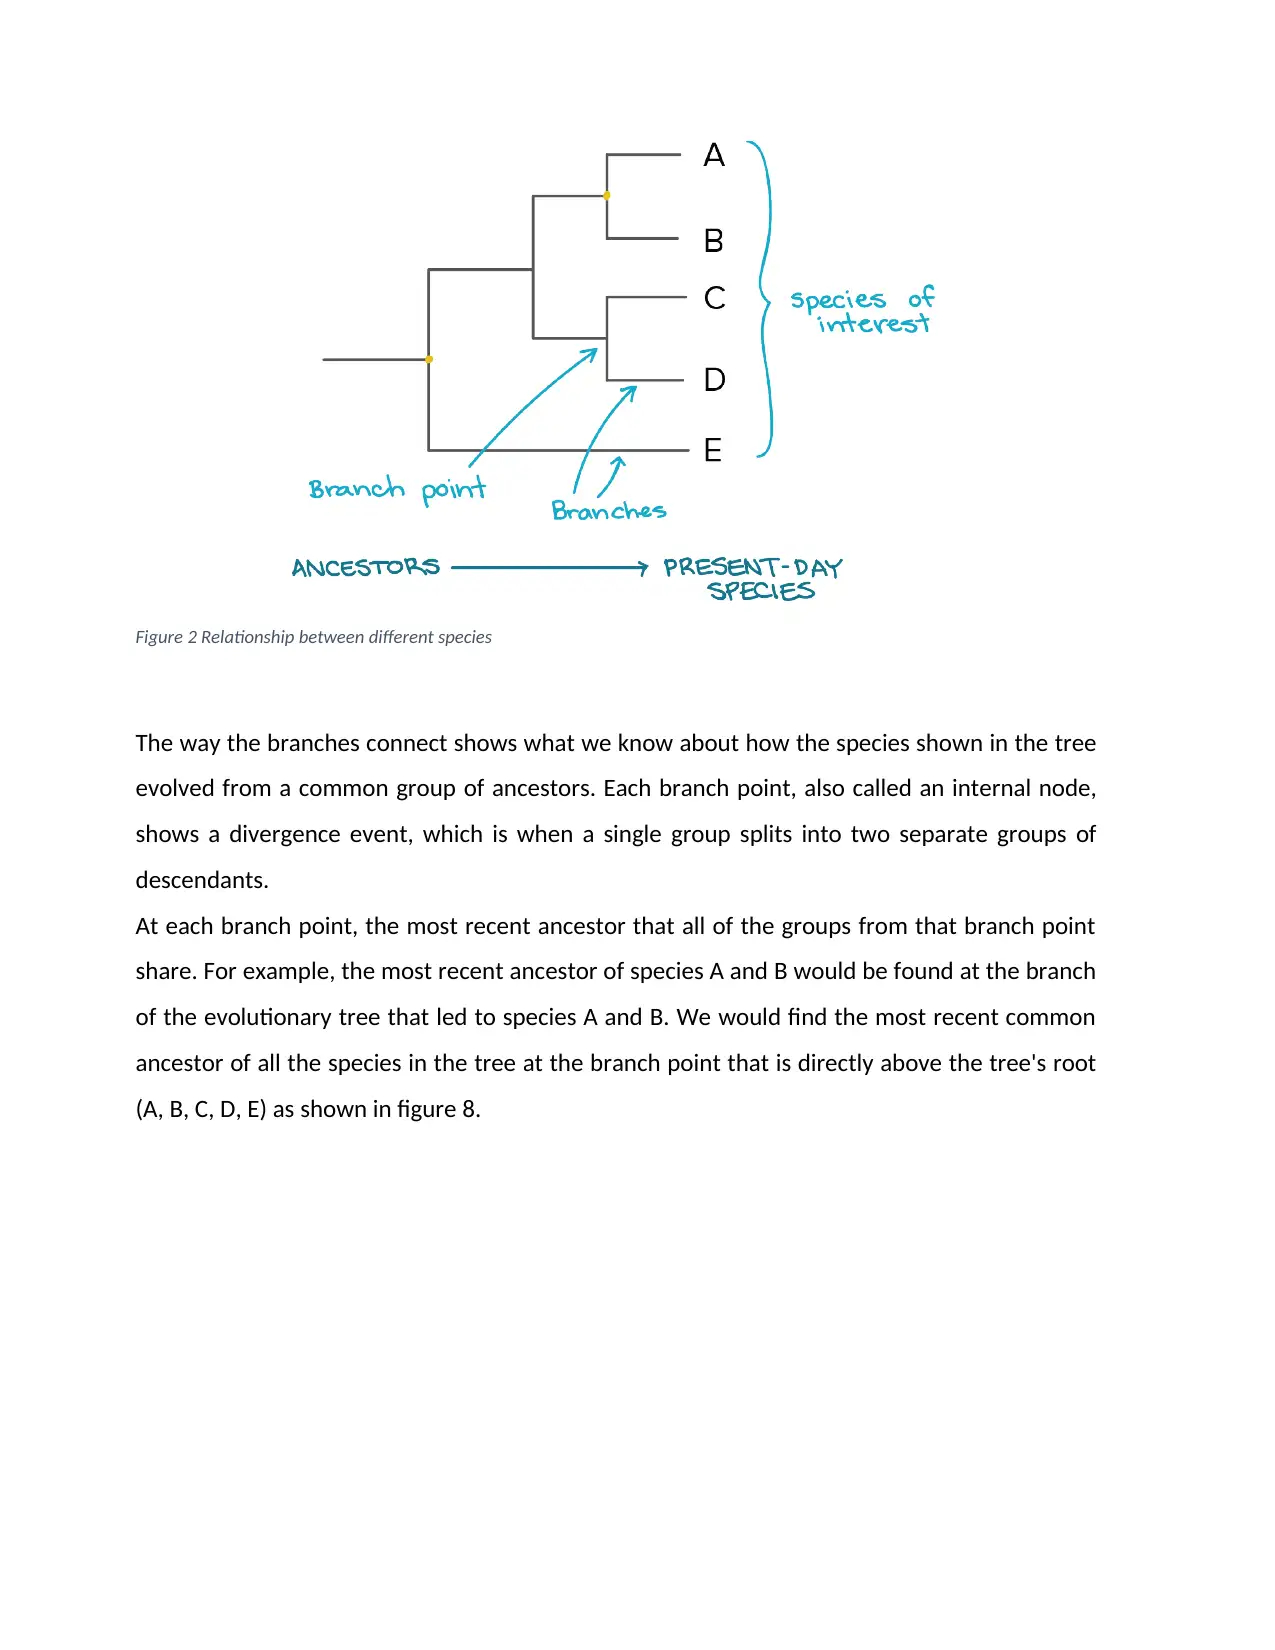
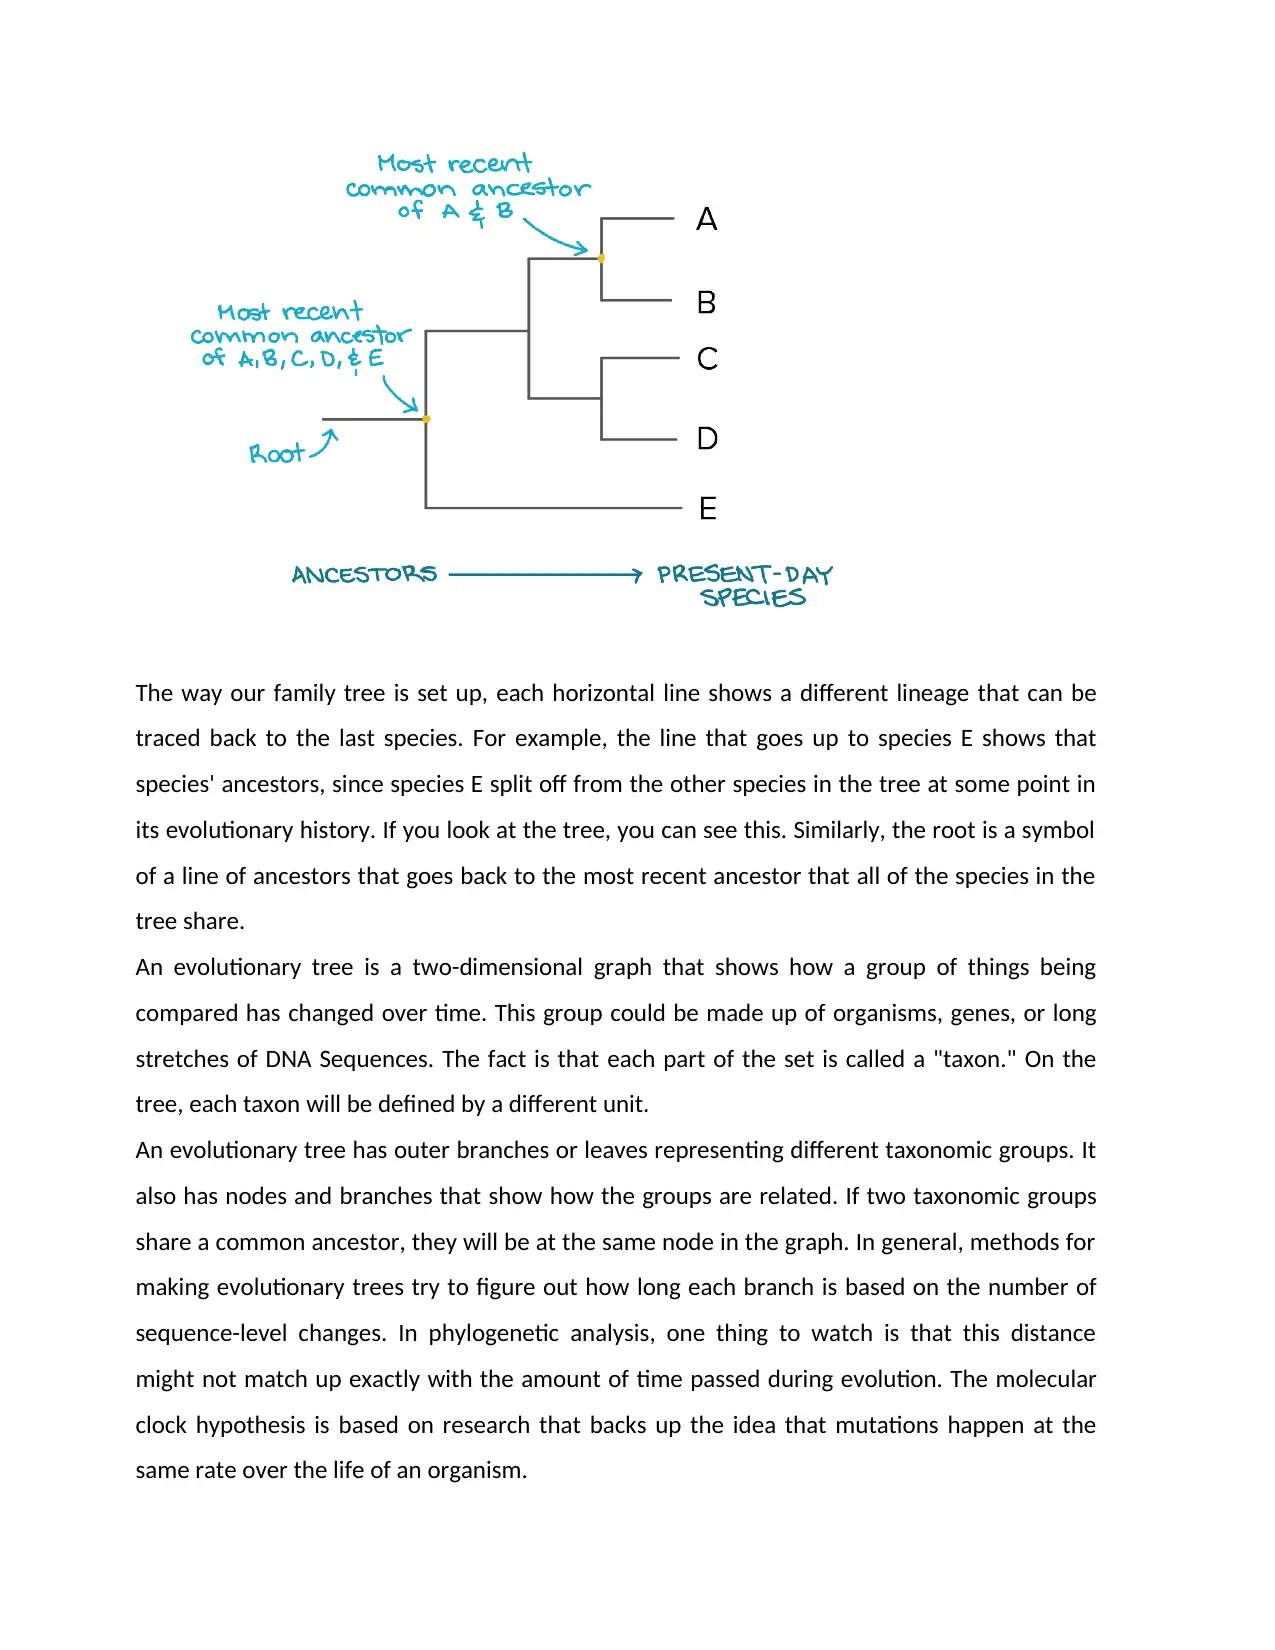
This assignment delves into the realm of phylogenetic prediction, offering a comprehensive exploration of phylogenetic trees and their significance in understanding species evolution. It begins by introducing the concept of phylogenetic trees as diagrams that represent the evolutionary relationships between organisms. The assignment then proceeds to dissect the anatomy of phylogenetic trees, explaining the meaning of branches, nodes, and the concept of common ancestors. It distinguishes between rooted and unrooted trees, highlighting their distinct characteristics and applications. The content further explores the use of phylogenetic trees in understanding the evolution of different species, referencing resources such as NCBI taxonomy and the tree of life project. The assignment provides a detailed explanation of how species are organized and how they are related to each other, which is the basis for most modern classification systems. The assignment aims to clarify the key concepts and methodologies used in phylogenetic analysis, enhancing the understanding of evolutionary relationships and the construction of phylogenetic trees.

1 out of 7
Related Documents


Your All-in-One AI-Powered Toolkit for Academic Success.
+13062052269
info@desklib.com
Available 24*7 on WhatsApp / Email
![[object Object]](/_next/static/media/star-bottom.7253800d.svg)
Copyright © 2020–2026 A2Z Services. All Rights Reserved. Developed and managed by ZUCOL.