HSN719 Assignment 2: Physical Activity and Nutrition Assessment Report
VerifiedAdded on 2023/04/21
|23
|6138
|353
Report
AI Summary
This report presents an assessment of physical activity and nutrition among university students, focusing on a study conducted to examine the dietary habits, physical activity levels, and anthropometric measurements of students at an Australian university. The study utilized a three-day food record to analyze micro and macronutrient intake, and also employed a short food frequency questionnaire for calcium intake. Physical activity was assessed through a three-day physical activity diary and the Active Australia Survey, while anthropometric measurements included height, weight, waist circumference, and body fat percentage using skinfold measurements and bioelectrical impedance. The results revealed insights into macronutrient and micronutrient consumption, energy balance, and anthropometric data. The findings were compared with Australian recommendations, highlighting areas of inadequacy in micronutrient intake, particularly calcium, and differences in energy expenditure measurements between the methods used. The report underscores the importance of nutritional and physical assessments for identifying shortcomings in lifestyle habits and promoting positive health outcomes among university students. The report also discusses the limitations of the study and makes comparisons with Australian norms and standards.
Running head: ASSESSMENT OF PHYSICAL ACTIVITY AND NUTRITION
ASSESSMENT OF PHYSCIAL ACTIVITY AND NUTRITION
Name of the Student:
Name of the University:
Author note:
ASSESSMENT OF PHYSCIAL ACTIVITY AND NUTRITION
Name of the Student:
Name of the University:
Author note:
Paraphrase This Document
Need a fresh take? Get an instant paraphrase of this document with our AI Paraphraser
1ASSESSMENT OF PHYSICAL ACTIVITY AND NUTRITION
Abstract
Consumption of nutritious food along with adherence to required levels of physical activity is
required for healthy and sustainable life functioning. Hence, performance of accurate
assessments of physical activity and nutritional status is helpful for the identification of
shortcomings in the existing dietary and lifestyle status of individual, paving the way for
future corrections and positive health outcomes. University students are highly susceptible to
inadequate food consumption and sedentary lifestyle, due to overwhelming psychological,
social and academic transitions which are characteristic of that age, resulting in poor
nutritional status. The following research was performed to examine the nutritional and
physical activity levels of students studying in an Australian university using dietary,
physical activity and anthropometric assessments. The results of the study were also
compared with Australian recommendations to observed similarities and differences.
2ASSESSMENT OF PHYSICAL ACTIVITY AND NUTRITION
Table of Contents
Introduction....................................................................................................................3
Background of the Study............................................................................................3
Rationale of the Study................................................................................................3
Scientific Rationale: Physical and Nutrition Assessment......................................4
Objectives of the Study..............................................................................................4
Aims of the Study...................................................................................................5
Participants and Methods...............................................................................................5
Selection of Participants.............................................................................................5
Methodology of the Study..........................................................................................6
Micro and Macronutrient Intake............................................................................6
Energy Balance and Physical Activity...................................................................6
Anthropometric Measurement...............................................................................7
Results............................................................................................................................7
Macronutrient Intake..................................................................................................7
Table 1: Descriptive Statistics of Macronutrient Intake........................................7
Table 2: Nutrient Consumption Percentage as per Recommended Values............8
Micronutrient Intake...................................................................................................8
Table 3: Descriptive Statistics of Micronutrient Intake.........................................8
Table 4: Inadequacy of Micronutrient Intake.........................................................9
Energy Intake and Expenditure..................................................................................9
⊘ This is a preview!⊘
Do you want full access?
Subscribe today to unlock all pages.
Trusted by 1+ million students worldwide
3ASSESSMENT OF PHYSICAL ACTIVITY AND NUTRITION
Table 5: Descriptive Statistics of Energy Intake and Expenditure........................9
Anthropometric Measurement.................................................................................10
Table 6: Descriptive Statistics of Anthropometrics.............................................10
Table 7: Distribution (%) of Body Mass Index (BMI) Categories......................10
Table 8: Distribution (%) of Waist Circumference (WC) Categories..................10
Discussion....................................................................................................................11
Findings of the Study...............................................................................................11
Limitations of the Study.......................................................................................11
Comparison with Australian Norms and Standards.............................................12
Intake of Calcium.....................................................................................................14
Energy Expenditure..................................................................................................14
Percentage of Body Fat............................................................................................15
Conclusion....................................................................................................................15
References....................................................................................................................16
Paraphrase This Document
Need a fresh take? Get an instant paraphrase of this document with our AI Paraphraser
4ASSESSMENT OF PHYSICAL ACTIVITY AND NUTRITION
Introduction
Individuals belonging to the ages of 18 to 24 years, that is, during the later stages and
early years of adolescence and adulthood, are often highly susceptible to harmful health
outcomes, such as poor nutritional status, deficiencies of essential micronutrients and
negligible levels of physical activity, resulting in abnormal anthropometric measurements (1).
This may due to the challenging emotional, psychological, social and academic
circumstances required to be overcome by university students. Hence, an adequate physical
and nutritional assessment is of utmost importance, prior to enlightening university students
on the necessity of maintaining appropriate dietary and lifestyle habits (2).
Background of the Study
The Australian Health Survey (2011-2012) reported that 70% or 12 million adults
residing in Australia, live lifestyles which are sedentary or engage in low levels of physical
activity. Also, it was found that that only 53% of Australians in the age group of 18 to 24
years, engaged themselves in appropriate levels of physical activity (3). According to the
Australian Institute of Health and Welfare, Australians within the age of 19, as well as
between the ages of 19 to 50, consumed vegetables and fruits below the recommended levels.
The data also reported insufficient intake of calcium and iron among Australian females (4).
Hence, the above data necessitates the need for adhering to adequate levels of physical
activity and nutrition. Conductance of adequate nutritional and physical assessments
enlighten individuals on the shortcomings of their existing health status, paving the way for
future treatments and positive health outcomes (5).
Rationale of the Study
Individuals engaged in university education, are often susceptible to distorted lifestyle
habits, since more often than not, they are compelled to change their residences of lack
5ASSESSMENT OF PHYSICAL ACTIVITY AND NUTRITION
inadequate nutritional and exercise knowledge (6). University students are highly susceptible
to fast or processed food consumption, insufficient physical activity and smoking or alcohol
consumption, upon being compelled by the demanding peer, academic, social, psychological
and emotional circumstances surrounding them. This results in distorted dietary consumption
and energy balance among university students, hence necessitating appropriate assessment
prior to management (7).
Scientific Rationale: Physical and Nutrition Assessment
Conducting assessment and imparting education on nutrition allows individuals to
correct their existing detrimental habits. An individual’s nutritional assessment provides key
insights of the possible distorted intake of certain nutrients, with the aim that these may
corrected in the future to prevent poor nutrition associated metabolic or deficiency disorders
(8). Poor bone strength, catabolic loss of muscle tissues, excessive adipose accumulation,
inadequate immunity and high prevalence of fatigue are major detrimental implications of
poor physical activity status (9). Hence, adequate physical assessments enlighten the presence
of possible inadequate exercise levels in an individual, for future correction and prevention of
above implications. Hence, nutrition and physical assessments must be conducted with the
underlying scientific rationale of ensuring positive health outcomes (10).
Objectives of the Study
The objective of this study is to examine the physical activity levels, nutritional status
and anthropometrics among university students in Australia, using nutrient intake, body
composition and energy expenditure assessments.
⊘ This is a preview!⊘
Do you want full access?
Subscribe today to unlock all pages.
Trusted by 1+ million students worldwide
6ASSESSMENT OF PHYSICAL ACTIVITY AND NUTRITION
Aims of the Study
The study was conducted with the following aims:
To examine the intake of dietary calcium among subjects using a short food frequency
questionnaire and three day food record.
To assess the validity of intake of dietary calcium, using a short food frequency
questionnaire in comparison to a three day food record.
To examine subjects’ energy expenditure using three day physical activity diary and
Active Australia Survey, followed by comparative analysis of the validity of both
methods.
To examine subject’s micro and macro nutrient consumption using three day food
record.
To examine subject’s anthropometrics, energy expenditure and physical activity levels
using three physical activity and food records, skinfold measurements, bioelectrical
impedance along with usage of the Active Australia Survey to procure group data.
To conduct comparative analysis of the obtained data with Australian norms and
standards.
Participants and Methods
Selection of Participants
The study included participants who were students studying in an Australian
university. 212 students were asked to provide required information in a database online. Of
this, 3 female students were excluded from the study, since they provide incomplete data in
the Food Works database. 35 male students were excluded from the study. Finally sample
size consisted of 173 females within the age group of 19 to 56 years, with the average age
being 23.7 years.
Paraphrase This Document
Need a fresh take? Get an instant paraphrase of this document with our AI Paraphraser
7ASSESSMENT OF PHYSICAL ACTIVITY AND NUTRITION
Methodology of the Study
Micro and Macronutrient Intake
Macronutrient and micronutrient intake data of carbohydrates, energy, fat, protein,
calcium, folate, iron, zinc and Vitamin C were collected using a three day food record (11). A
short food frequency questionnaire as well for collection of calcium intake data (12).
Statistical Analysis
STATA SE 14 Software was used to statistically analyse the data, with p <0.05 as the
statistical significance value. Apart from descriptive statistics, the micronutrient intake values
were compared to the Estimated Average Requirement (EAR) values stated by the Nutrient
Reference Value Tables for Australians in individuals aged 19 to 30 years, using a probability
and cut point method (13). The dietary calcium intake values obtained both by the short food
frequency questionnaire and the three day food record method were compared and correlated
using paired t-test and Pearson’s Correlation Coefficient procedures (14).
Energy Balance and Physical Activity
Energy intake, energy expenditure and physical activity levels were measured using a
three day physical activity diary (15). Metabolic Equivalent of Task was used for every
performed physical activity (16). Basal Metabolic Rate was measured using the Schofield
Equation (17). The Active Australia Survey was used to procure group energy expenditure
values (18).
Statistical Analysis
STATA SE 14 Software was used to statistically analyse the data, with p <0.05 as the
statistical significance. Energy expenditure values measured by the Active Australia Survey
8ASSESSMENT OF PHYSICAL ACTIVITY AND NUTRITION
and three day physical activity diary were tabulated using descriptive statistics. The energy
expenditure and physical activity values procured from both methods of the Active Australia
Survey and three day physical activity diary were correlated and compared using Pearson’s
Coefficient and paired t-test (14).
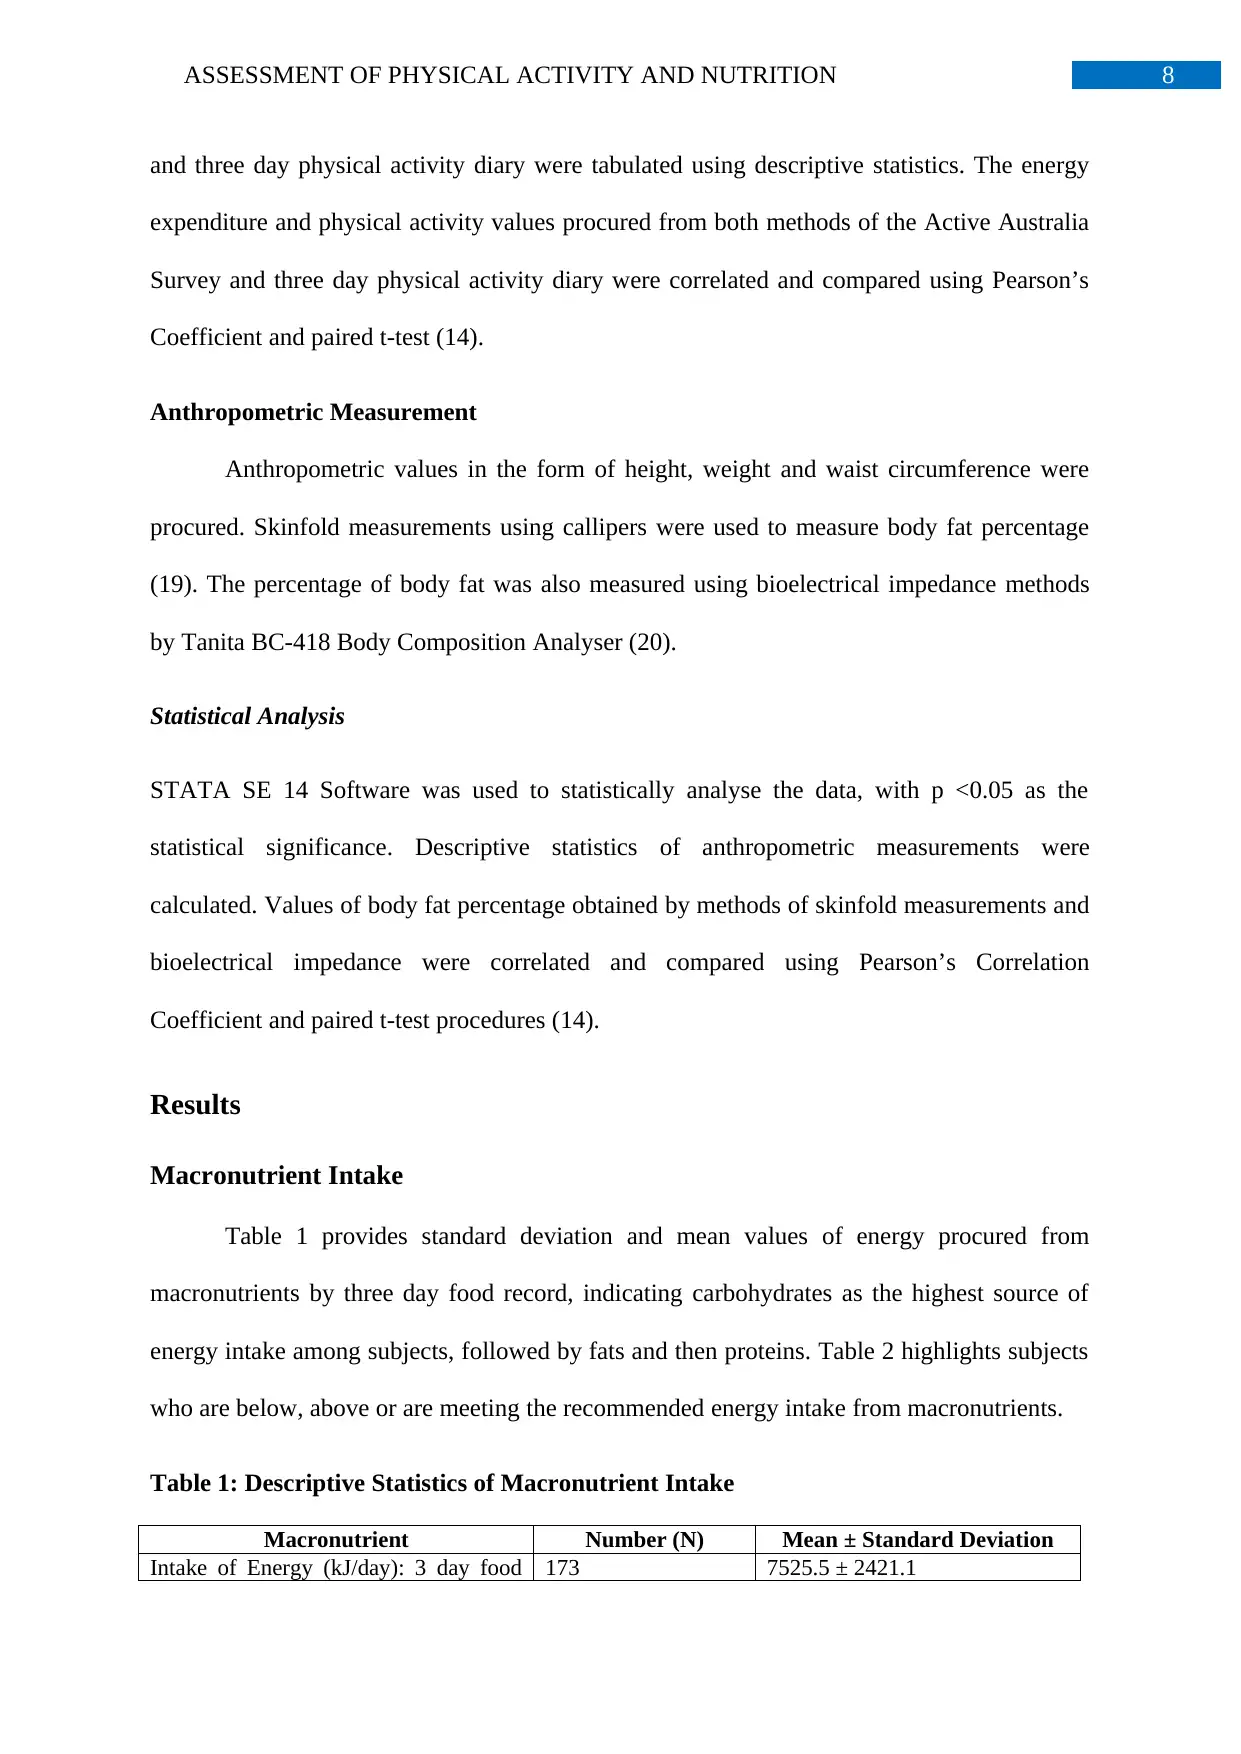
Anthropometric Measurement
Anthropometric values in the form of height, weight and waist circumference were
procured. Skinfold measurements using callipers were used to measure body fat percentage
(19). The percentage of body fat was also measured using bioelectrical impedance methods
by Tanita BC-418 Body Composition Analyser (20).
Statistical Analysis
STATA SE 14 Software was used to statistically analyse the data, with p <0.05 as the
statistical significance. Descriptive statistics of anthropometric measurements were
calculated. Values of body fat percentage obtained by methods of skinfold measurements and
bioelectrical impedance were correlated and compared using Pearson’s Correlation
Coefficient and paired t-test procedures (14).
Results
Macronutrient Intake
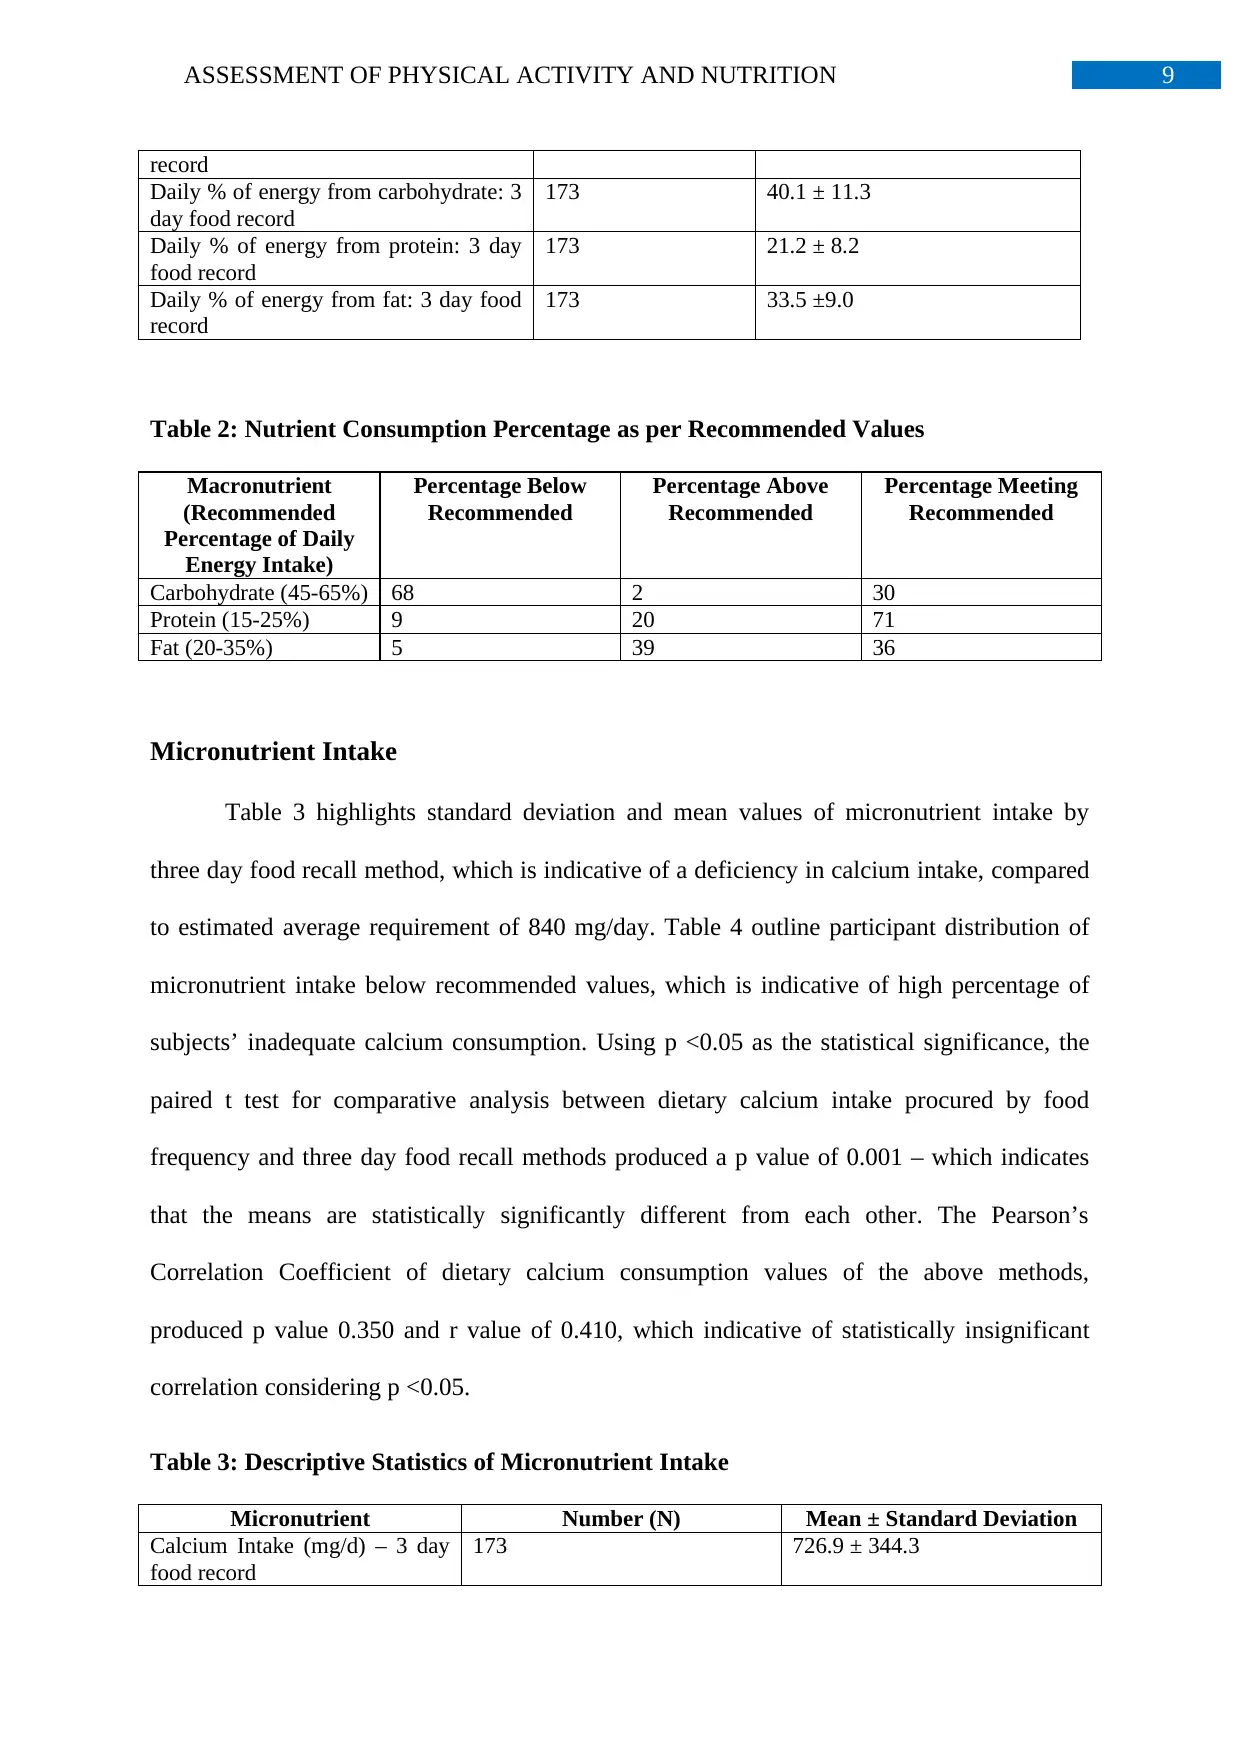
Table 1 provides standard deviation and mean values of energy procured from
macronutrients by three day food record, indicating carbohydrates as the highest source of
energy intake among subjects, followed by fats and then proteins. Table 2 highlights subjects
who are below, above or are meeting the recommended energy intake from macronutrients.
Table 1: Descriptive Statistics of Macronutrient Intake
Macronutrient Number (N) Mean ± Standard Deviation
Intake of Energy (kJ/day): 3 day food 173 7525.5 ± 2421.1
and three day physical activity diary were tabulated using descriptive statistics. The energy
expenditure and physical activity values procured from both methods of the Active Australia
Survey and three day physical activity diary were correlated and compared using Pearson’s
Coefficient and paired t-test (14).
Anthropometric Measurement
Anthropometric values in the form of height, weight and waist circumference were
procured. Skinfold measurements using callipers were used to measure body fat percentage
(19). The percentage of body fat was also measured using bioelectrical impedance methods
by Tanita BC-418 Body Composition Analyser (20).
Statistical Analysis
STATA SE 14 Software was used to statistically analyse the data, with p <0.05 as the
statistical significance. Descriptive statistics of anthropometric measurements were
calculated. Values of body fat percentage obtained by methods of skinfold measurements and
bioelectrical impedance were correlated and compared using Pearson’s Correlation
Coefficient and paired t-test procedures (14).
Results
Macronutrient Intake
Table 1 provides standard deviation and mean values of energy procured from
macronutrients by three day food record, indicating carbohydrates as the highest source of
energy intake among subjects, followed by fats and then proteins. Table 2 highlights subjects
who are below, above or are meeting the recommended energy intake from macronutrients.
Table 1: Descriptive Statistics of Macronutrient Intake
Macronutrient Number (N) Mean ± Standard Deviation
Intake of Energy (kJ/day): 3 day food 173 7525.5 ± 2421.1
⊘ This is a preview!⊘
Do you want full access?
Subscribe today to unlock all pages.
Trusted by 1+ million students worldwide
9ASSESSMENT OF PHYSICAL ACTIVITY AND NUTRITION
record
Daily % of energy from carbohydrate: 3
day food record
173 40.1 ± 11.3
Daily % of energy from protein: 3 day
food record
173 21.2 ± 8.2
Daily % of energy from fat: 3 day food
record
173 33.5 ±9.0
Table 2: Nutrient Consumption Percentage as per Recommended Values
Macronutrient
(Recommended
Percentage of Daily
Energy Intake)
Percentage Below
Recommended
Percentage Above
Recommended
Percentage Meeting
Recommended
Carbohydrate (45-65%) 68 2 30
Protein (15-25%) 9 20 71
Fat (20-35%) 5 39 36
Micronutrient Intake
Table 3 highlights standard deviation and mean values of micronutrient intake by
three day food recall method, which is indicative of a deficiency in calcium intake, compared
to estimated average requirement of 840 mg/day. Table 4 outline participant distribution of
micronutrient intake below recommended values, which is indicative of high percentage of
subjects’ inadequate calcium consumption. Using p <0.05 as the statistical significance, the
paired t test for comparative analysis between dietary calcium intake procured by food
frequency and three day food recall methods produced a p value of 0.001 – which indicates
that the means are statistically significantly different from each other. The Pearson’s
Correlation Coefficient of dietary calcium consumption values of the above methods,
produced p value 0.350 and r value of 0.410, which indicative of statistically insignificant
correlation considering p <0.05.
Table 3: Descriptive Statistics of Micronutrient Intake
Micronutrient Number (N) Mean ± Standard Deviation
Calcium Intake (mg/d) – 3 day
food record
173 726.9 ± 344.3
record
Daily % of energy from carbohydrate: 3
day food record
173 40.1 ± 11.3
Daily % of energy from protein: 3 day
food record
173 21.2 ± 8.2
Daily % of energy from fat: 3 day food
record
173 33.5 ±9.0
Table 2: Nutrient Consumption Percentage as per Recommended Values
Macronutrient
(Recommended
Percentage of Daily
Energy Intake)
Percentage Below
Recommended
Percentage Above
Recommended
Percentage Meeting
Recommended
Carbohydrate (45-65%) 68 2 30
Protein (15-25%) 9 20 71
Fat (20-35%) 5 39 36
Micronutrient Intake
Table 3 highlights standard deviation and mean values of micronutrient intake by
three day food recall method, which is indicative of a deficiency in calcium intake, compared
to estimated average requirement of 840 mg/day. Table 4 outline participant distribution of
micronutrient intake below recommended values, which is indicative of high percentage of
subjects’ inadequate calcium consumption. Using p <0.05 as the statistical significance, the
paired t test for comparative analysis between dietary calcium intake procured by food
frequency and three day food recall methods produced a p value of 0.001 – which indicates
that the means are statistically significantly different from each other. The Pearson’s
Correlation Coefficient of dietary calcium consumption values of the above methods,
produced p value 0.350 and r value of 0.410, which indicative of statistically insignificant
correlation considering p <0.05.
Table 3: Descriptive Statistics of Micronutrient Intake
Micronutrient Number (N) Mean ± Standard Deviation
Calcium Intake (mg/d) – 3 day
food record
173 726.9 ± 344.3
Paraphrase This Document
Need a fresh take? Get an instant paraphrase of this document with our AI Paraphraser
10ASSESSMENT OF PHYSICAL ACTIVITY AND NUTRITION
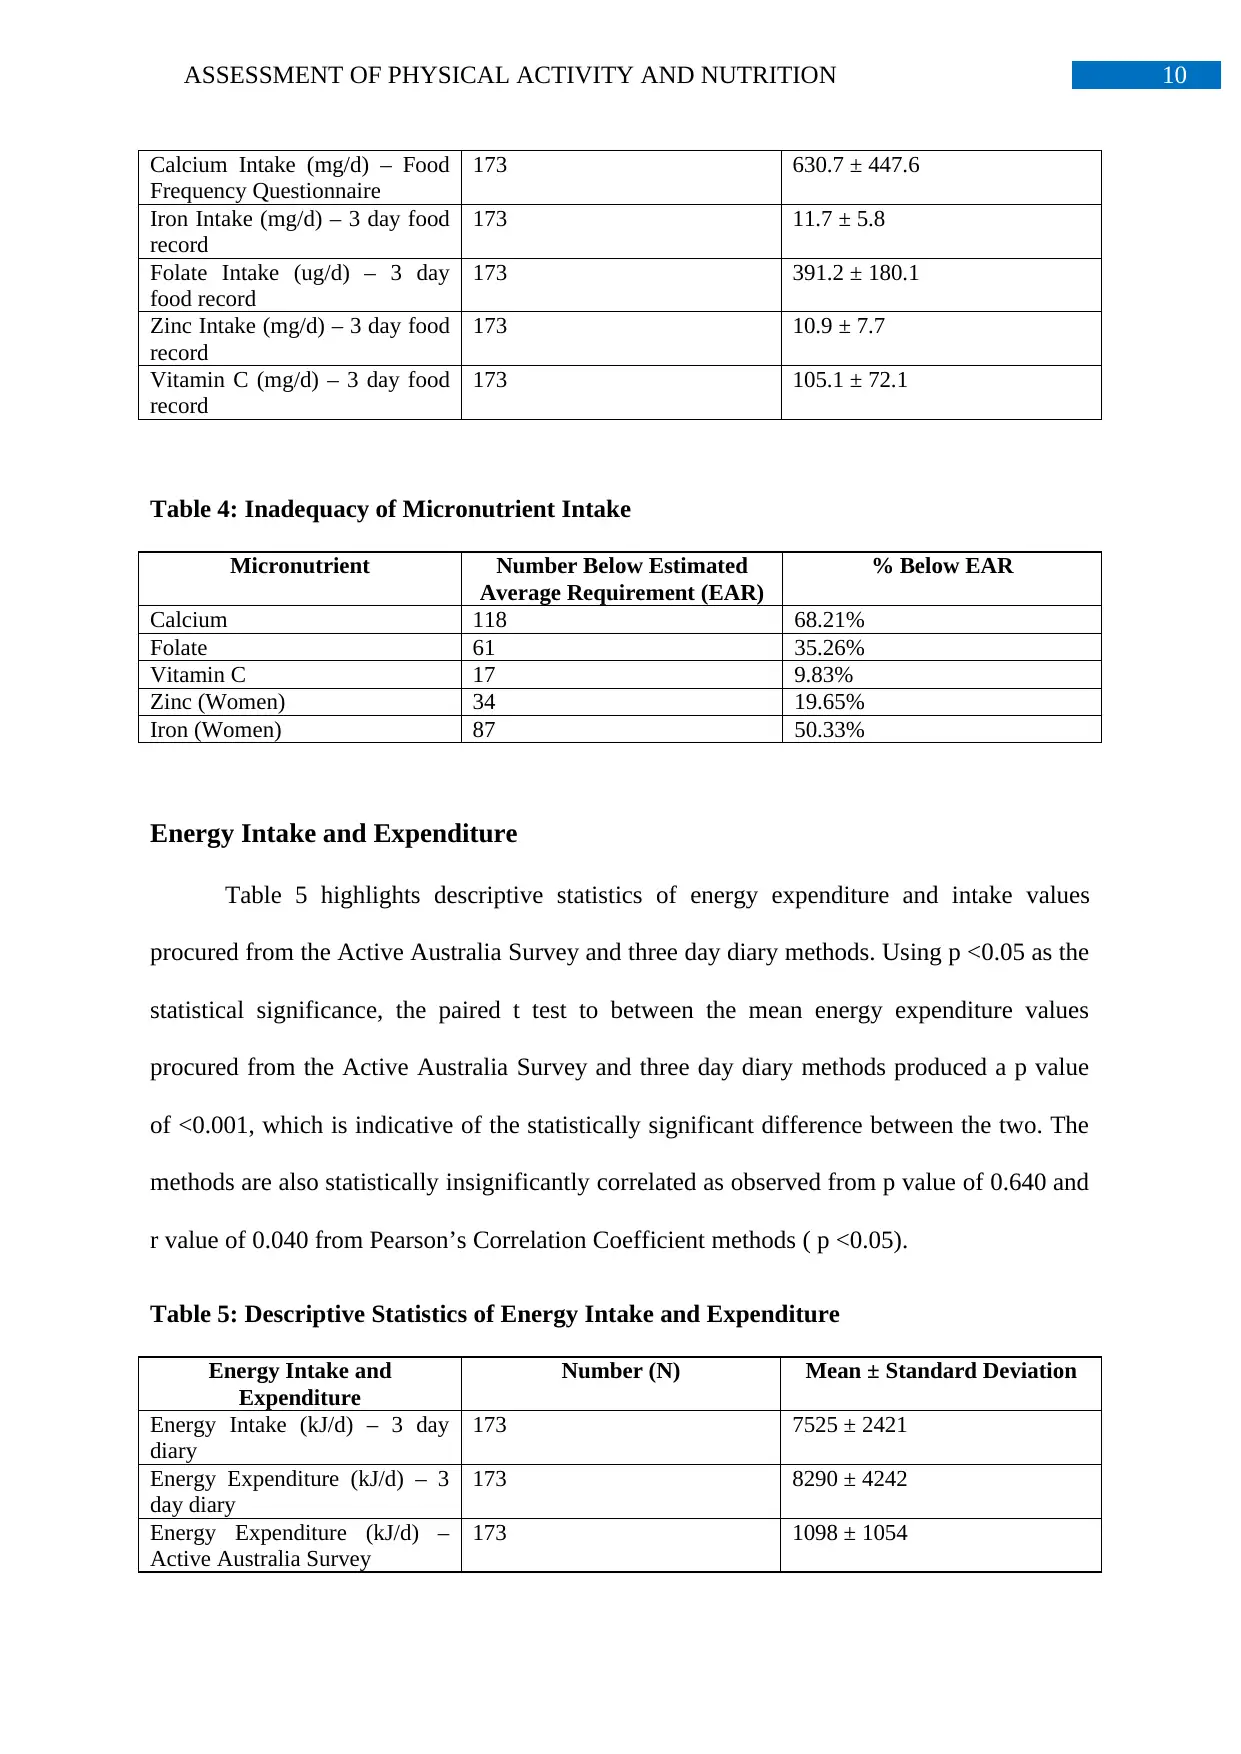
Calcium Intake (mg/d) – Food
Frequency Questionnaire
173 630.7 ± 447.6
Iron Intake (mg/d) – 3 day food
record
173 11.7 ± 5.8
Folate Intake (ug/d) – 3 day
food record
173 391.2 ± 180.1
Zinc Intake (mg/d) – 3 day food
record
173 10.9 ± 7.7
Vitamin C (mg/d) – 3 day food
record
173 105.1 ± 72.1
Table 4: Inadequacy of Micronutrient Intake
Micronutrient Number Below Estimated
Average Requirement (EAR)
% Below EAR
Calcium 118 68.21%
Folate 61 35.26%
Vitamin C 17 9.83%
Zinc (Women) 34 19.65%
Iron (Women) 87 50.33%
Energy Intake and Expenditure
Table 5 highlights descriptive statistics of energy expenditure and intake values
procured from the Active Australia Survey and three day diary methods. Using p <0.05 as the
statistical significance, the paired t test to between the mean energy expenditure values
procured from the Active Australia Survey and three day diary methods produced a p value
of <0.001, which is indicative of the statistically significant difference between the two. The
methods are also statistically insignificantly correlated as observed from p value of 0.640 and
r value of 0.040 from Pearson’s Correlation Coefficient methods ( p <0.05).
Table 5: Descriptive Statistics of Energy Intake and Expenditure
Energy Intake and
Expenditure
Number (N) Mean ± Standard Deviation
Energy Intake (kJ/d) – 3 day
diary
173 7525 ± 2421
Energy Expenditure (kJ/d) – 3
day diary
173 8290 ± 4242
Energy Expenditure (kJ/d) –
Active Australia Survey
173 1098 ± 1054
11ASSESSMENT OF PHYSICAL ACTIVITY AND NUTRITION
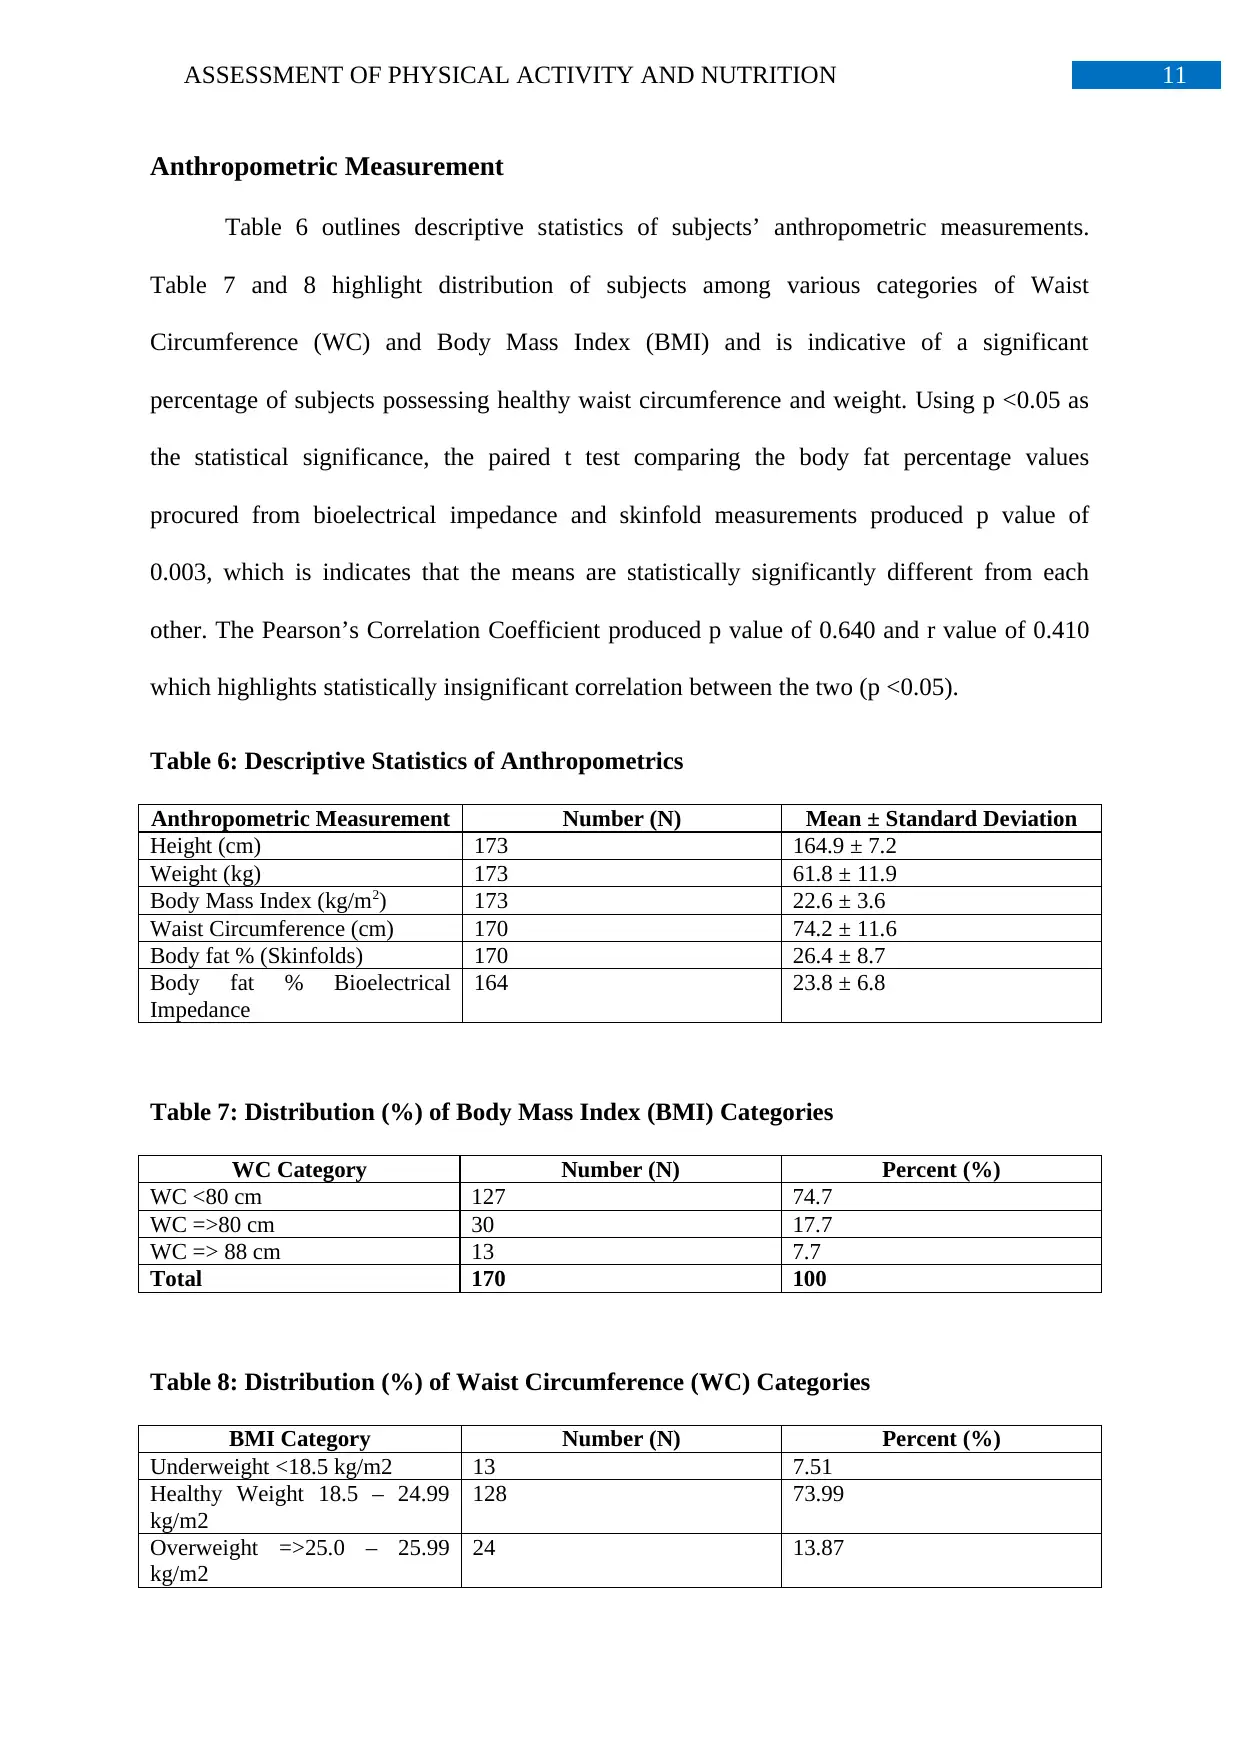
Anthropometric Measurement
Table 6 outlines descriptive statistics of subjects’ anthropometric measurements.
Table 7 and 8 highlight distribution of subjects among various categories of Waist
Circumference (WC) and Body Mass Index (BMI) and is indicative of a significant
percentage of subjects possessing healthy waist circumference and weight. Using p <0.05 as
the statistical significance, the paired t test comparing the body fat percentage values
procured from bioelectrical impedance and skinfold measurements produced p value of
0.003, which is indicates that the means are statistically significantly different from each
other. The Pearson’s Correlation Coefficient produced p value of 0.640 and r value of 0.410
which highlights statistically insignificant correlation between the two (p <0.05).
Table 6: Descriptive Statistics of Anthropometrics
Anthropometric Measurement Number (N) Mean ± Standard Deviation
Height (cm) 173 164.9 ± 7.2
Weight (kg) 173 61.8 ± 11.9
Body Mass Index (kg/m2) 173 22.6 ± 3.6
Waist Circumference (cm) 170 74.2 ± 11.6
Body fat % (Skinfolds) 170 26.4 ± 8.7
Body fat % Bioelectrical
Impedance
164 23.8 ± 6.8
Table 7: Distribution (%) of Body Mass Index (BMI) Categories
WC Category Number (N) Percent (%)
WC <80 cm 127 74.7
WC =>80 cm 30 17.7
WC => 88 cm 13 7.7
Total 170 100
Table 8: Distribution (%) of Waist Circumference (WC) Categories
BMI Category Number (N) Percent (%)
Underweight <18.5 kg/m2 13 7.51
Healthy Weight 18.5 – 24.99
kg/m2
128 73.99
Overweight =>25.0 – 25.99
kg/m2
24 13.87
⊘ This is a preview!⊘
Do you want full access?
Subscribe today to unlock all pages.
Trusted by 1+ million students worldwide
1 out of 23
Related Documents


Your All-in-One AI-Powered Toolkit for Academic Success.
+13062052269
info@desklib.com
Available 24*7 on WhatsApp / Email
![[object Object]](/_next/static/media/star-bottom.7253800d.svg)
Unlock your academic potential
Copyright © 2020–2026 A2Z Services. All Rights Reserved. Developed and managed by ZUCOL.