Service Attributes Affecting PickMe Customer Satisfaction Analysis
VerifiedAdded on 2022/05/26
|21
|5676
|38
Report
AI Summary
This report investigates the service attributes influencing customer satisfaction and repeat purchases within the context of PickMe, a transportation service in Sri Lanka. The research explores the impact of factors such as safety, pricing, convenience, and the role of Information and Communication Technology (ICT) on customer perceptions and behaviors. The study employs a quantitative research approach, collecting data through questionnaires distributed to PickMe users in the Kandy and Colombo districts. The findings reveal a significant influence of the identified service attributes on customer satisfaction and the likelihood of repeat purchases, emphasizing the importance of service improvements to meet consumer demands. The report also highlights the role of ICT in the transportation and tourism industries, underscoring its impact on sustainable development. The analysis includes descriptive statistics, a literature review, and a discussion of implications and conclusions, providing valuable insights for PickMe operators and the broader transportation sector.
Service Attribute factors affecting
Customer Satisfaction and Repeat
Purchases
Page
1
Customer Satisfaction and Repeat
Purchases
Page
1
Paraphrase This Document
Need a fresh take? Get an instant paraphrase of this document with our AI Paraphraser
Table of Contents
ABSTRACT....................................................................................................................................2
CHAPTER 1....................................................................................................................................3
INTRODUCTION...........................................................................................................................3
1.1 Role of the Transport Industry...............................................................................................3
1.2 Role of PickMe in the Transport industry of Sri Lanka.........................................................3
CHAPTER 2....................................................................................................................................4
2.0 LITREATURE REVIEW..........................................................................................................4
2.1 Customer Satisfaction............................................................................................................4
2.2 Information Communications Technology (ICT)..................................................................5
2.3 Repeat purchases...................................................................................................................6
2.4 Safety.....................................................................................................................................6
2.5 Price.......................................................................................................................................6
2.6 Convenience..........................................................................................................................7
2.7 CHAPTER SUMMERY........................................................................................................7
CHAPTER 3....................................................................................................................................8
3.0 CHAPTER INTRODUCTION..................................................................................................8
3.1 Conceptual Framework..........................................................................................................8
3.2 Dependent Variable...............................................................................................................8
3.3 Independent Variable.............................................................................................................8
3.4 Hypothesis.............................................................................................................................8
3.5 Methodology.........................................................................................................................9
3.52 Sampling Method................................................................................................................9
3.53 Data Collection....................................................................................................................9
3.55 Limitations.......................................................................................................................10
CHAPTER 4.....................................................................................................................................11
DATA INTERPRETATION AND ANALYSIS...........................................................................11
4.1 Descriptive Statistics...........................................................................................................12
4.1.0 Safety............................................................................................................................12
4.1.1 Price..............................................................................................................................12
4.1.2 Convenience.................................................................................................................13
4.1.3 Customer Satisfaction...................................................................................................13
4.1.4 Repeat Purchases..........................................................................................................14
Page
2
CHAPTER 5..................................................................................................................................15
5.0 IMPLICATIONS AND CONCLUSION.................................................................................15
5.1 Implication and Conclusion.................................................................................................15
5.2 Drawbacks...........................................................................................................................16
CHAPTER 6..................................................................................................................................17
6.0 CONCLUSION AND RECOMMENEDATIONS..................................................................17
REFERENCES..............................................................................................................................18
Page
3
⊘ This is a preview!⊘
Do you want full access?
Subscribe today to unlock all pages.
Trusted by 1+ million students worldwide
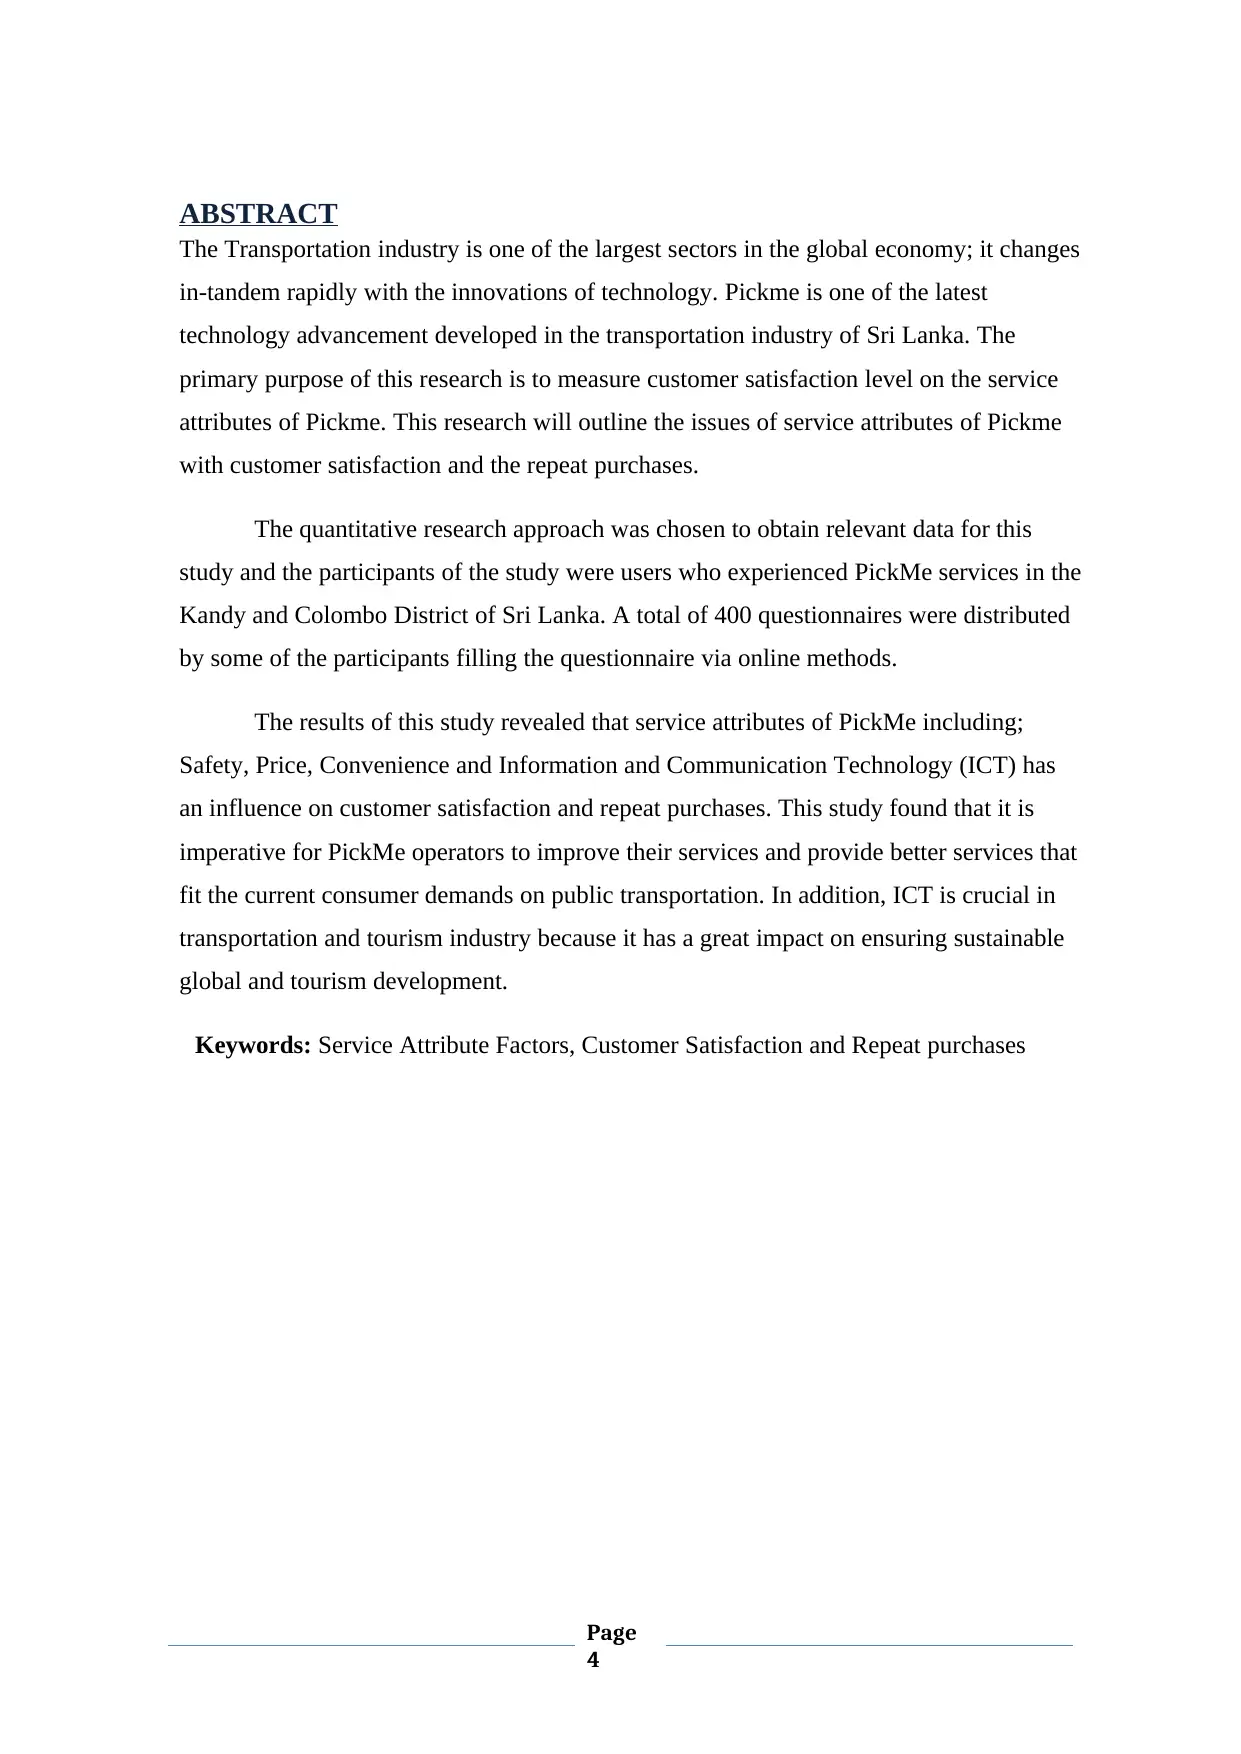
ABSTRACT
The Transportation industry is one of the largest sectors in the global economy; it changes
in-tandem rapidly with the innovations of technology. Pickme is one of the latest
technology advancement developed in the transportation industry of Sri Lanka. The
primary purpose of this research is to measure customer satisfaction level on the service
attributes of Pickme. This research will outline the issues of service attributes of Pickme
with customer satisfaction and the repeat purchases.
The quantitative research approach was chosen to obtain relevant data for this
study and the participants of the study were users who experienced PickMe services in the
Kandy and Colombo District of Sri Lanka. A total of 400 questionnaires were distributed
by some of the participants filling the questionnaire via online methods.
The results of this study revealed that service attributes of PickMe including;
Safety, Price, Convenience and Information and Communication Technology (ICT) has
an influence on customer satisfaction and repeat purchases. This study found that it is
imperative for PickMe operators to improve their services and provide better services that
fit the current consumer demands on public transportation. In addition, ICT is crucial in
transportation and tourism industry because it has a great impact on ensuring sustainable
global and tourism development.
Keywords: Service Attribute Factors, Customer Satisfaction and Repeat purchases
Page
4
Paraphrase This Document
Need a fresh take? Get an instant paraphrase of this document with our AI Paraphraser
CHAPTER 1
Chapter Introduction
In this chapter it will be giving a picture on the background of the company and the
background of its operating industry. The research problem is identified and has detailed
out the influences and its background. Also the researcher has developed the Research
Questions in respective to the Research objectives.
INTRODUCTION
1.1 Role of the Transport Industry
Transportation is a fundamental driver of the tourism industry as it is a precondition
for travel since it facilitates mobility and the movement of tourists from their place of
origin (i.e., their home area) to their destination and vice versa. Concerning this
statement, it can be seen that transportation has a symbiotic relationship with tourism
in which one cannot occur without the other, and the two are co-dependent. Taxis, in
various forms and with various names, have been around for at least several centuries.
Modern taxis are generally considered to have evolved from the horse-drawn
carriages for hire in Paris and London in the mid-1600s. Ridesharing companies like
PickMe and Uber, are activated by using a Smartphone app to match consumers
requesting rides with drivers that will take them there. Since its inception in 2015,
PickMe has gained significant market share in Sri Lanka. (PickMe)
The advancement in technologies has delivered new trends in almost anything,
transportation included, in this modern era. Nowadays, people start to look into the latest
and latest trend to go about their daily life. Transportation wise, the growth in technology
has transformed the customer's preferences to use PickMe services over any other mode
of transportations.
1.2 Role of PickMe in the Transport industry of Sri Lanka.
The PickMe software platform facilitates and enables a real time connection between the
taxi passenger and the taxi driver, creating a mutual engagement for the receipt and
delivery of a seamless service. PickMe has now opened up its operations by linking with
other organisations to deliver the products ordered by its respective customers.
Page
5
CHAPTER 2
CHAPTER INTRODUCTION
This chapter is giving the maximum understanding on the problem and the insight of new factors
conducted in relation to the research problem. And also theories are identified to develop the
conceptual frame work of the operation. In this chapter, the literature review is done on the basis
of the independent variables.
2.0 LITREATURE REVIEW
2.1 Customer Satisfaction
It is essential to any business entity to satisfy every customer who uses the products or
services offered by them. According to Oliver (1999), customer satisfaction is a vital
indicator of a company’s past, current, and future performance and, hence, marketing
experts and scholars has been critically focusing on this since long ago. There are two
general conceptualizations of satisfaction that exist in the literature which are
transaction-specific satisfaction and cumulative satisfaction in modeling satisfaction
(Anderson & Fornell, 1993; Boulding, Kalra, Staelin, & Zeithhaml, 1993). In the
transaction-specific perspective, satisfaction is transient (Cronin & Taylor, 1992).
Conversely, Cumulative satisfaction is a customer’s evaluation of the total utilization
involvement with a product or service to date, which directly affects post-purchase
phenomena such as attitude change, repeat purchase and brand loyalty (Johnson &
Fornell, 1991). It is common to associate satisfaction with emotional affluence
among individual who is experiencing a situation that leads to behavioral intentions.
As an example, Oliver (1993) argued that positive and negative affective
responses were partial by consumer attributions about overall customer satisfaction.
The contradiction between prior expectation and actual performance is a function of
disconfirmation that results in customer dissatisfaction (Bolton & Drew, 1991). For
instance, it has been shown that dissatisfied customers generally tend to complain to
the establishment or are trying to find redress from them more regularly to relieve
cognitive dissonance and failed consumption experiences (Oliver, 1987; Nyer,
1999). Dissatisfaction can prompt customers spreading out negative outcomes also
known as negative word of mouth. If the management does not review back their
business, this situation can become worst and affect their performance. Unsatisfied
Page
6
⊘ This is a preview!⊘
Do you want full access?
Subscribe today to unlock all pages.
Trusted by 1+ million students worldwide
customers will become a saboteur, and at the same time, they will discourage
potential customers from entering the business. The customers’ evaluation of service
quality, purchase intentions and behavior will influence customer satisfaction.
According to Lacobucci et al. (1994), empirical studies had shown that the key
difference between service quality and customer satisfaction is that quality relates to
managerial delivery of the service while satisfaction reflects customers’ experiences
with that service. Sivadas and Baker-Prewitt (2000), suggested that if improvements
of product quality are not based on customer needs, it will not lead to an
improvement in customer satisfaction. Increased customer satisfaction leads to
decreased customer complaints and increased customer loyalty (Fornel &
Wernerfelt, 1998).
According to Anderson and Fornell (2000), to create satisfied customers is the
reason behind the existence of business and competition. Those companies that
excel at satisfying their customers will attract investors. Gilbert et al. (2004) said
that the number of services and goods the company produced would not lead it to
success as much as their satisfied customers because these customers will return and
keep the business growing. Customer satisfaction is essential in marketing. Thus, the
satisfying customer is very important for a varied reason.
2.2 Information Communications Technology (ICT)
The word “Information and Communications Technology (ICT)” is frequently
utilized as a part of a wide sense to depict an arrangement of heterogeneous media
transmission and data advancements that take into account electronic
communication, data collection and processing in distribution networks (Black
&Geenhuizen, 2006; Giannopoulos, 2004; Wang et al., 2015). ICT has presented the
chances to establish new or more efficient markets, especially for transport services.
One example, for instance, is operative shared rides and access to cars or bikes
vehicles (Resnick, 2004). Chan and Shaheen (2012) stated that the key to these new
services of achievement is the new markets across the local geographies which could
be set up by utilizing ICT.
According to Cohen (2002), ICT at present has been categorized by the
dynamic mechanical changes with fast reception and infiltration rates; diminishing
expenses for new equipment and features and quickly expanding the scope of
utilization and entrance in numerous domains of expert and individual life. The
production and facilities package which depend on the range of human resources,
Page
7
Paraphrase This Document
Need a fresh take? Get an instant paraphrase of this document with our AI Paraphraser
skill qualities and additionally an intertwined institutional market region as the
private sector appearing in decreasingly regulated surroundings also has been
characterized in ICT (Cohen et al., 2002).
2.3 Repeat purchases
Repeat purchases is similarly referred to as repurchase intention in which it can
be described as having the intention to buy or use an organization’s product/service
more frequently in the future (Garbarino & Johnson, 1999; Zhang & Bloemer,
2008). According to Lacey and Morgan (2009), it is a person’s judgments on buying
again a delegated product or service from the identical company, taking into account
his or her current situation and likely circumstances. The repurchase is described as
a purchaser’s real behavior resulting in the acquisition of the identical service or
product on multiple occasions.
2.4 Safety
Safety is one essential aspect that is considered by customers when riding a taxi. An
essential factor that can attract customers to take PickMe service is safety inspection.
Rules and regulation are all prepared to make sure the protection proof PickMe’s
customers. Before the drivers were given the license, they have to obtain the
authorization to sit for the driver examination first. The most important aspect is
there is no criminal record, and the driver must prove certificate liability insurance.
According to Ngo (2015) “the types, model, and vehicle condition, the actual point-
to-point route that the car follows, the minimum fuel efficiency standard and data
reporting, the car should not be more than 5 years and the requirements for
monitoring and evaluation were few of the many conditions that the car registered
for PickMe have to comply with. Furthermore, Brazil and Kirk (2016) had
mentioned that PickMe service decreases drunken driving accident.”
Customers have to choose the mode of payments in advance for their request in
PickMe Service, i.e. whether to pay by cash or bank card (Azmi et al., 2016). Also,
using the credit card as a mode of payment is far safer than using cash. The benefit for
travelers is to avoid getting an extra charge from the driver. According to Azmi et al.
(2016), the driver and passengers will be connected via Smartphone when using
PickMe; hence the passenger can engage and examine their driver before agreeing to
apply their service for extra safety.
2.5 Price
Page
8
Rates charged may vary from city to city. Regularly, taxi admission is costly
contrasted with PickMe (Rempel, 2016). Gabel (2016) additionally expressed that
the rates for an PickMe ride are less expensive than the taxi admission
notwithstanding when the charge is higher amid appeal periods. “Surge pricing” is
the point at which the clients charged for an upper fare. Before asking for the
pickups, the greater cost will be uncovered in the PickMe's application; this will help
the client decide whether to take the ride or use something else (Rempel, 2016).
“Surge pricing” is normally exceptional. Rempel (2016) likewise said a repercussion
that happened in March 2014 struck by PickMe benefit because of its surge
evaluating practice, "Surge Drop" notification has been actualized, the function is to
alarm travelers at whatever point there is a reduction in rates in their regions or area.
2.6 Convenience
The presence of PickMe or also known as an urban taxi in the city has prompted
a great concern over the increase in traffic congestion. Even though numerous
studies have deeply explored this issue, yet the discoveries are still unclear.
According to Li, Hong, and Zhang (2016) who researched this subject, one of the
findings was the usage of PickMe in urban territories prompts a considerable
diminishment in carbon dioxide discharges and traffic jam. Based on the same
research, PickMe can be a resolution to reduce the problem regarding traffic
congestion in the city areas, and it also provides further proof.
------------------------------------------------------------------------------------------------------------
2.7 CHAPTER SUMMERY
In this chapter, the literature is based on each independent variable to conduct the research
effectively and efficiently. And also the ideal theoretical frame work was found to be used
in developing the conceptual frame work of the research. The literature review is
identified according to the concept of the Service attribute factors that are likely to
influence the level of customer satisfaction and repeat purchases.
Page
9
⊘ This is a preview!⊘
Do you want full access?
Subscribe today to unlock all pages.
Trusted by 1+ million students worldwide
CHAPTER 3
3.0 CHAPTER INTRODUCTION
This chapter includes the identification of the variables of the problem and how they have
an impact to the problem causing an effect. The ways and the means of converting those
variables in to the observable entities and finally designing the ways and the means of
data collection and analysis.
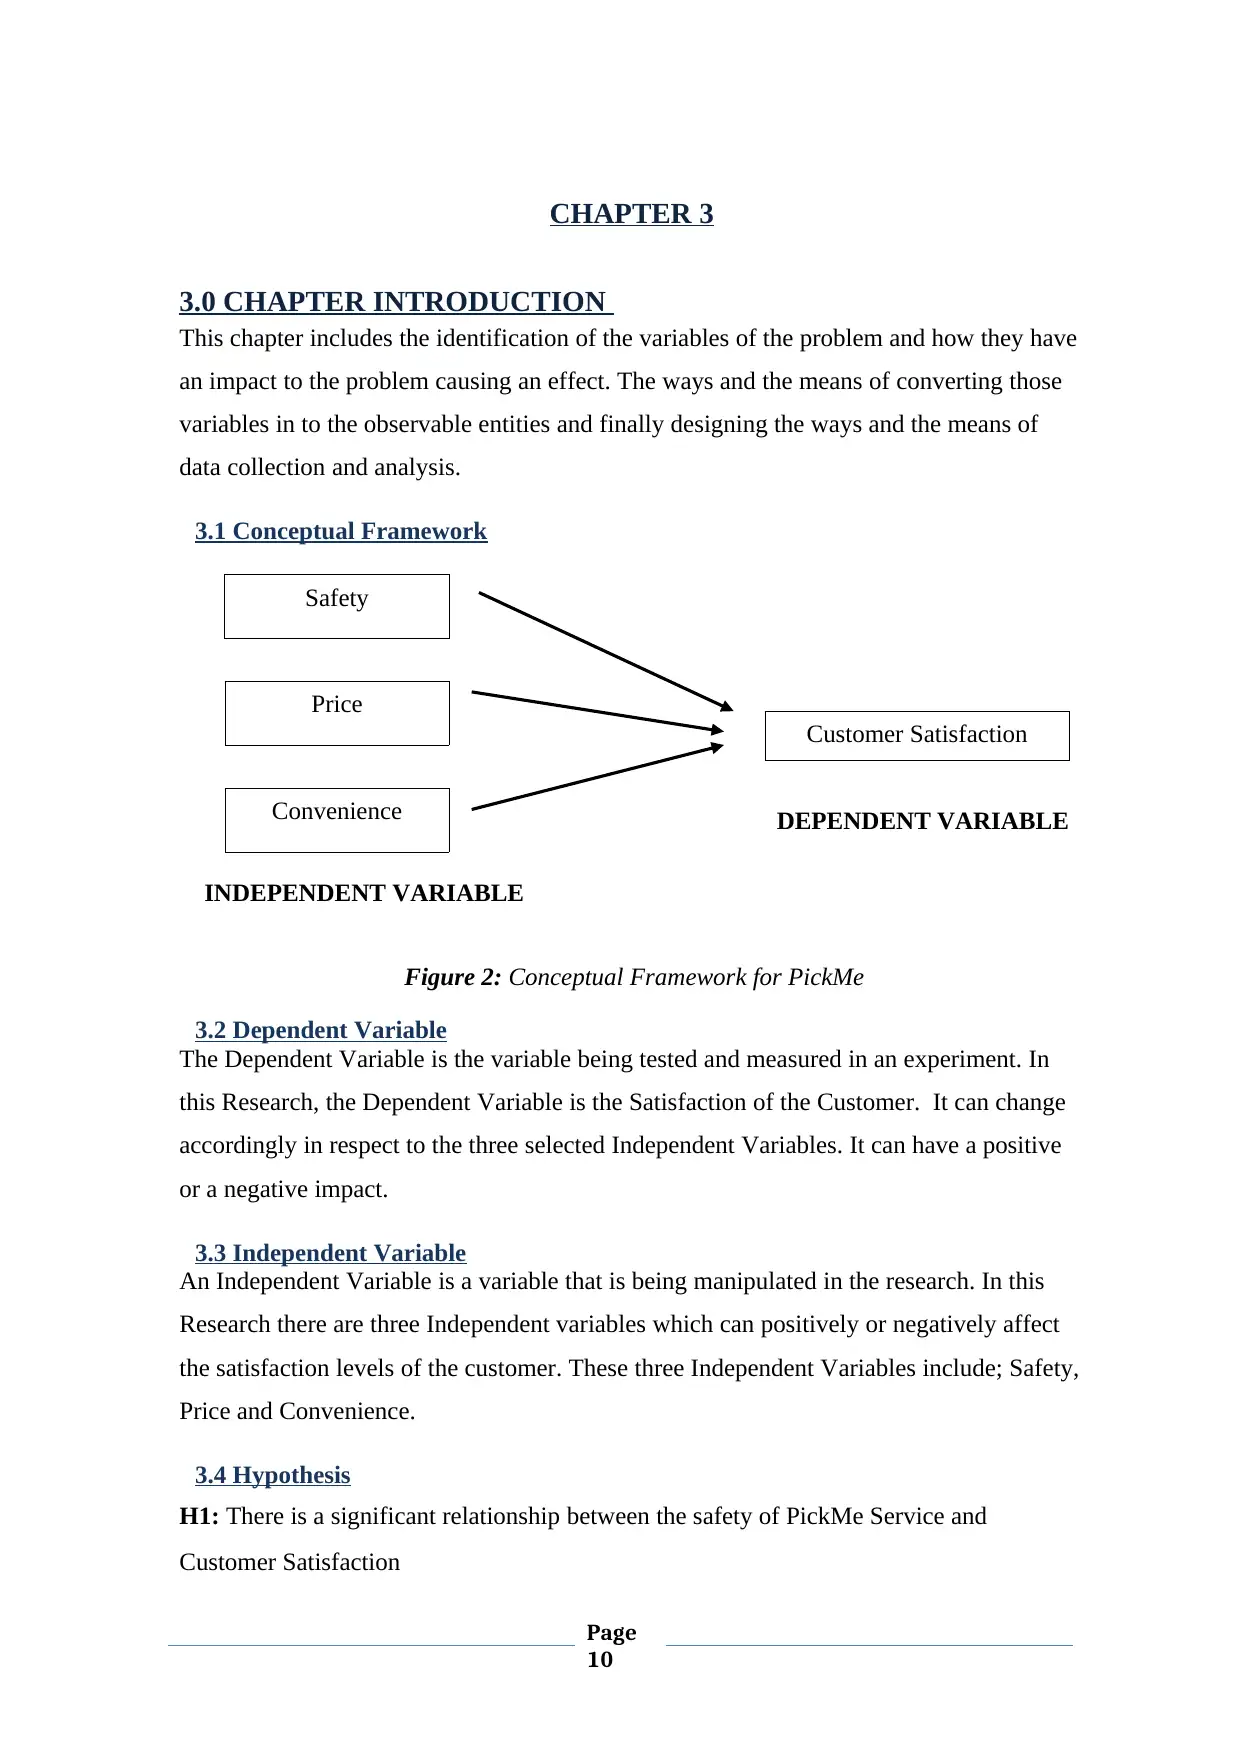
3.1 Conceptual Framework
Figure 2: Conceptual Framework for PickMe
3.2 Dependent Variable
The Dependent Variable is the variable being tested and measured in an experiment. In
this Research, the Dependent Variable is the Satisfaction of the Customer. It can change
accordingly in respect to the three selected Independent Variables. It can have a positive
or a negative impact.
3.3 Independent Variable
An Independent Variable is a variable that is being manipulated in the research. In this
Research there are three Independent variables which can positively or negatively affect
the satisfaction levels of the customer. These three Independent Variables include; Safety,
Price and Convenience.
3.4 Hypothesis
H1: There is a significant relationship between the safety of PickMe Service and
Customer Satisfaction
Safety
Price
Convenience
Customer Satisfaction
INDEPENDENT VARIABLE
DEPENDENT VARIABLE
Page
10
3.0 CHAPTER INTRODUCTION
This chapter includes the identification of the variables of the problem and how they have
an impact to the problem causing an effect. The ways and the means of converting those
variables in to the observable entities and finally designing the ways and the means of
data collection and analysis.
3.1 Conceptual Framework
Figure 2: Conceptual Framework for PickMe
3.2 Dependent Variable
The Dependent Variable is the variable being tested and measured in an experiment. In
this Research, the Dependent Variable is the Satisfaction of the Customer. It can change
accordingly in respect to the three selected Independent Variables. It can have a positive
or a negative impact.
3.3 Independent Variable
An Independent Variable is a variable that is being manipulated in the research. In this
Research there are three Independent variables which can positively or negatively affect
the satisfaction levels of the customer. These three Independent Variables include; Safety,
Price and Convenience.
3.4 Hypothesis
H1: There is a significant relationship between the safety of PickMe Service and
Customer Satisfaction
Safety
Price
Convenience
Customer Satisfaction
INDEPENDENT VARIABLE
DEPENDENT VARIABLE
Page
10
Paraphrase This Document
Need a fresh take? Get an instant paraphrase of this document with our AI Paraphraser
H2: There is a significant relationship between the Price charged of PickMe and
Customer Satisfaction.
H3: There is a significant relationship between the Convenience of PickMe Services and
return usage.
3.5 Methodology
3.51 Population
The descriptive cross-sectional design was used to investigate the relationship
between the service attributes of PickMe with customer satisfaction and return usage.
The respondents for this study were chosen among individuals who experienced the
services of PickMe at least once in the Colombo and Kandy Districts of Sri Lanka.
3.52 Sampling Method
A self-administrated survey was conducted for data collection. A total of 400
respondents who experienced the services of PickMe were chosen as the respondent
for this study participated in the survey comprising of 156 women and 244 men
through an online survey using Google docs. The convenience sampling technique
was used to select respondents by using an online survey questionnaire. As
suggested by Roscoe (1975), a sample of more than 30 and less than 500 is
sufficient for most research.
3.53 Data Collection
Ordinal and interval scale was used to collect data from the respondents.
Demographic variables were measured using an ordinal scale and marathon impact
using an interval scale. The questionnaire consisted of 3 sections and designed to
examine the relationship between service attributes of PickMe and customer
satisfaction. Section A was composed of demographic items, while items in Section
B explored the service attributes of PickMe and Section C relates to Customer
satisfaction and return usage of participants. All items in Section B and C was rated
using a five-point Likert Scale ranging from 1 (Strongly Disagree) to 5 (Strongly
Agree).
3.54 Data Analysis
Page
11
Data analysis was done by using the SPSS software (Statistical Package for Social
Sciences). Both descriptive and differential statics was used in performing the data
analysis. Descriptive analysis was used to compute the mean score and standard
deviation. Inferential statistics method of Multiple Regression was employed to
establish the relationship between all the variables in the study. Other suitable
statistical techniques were used as appropriate in answering the research objectives,
research questions, and hypotheses of this study.
3.55 Limitations
The current limitation of my research is that collection of sufficient data is doubtful. Due
to the concerns rising of the pandemic, more safety guidelines should be followed. Some
of the people may not want to respond to the survey and ignore.
----------------------------------------------------------------------------------------------------------
CHAPTER SUMMERY
In this chapter, the conceptual frame work is identified derived from the literature review
and the theory that can be use to understand the problem. Each independent variable is
used for testing the relation to the dependent variable of the research.
Page
12
⊘ This is a preview!⊘
Do you want full access?
Subscribe today to unlock all pages.
Trusted by 1+ million students worldwide
1 out of 21
Related Documents


Your All-in-One AI-Powered Toolkit for Academic Success.
+13062052269
info@desklib.com
Available 24*7 on WhatsApp / Email
![[object Object]](/_next/static/media/star-bottom.7253800d.svg)
Unlock your academic potential
Copyright © 2020–2026 A2Z Services. All Rights Reserved. Developed and managed by ZUCOL.