ACC00716 Finance: Investment Appraisal of Pinto Limited Project

Verified

Added on  2023/06/12

|8
|1837
|213
Report
AI Summary
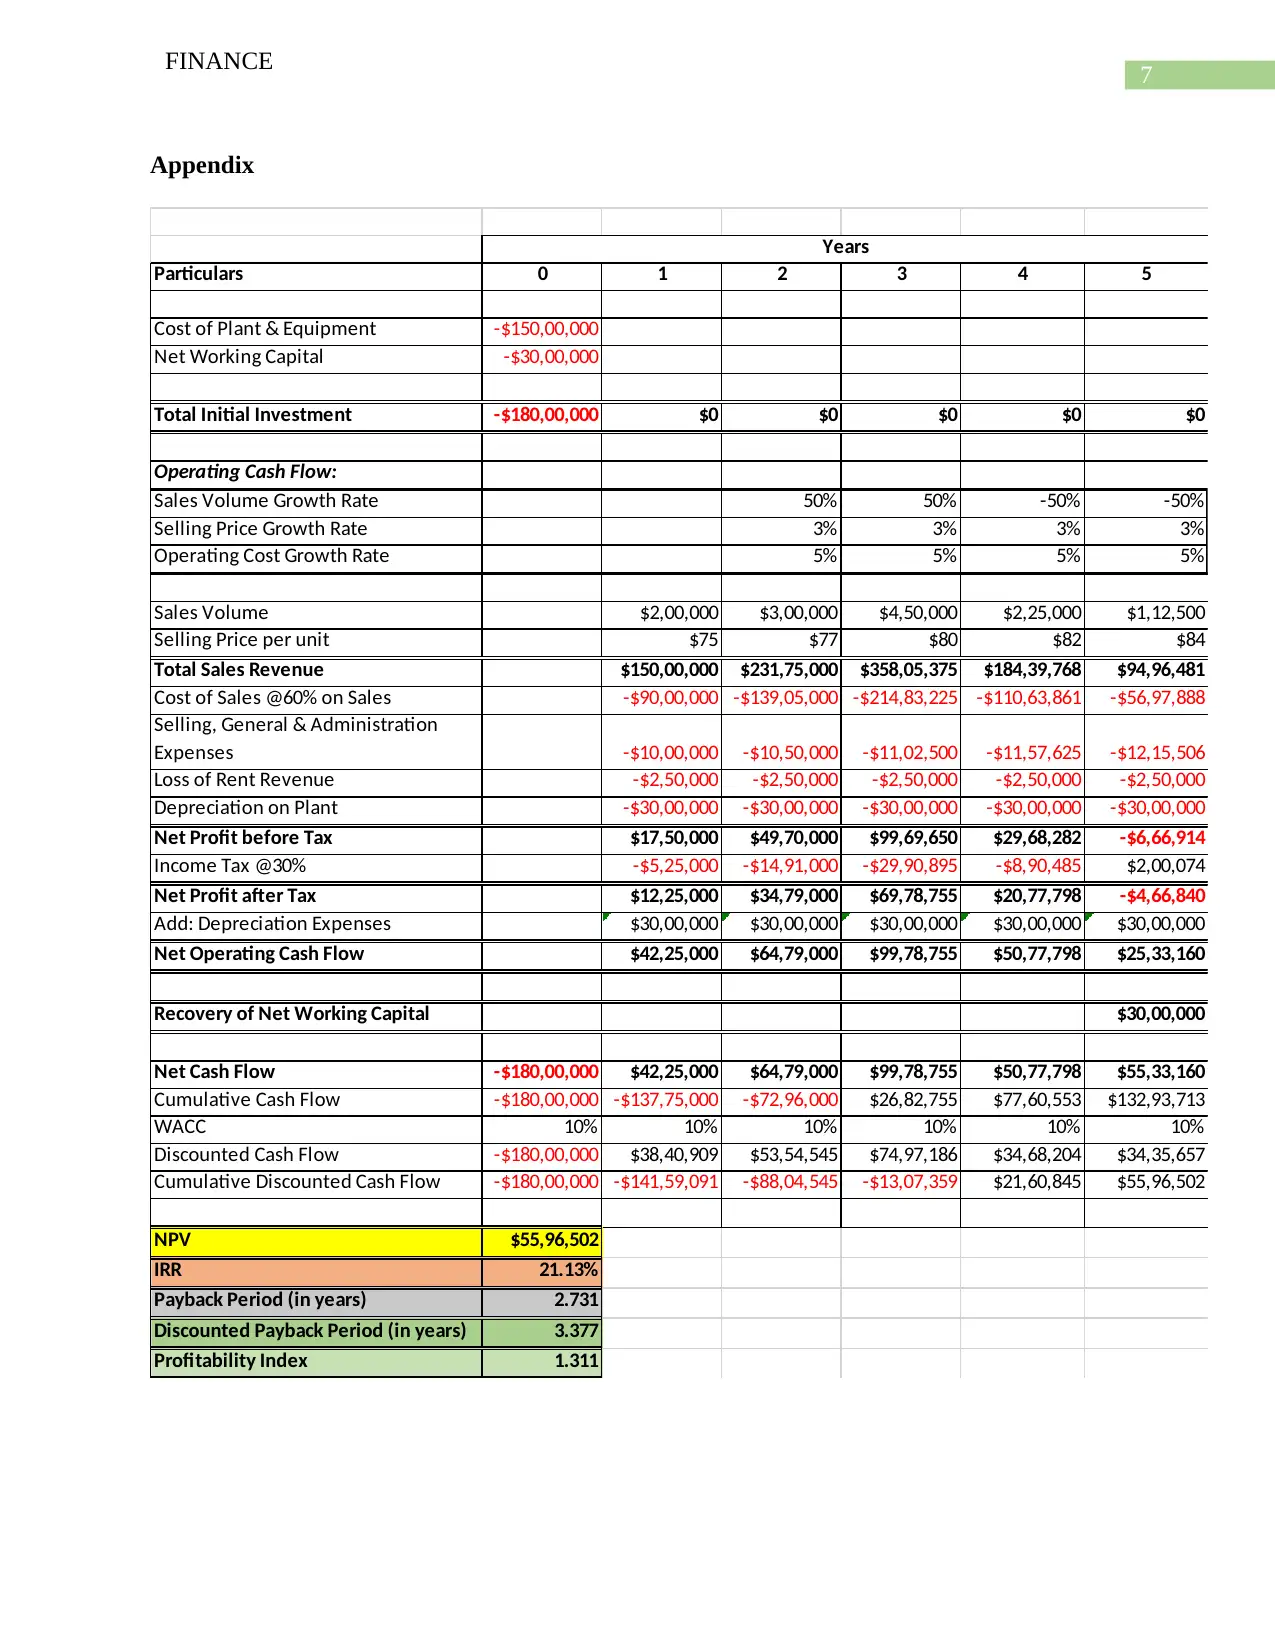
This report presents a financial analysis of Pinto Limited's proposed project, which involves entering a new product market. The analysis employs various capital budgeting techniques, including NPV, Profitability Index, Payback Period, Discounted Payback Period, and IRR, to assess the project's viability. The initial investment required is $180 million, covering plant and machinery and additional working capital. The analysis assumes increases in sales volume, sales price, and operating costs. The findings suggest that the project is financially sound, with a positive NPV of $55,96,502, a favorable Profitability Index, a payback period of 2.731 years, a discounted payback period of 3.377 years, and an IRR of 21.13%. The report recommends that Pinto Limited proceed with the project, while also suggesting strategies to enhance its profitability, such as cost reduction and aggressive sales strategies. Desklib provides students access to similar solved assignments.
Document Page
Running head: FINANCE
Finance
Name of the Student:
Name of the University:
Author’s Note:
tabler-icon-diamond-filled.svg

Paraphrase This Document

Need a fresh take? Get an instant paraphrase of this document with our AI Paraphraser
Document Page
1
FINANCE
Table of Contents
Memorandum...................................................................................................................................2
Findings and Recommendations......................................................................................................3
Reference.........................................................................................................................................6
Appendix..........................................................................................................................................7
Document Page
2
FINANCE
Memorandum
Memo to: Board of Directors
Company: Pinto Limited
From: Author
Subject: Capital Budgeting Techniques for the Project
Date: 25/04/2018
As per the case, the management of the Pinto ltd is planning to invest in a project which can
establish the company in a new product market. For the purpose of estimating the worth of
investing in the project, financial analysis of the same is to be conducted (Titman, Keown and
Martin 2017). For the purpose of undertaking the project, an investment worth $150,00,000 in
plant and machinery is to be made by the company. In addition to this, the company will be
requiring an additional working capital of $ 30,00,000. The total outflow of cash or initial
investment which the management of the company is require to make is about $ 180,00,000. The
various assumptions which are taken for the calculation and financial analysis are that the there
is an increase in the overall sales volume, sales price as well as the operating costs of the
company in relation to the new project. it is also assumed that the weighted average cost of
capital of the company is 10% and there is no change in the same over the period of five years.
For the purpose of financial analysis, the various techniques which are used are NPV
analysis, Profitability Index, Payback Period, Discounted Payback period and IRR approach. As
per the NPV analysis the net present value of the cash inflows from the project should be more
than the net present value of the cash outflow (Jain, Singh and Srivastava 2013). In the case of
the new project which the management of Pinto ltd is planning to invest in has a net present
value as calculated to about $ 55,96,502. As per profitability Index, the technique measures the
Document Page
3
FINANCE
profitability of the project in terms of the net cash outflow which the company had to incur for
the project (Pasqual, Padilla and Jadotte 2013). For the purpose of estimating the profitability
index of a project, the net present value of the project is to be divided by the net cash outflow of
the project. the main purpose of the profitability index is to identify the relation between the
costs which is incurred on the project and the benefits which are derived from the project. As the
profitability index is greater than 1, it signifies that the net cash inflow from the project is more
than the net cash outflow from the project. In cash of Payback period, the time period in which
the management of the company is able to retrieve the initial investment cost which the
management had incurred previously on the project. This is a useful method in estimating how
much time it will take the management of the company to recover the cost which was initially
used for investment in the project. In the case of the new project which Pinto ltd wants to invest
in, the payback period of the same is 2.731 years. The discounted payback technique is similar to
payback period which is used. The only difference is that it considers the discounting factor and
recognizes time value of money. In addition to this, the method provides a clear idea as to how
much time it will take to reach breakeven point of the project (Wang, Xia and Zhang 2014). The
discounted payback period for the project as estimated comes to 3.377 years. Internal Rate of
Return method is also used in the estimation of the worth of the project. In this method the
purpose is to find out the profitability of the project in which the company wants to make an
investment (Cuthbert and Magni 2016). The method considers the rate at which all cash flow
whether positive or negative becomes zero.
Findings and Recommendations
Thus, from the above discussion it is clear that the company plans to make an investment
in a project for which financial analysis of the same has been undertaken. As per the results of
tabler-icon-diamond-filled.svg

Paraphrase This Document

Need a fresh take? Get an instant paraphrase of this document with our AI Paraphraser
Document Page
4
FINANCE
the analysis it can be said that the management should accept the project as financial analysis of
the same has yielded positive results. The NPV analysis of the project shows that the net present
value of the project is much more than the cash outflow which is associated with the project
(Guerra, Magni and Stefanini 2014). This means that the project will be successful and as per
this technique the project must be accepted. As per the profitability index, a favourable result
should be greater than 1 which the project of the company has as per the calculation shown in the
appendix. The payback period and discounted payback period shows that the initial investment
which the company made in the plant and machinery and net working capital of the business is
recoverable by 2.731 years and 3.377 years respectively. The management can accept the project
as the payback period and discounted payback period of the project also shows a favourable
result. As per the IRR method, the company has an internal rate of return of 21.13% which is
also considered to be favourable considering the project (Magni 2013). Therefore, from the
analysis of the project with using different capital budgeting techniques, it can be said that the
management can safely invest in the project (Bhuller, Mogstad and Salvanes 2017). However,
the various assumptions which were made for the analysis of this project has to remain the same.
The various recommendation which can be given to the management for increasing the
profitability of the project are given below in points form:
ï‚· The management should consider reducing the costs which are incurred for the project
which will further reduce the payback and discounted payback period of a project and
make the project more attractive.
ï‚· The management should also consider to maximum sales to further improve the NPV
from the project. The analysis of the projects is done on the basis of assumption that the
sales volume and sales price will increase, but if the management follows aggressive
Document Page
5
FINANCE
sales strategy this can further be increased more than what is assumed and thereby
earning more revenues for the business.
Document Page
6
FINANCE
Reference
Bhuller, M., Mogstad, M. and Salvanes, K.G., 2017. Life-cycle earnings, education premiums,
and internal rates of return. Journal of Labor Economics, 35(4), pp.993-1030.
Cuthbert, J.R. and Magni, C.A., 2016. Measuring the inadequacy of IRR in PFI schemes using
profitability index and AIRR. International Journal of Production Economics, 179, pp.130-140.
Guerra, M.L., Magni, C.A. and Stefanini, L., 2014. Interval and fuzzy Average Internal Rate of
Return for investment appraisal. Fuzzy Sets and Systems, 257, pp.217-241.
Jain, N., Singh, S.N. and Srivastava, S.C., 2013. A generalized approach for DG planning and
viability analysis under market scenario. IEEE Transactions on Industrial Electronics, 60(11),
pp.5075-5085.
Magni, C.A., 2013. The internal rate of return approach and the AIRR paradigm: a refutation and
a corroboration. The Engineering Economist, 58(2), pp.73-111.
Pasqual, J., Padilla, E. and Jadotte, E., 2013. Equivalence of different profitability criteria with
the net present value. International Journal of Production Economics, 142(1), pp.205-210.
Titman, S., Keown, A.J. and Martin, J.D., 2017. Financial management: Principles and
applications. Pearson.
Wang, B., Xia, X. and Zhang, J., 2014. A multi-objective optimization model for the life-cycle
cost analysis and retrofitting planning of buildings. Energy and Buildings, 77, pp.227-235.
tabler-icon-diamond-filled.svg

Paraphrase This Document

Need a fresh take? Get an instant paraphrase of this document with our AI Paraphraser
Document Page
7
FINANCE
Appendix
Particulars 0 1 2 3 4 5
Cost of Plant & Equipment -$150,00,000
Net Working Capital -$30,00,000
Total Initial Investment -$180,00,000 $0 $0 $0 $0 $0
Operating Cash Flow:
Sales Volume Growth Rate 50% 50% -50% -50%
Selling Price Growth Rate 3% 3% 3% 3%
Operating Cost Growth Rate 5% 5% 5% 5%
Sales Volume $2,00,000 $3,00,000 $4,50,000 $2,25,000 $1,12,500
Selling Price per unit $75 $77 $80 $82 $84
Total Sales Revenue $150,00,000 $231,75,000 $358,05,375 $184,39,768 $94,96,481
Cost of Sales @60% on Sales -$90,00,000 -$139,05,000 -$214,83,225 -$110,63,861 -$56,97,888
Selling, General & Administration
Expenses -$10,00,000 -$10,50,000 -$11,02,500 -$11,57,625 -$12,15,506
Loss of Rent Revenue -$2,50,000 -$2,50,000 -$2,50,000 -$2,50,000 -$2,50,000
Depreciation on Plant -$30,00,000 -$30,00,000 -$30,00,000 -$30,00,000 -$30,00,000
Net Profit before Tax $17,50,000 $49,70,000 $99,69,650 $29,68,282 -$6,66,914
Income Tax @30% -$5,25,000 -$14,91,000 -$29,90,895 -$8,90,485 $2,00,074
Net Profit after Tax $12,25,000 $34,79,000 $69,78,755 $20,77,798 -$4,66,840
Add: Depreciation Expenses $30,00,000 $30,00,000 $30,00,000 $30,00,000 $30,00,000
Net Operating Cash Flow $42,25,000 $64,79,000 $99,78,755 $50,77,798 $25,33,160
Recovery of Net Working Capital $30,00,000
Net Cash Flow -$180,00,000 $42,25,000 $64,79,000 $99,78,755 $50,77,798 $55,33,160
Cumulative Cash Flow -$180,00,000 -$137,75,000 -$72,96,000 $26,82,755 $77,60,553 $132,93,713
WACC 10% 10% 10% 10% 10% 10%
Discounted Cash Flow -$180,00,000 $38,40,909 $53,54,545 $74,97,186 $34,68,204 $34,35,657
Cumulative Discounted Cash Flow -$180,00,000 -$141,59,091 -$88,04,545 -$13,07,359 $21,60,845 $55,96,502
NPV $55,96,502
IRR 21.13%
Payback Period (in years) 2.731
Discounted Payback Period (in years) 3.377
Profitability Index 1.311
Years
chevron_up_icon
1 out of 8
circle_padding
hide_on_mobile
zoom_out_icon
[object Object]