Financial Feasibility Report: Pinto Ltd Machinery Investment Analysis
VerifiedAdded on 2021/12/16
|5
|1541
|75
Report
AI Summary
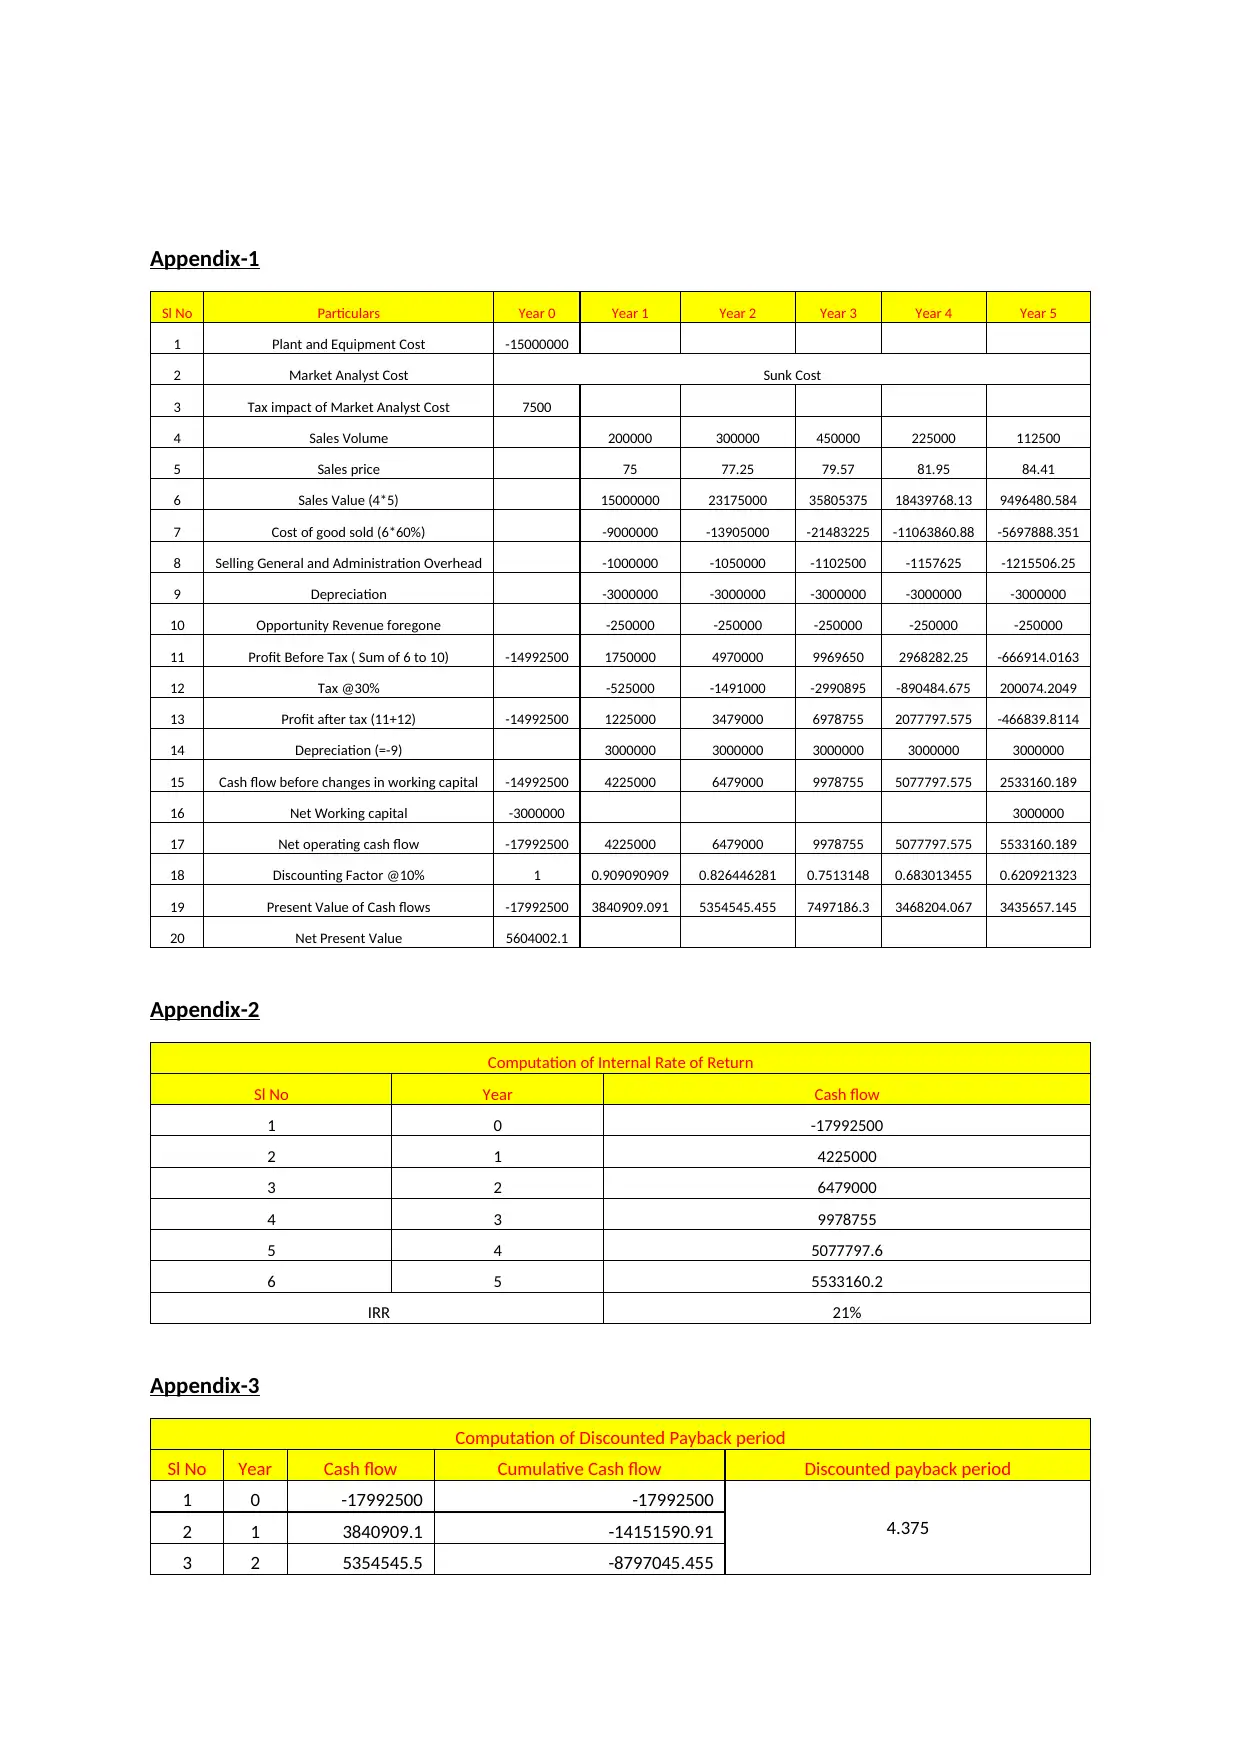
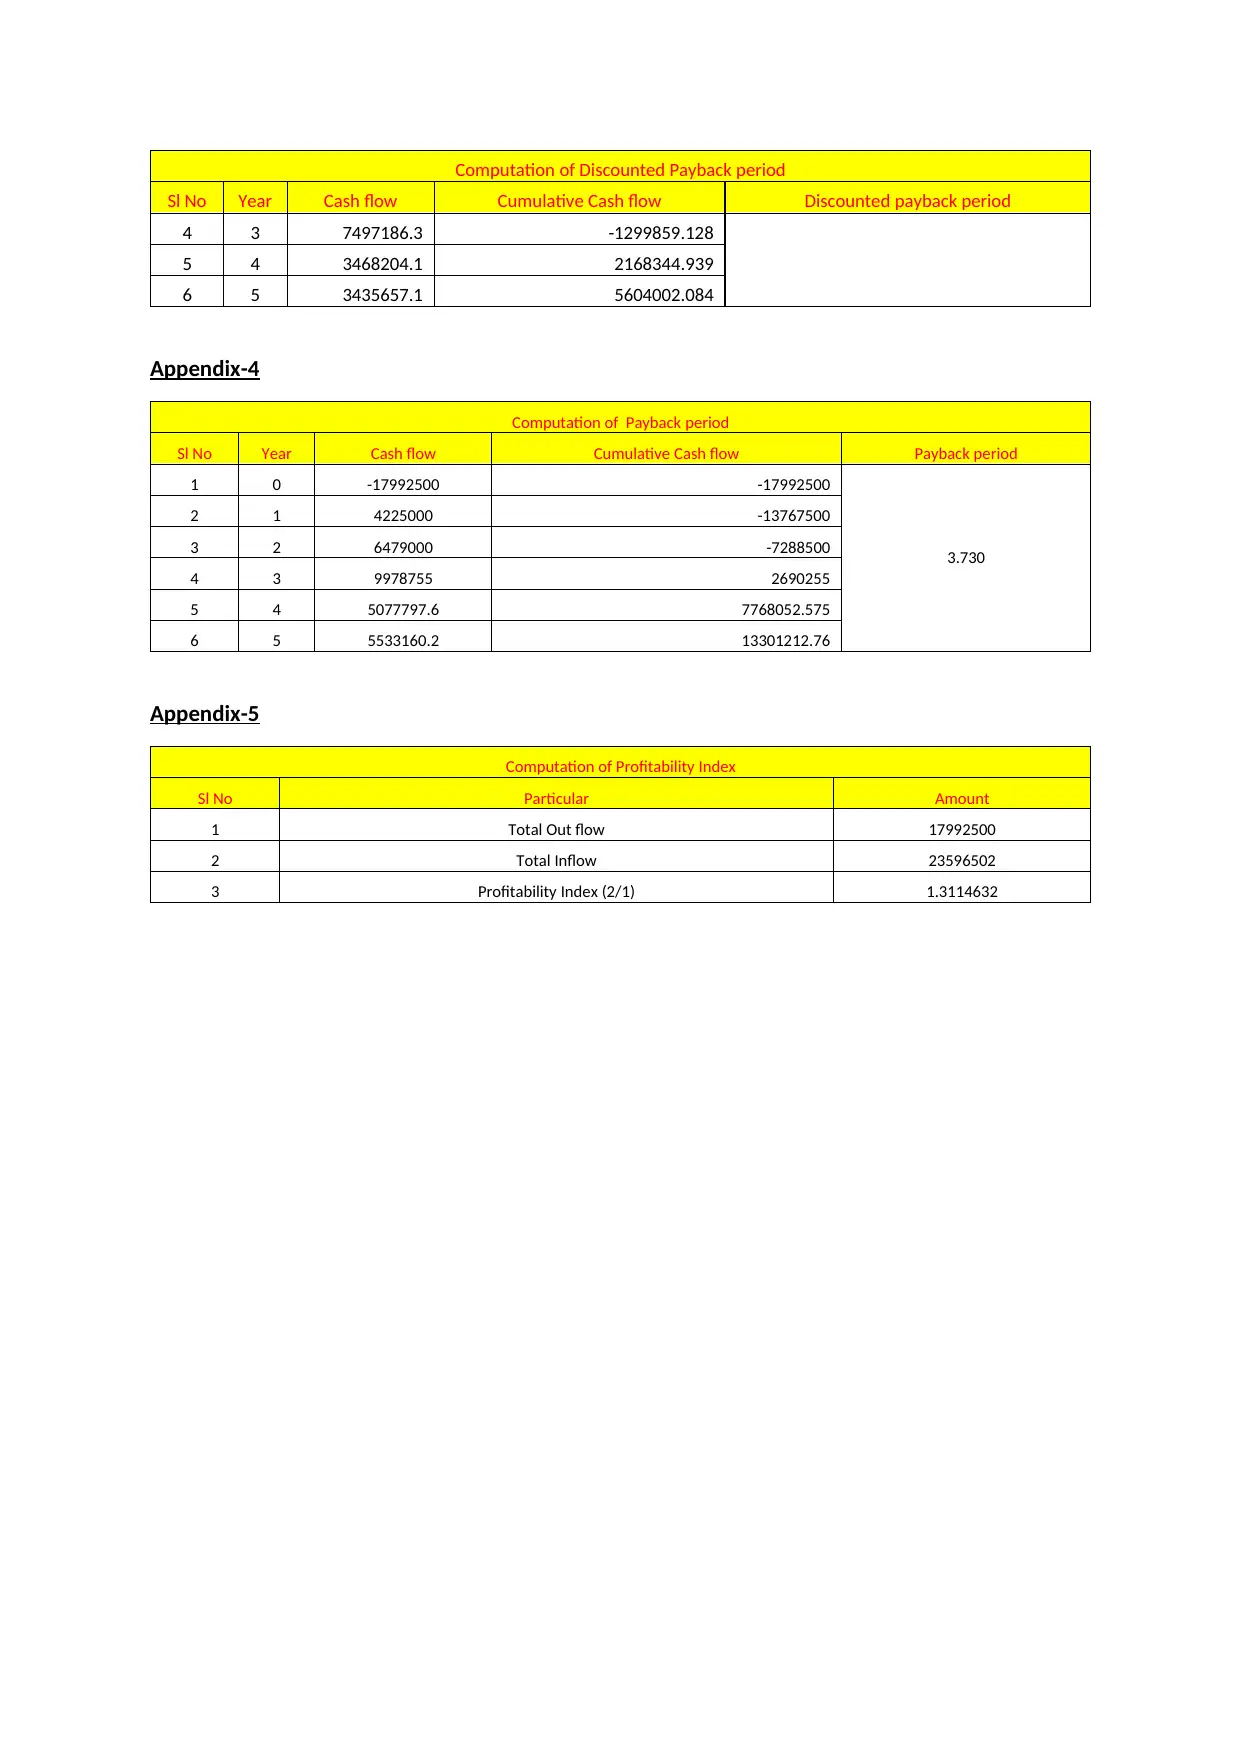
This report presents a financial analysis of Pinto Limited's proposed machinery investment, undertaken to combat competition. The analysis employs several financial tools, including Net Present Value (NPV), Internal Rate of Return (IRR), Payback Period, Discounted Payback Period, and Profitability Inde...
Read More
Contribute Materials
Your contribution can guide someone’s learning journey. Share your
documents today.

Purpose
The report has been written with the purpose to analyse the proposed investment project in the
hand of the company regarding installation of machinery. The analysis involves the feasibility of the
project via various financial analysis tools like Net Present Value, Internal Rate of Return, Payback
Period, Discount Payback period and Profitability Index.
Introduction
The company i.e. Pinto Limited is proposing to introduce a new machinery at a total cost of $ 15
Million with an intention to combat with intense competition faced from overseas competitors. The
company wishes to undertake a financial analysis on the basis of different parameters like Net
Present Value, Internal Rate of Return, Payback Period, Discount Payback period and Profitability
Index.
Assumptions Undertaken
The analysis has been undertaken based on the following assumptions:
(a) Initial investment of Million $ 15 has been undertaken in year 0;
(b) Consultant fees is a sunk cost and accordingly not relevant for the purpose of analysis;
(c) The tax benefit on the consultant fees has been considered for the purpose of analysis;
(d) Asset has been depreciated using Straight Line Method over 5 years of life of asset;
(e) The project life is 5 years and post that asset shall not be useful;
(f) The Quantity of sales has been estimated at 2,00,000 units for first year which shall increase by
50% for first two years and then shall decrease by 50% for next two years on account of
saturation and competition;
(g) The sales price of product shall undergo a change of 3% year on year in the positive direction;
(h) The cost of good sold has been estimated at 60% of the sales revenues year on year basis for
the purpose of analysis;
(i) Selling, General and Administrative Expenses have been estimated at $ 1 Million for 1st year and
increase by 5% on year on year basis;
(j) Opportunity revenue foregone in the form of rent of building has been estimated at $ 2,50,000
per year on year on year basis;
(k) Upfront investment in working capital shall be required to the tune of 20% of sales revenue of
first year and the same is realised by the end of project.
(l) The weighted average cost of capital of the company is taken at 10% for the purpose of
analysis.
Key Analysis
Net Present Value:
This is one of the significant financial analysis tool for the purpose of analysing the feasibility of the
project based on cash flows generated from the project. Under the said method of computation, the
present value of both inflows and outflows of a project are taken into consideration Further, the
rate of discounting is used to discount the cash flows is taken at 10%. The formula for computation
of net present value has been presented here-in-below:
Net Present Value= Present Value of Cash Flow- Present Value of Cash Outflows.
Further, the higher the net present value the more feasible the project shall be.
Secure Best Marks with AI Grader
Need help grading? Try our AI Grader for instant feedback on your assignments.

On the basis of above details, the net present value of the project has been computed at $ 56,04,002
which is significantly high. Hence, company shall accept the project based on the analysis. The
detailed computation has been enclosed herewith and marked as Appendix-1.
Internal Rate of Return
The Internal Rate of Return is one of the significant financial analysis tool under which the feasibility
of project is determined on the basis of computation of internal rate of return whereby the rate of
return computed if exceeds the weighted cost of capital, the project shall be feasible. If the reverse
happens, the project shall not be feasible.
Under the said financial analysis tool, the formula for computation of internal rate of return has
been presented here-in-below:
Internal Rate of Return= Discounting Factor at which the present value of cash outflows = Present
Value of cash inflows.
Further, the higher the internal rate of return the more feasible the project shall be.
On the basis of above details, the internal rate of return of the project has been computed at 21%
which is significantly high. Hence, company shall accept the project based on the analysis. The
detailed computation has been enclosed herewith and marked as Appendix-2.
Discounted Payback Period
The discounted payback period is one of the significant financial analysis tool under which the
feasibility of project is determined on the basis of computation of time period under which the
present value of outflow shall be realised.
Under the said financial analysis tool, the formula for computation of discounted Payback period has
been presented here-in-below:
Discounted Payback Period = Time period under which the discounted cumulative present value of
inflow = Discounted cumulative cash outflows.
Further, the lower the discounted payback period the more feasible the project shall be and vice
versa.
On the basis of above details, the discounted payback period of the project has been computed at
4.38 years which is significantly high. Hence, company shall consider before accepting the project
based on the analysis. The detailed computation has been enclosed herewith and marked as
Appendix-3.
Payback Period
The payback period is one of the significant financial analysis tool under which the feasibility of
project is determined on the basis of computation of time period under which the outflow shall be
realised.
Under the said financial analysis tool, the formula for computation of Payback period has been
presented here-in-below:
Payback Period = Time period under which the discounted cumulative inflow = Discounted
cumulative cash outflows.
which is significantly high. Hence, company shall accept the project based on the analysis. The
detailed computation has been enclosed herewith and marked as Appendix-1.
Internal Rate of Return
The Internal Rate of Return is one of the significant financial analysis tool under which the feasibility
of project is determined on the basis of computation of internal rate of return whereby the rate of
return computed if exceeds the weighted cost of capital, the project shall be feasible. If the reverse
happens, the project shall not be feasible.
Under the said financial analysis tool, the formula for computation of internal rate of return has
been presented here-in-below:
Internal Rate of Return= Discounting Factor at which the present value of cash outflows = Present
Value of cash inflows.
Further, the higher the internal rate of return the more feasible the project shall be.
On the basis of above details, the internal rate of return of the project has been computed at 21%
which is significantly high. Hence, company shall accept the project based on the analysis. The
detailed computation has been enclosed herewith and marked as Appendix-2.
Discounted Payback Period
The discounted payback period is one of the significant financial analysis tool under which the
feasibility of project is determined on the basis of computation of time period under which the
present value of outflow shall be realised.
Under the said financial analysis tool, the formula for computation of discounted Payback period has
been presented here-in-below:
Discounted Payback Period = Time period under which the discounted cumulative present value of
inflow = Discounted cumulative cash outflows.
Further, the lower the discounted payback period the more feasible the project shall be and vice
versa.
On the basis of above details, the discounted payback period of the project has been computed at
4.38 years which is significantly high. Hence, company shall consider before accepting the project
based on the analysis. The detailed computation has been enclosed herewith and marked as
Appendix-3.
Payback Period
The payback period is one of the significant financial analysis tool under which the feasibility of
project is determined on the basis of computation of time period under which the outflow shall be
realised.
Under the said financial analysis tool, the formula for computation of Payback period has been
presented here-in-below:
Payback Period = Time period under which the discounted cumulative inflow = Discounted
cumulative cash outflows.

Further, the lower the discounted payback period the more feasible the project shall be and vice
versa.
On the basis of above details, the payback period of the project has been computed at 3.73 years
which is significantly high. Hence, company shall consider before accepting the project based on the
analysis. The detailed computation has been enclosed herewith and marked as Appendix-4.
Profitability Index
The Profitability Index is one of the significant financial analysis tool under which the feasibility of
project is determined by dividing the present value of inflows by present value of outflows.
Under the said financial analysis tool, the formula for computation of Profitability Index has been
presented here-in-below:
Profitability Index = Net Present Value of cash inflows/ net present value of cash outflows
Further, the higher the profitability Index the more feasible the project shall be and vice versa.
On the basis of above details, the profitability index of the project has been computed at 1.32 which
is significantly high. Hence, company shall accept the project based on the analysis. The detailed
computation has been enclosed herewith and marked as Appendix-5.
Conclusion
The project shall be accepted based on above analysis.

Appendix-1
Sl No Particulars Year 0 Year 1 Year 2 Year 3 Year 4 Year 5
1 Plant and Equipment Cost -15000000
2 Market Analyst Cost Sunk Cost
3 Tax impact of Market Analyst Cost 7500
4 Sales Volume 200000 300000 450000 225000 112500
5 Sales price 75 77.25 79.57 81.95 84.41
6 Sales Value (4*5) 15000000 23175000 35805375 18439768.13 9496480.584
7 Cost of good sold (6*60%) -9000000 -13905000 -21483225 -11063860.88 -5697888.351
8 Selling General and Administration Overhead -1000000 -1050000 -1102500 -1157625 -1215506.25
9 Depreciation -3000000 -3000000 -3000000 -3000000 -3000000
10 Opportunity Revenue foregone -250000 -250000 -250000 -250000 -250000
11 Profit Before Tax ( Sum of 6 to 10) -14992500 1750000 4970000 9969650 2968282.25 -666914.0163
12 Tax @30% -525000 -1491000 -2990895 -890484.675 200074.2049
13 Profit after tax (11+12) -14992500 1225000 3479000 6978755 2077797.575 -466839.8114
14 Depreciation (=-9) 3000000 3000000 3000000 3000000 3000000
15 Cash flow before changes in working capital -14992500 4225000 6479000 9978755 5077797.575 2533160.189
16 Net Working capital -3000000 3000000
17 Net operating cash flow -17992500 4225000 6479000 9978755 5077797.575 5533160.189
18 Discounting Factor @10% 1 0.909090909 0.826446281 0.7513148 0.683013455 0.620921323
19 Present Value of Cash flows -17992500 3840909.091 5354545.455 7497186.3 3468204.067 3435657.145
20 Net Present Value 5604002.1
Appendix-2
Computation of Internal Rate of Return
Sl No Year Cash flow
1 0 -17992500
2 1 4225000
3 2 6479000
4 3 9978755
5 4 5077797.6
6 5 5533160.2
IRR 21%
Appendix-3
Computation of Discounted Payback period
Sl No Year Cash flow Cumulative Cash flow Discounted payback period
1 0 -17992500 -17992500
4.3752 1 3840909.1 -14151590.91
3 2 5354545.5 -8797045.455
Secure Best Marks with AI Grader
Need help grading? Try our AI Grader for instant feedback on your assignments.

Computation of Discounted Payback period
Sl No Year Cash flow Cumulative Cash flow Discounted payback period
4 3 7497186.3 -1299859.128
5 4 3468204.1 2168344.939
6 5 3435657.1 5604002.084
Appendix-4
Computation of Payback period
Sl No Year Cash flow Cumulative Cash flow Payback period
1 0 -17992500 -17992500
3.730
2 1 4225000 -13767500
3 2 6479000 -7288500
4 3 9978755 2690255
5 4 5077797.6 7768052.575
6 5 5533160.2 13301212.76
Appendix-5
Computation of Profitability Index
Sl No Particular Amount
1 Total Out flow 17992500
2 Total Inflow 23596502
3 Profitability Index (2/1) 1.3114632
1 out of 5
Related Documents

Your All-in-One AI-Powered Toolkit for Academic Success.
+13062052269
info@desklib.com
Available 24*7 on WhatsApp / Email
Unlock your academic potential
© 2024 | Zucol Services PVT LTD | All rights reserved.