Environmental Management Report: Pittwater Estuarine System
VerifiedAdded on 2020/05/08
|18
|4185
|113
Report
AI Summary
This report examines the environmental management of the Pittwater Estuarine System, focusing on the application of the ASMITA model. It provides an overview of key environments, including tidal ranges and water levels, and discusses various processes such as hydraulic, water quality, sedimentary, ecological, and human usage processes. The report analyzes the data input for the ASMITA model, including SCAPE wave conditions, water levels, and joint probabilities. It also details the data output and its relationship to key environments, illustrating how the model predicts morphological changes based on sea-level variations. The advantages and disadvantages of the ASMITA model are discussed, along with an example application. The report concludes by highlighting the model's role in predicting estuary behavior and developing risk mitigation plans. This report is a valuable resource for understanding environmental management strategies in coastal regions.
Running Head: ENVIRONMENTAL MANAGEMENT
Environmental Management for Sustainable Development
Student’s name:
Institution Affiliation:
Environmental Management for Sustainable Development
Student’s name:
Institution Affiliation:
Paraphrase This Document
Need a fresh take? Get an instant paraphrase of this document with our AI Paraphraser
ENVIRONMENTAL MANAGEMENT
Table of Contents
Abstract............................................................................................................................................3
Introduction......................................................................................................................................4
Key Environments.......................................................................................................................5
Key Processes (Council, 2002)....................................................................................................5
Hydraulic Processes.................................................................................................................5
Water Quality Processes..........................................................................................................6
Sedimentary Processes.............................................................................................................6
Ecological Processes................................................................................................................6
Human Usage Processes..........................................................................................................7
The data input..................................................................................................................................7
The SCAPE wave conditions...................................................................................................7
The SCAPE wave levels..........................................................................................................8
Joint Probabilities....................................................................................................................8
Time series Extension..............................................................................................................8
The data output............................................................................................................................8
The relationship between processed, data and key environments...............................................9
Sea-level, no morphological change........................................................................................9
Sea-level, morphological change.............................................................................................9
The advantages of ASMITA model...........................................................................................10
The disadvantages of ASMITA model......................................................................................11
An example ASMITA model.....................................................................................................11
1. There was sediment rule similar to Langstone Harbour..............................................12
1
ENVIRONMENTAL MANAGEMENT
1. Fine deposit conveyed into harbour on inundation tides; coarse sediment moves
seaward to form ebb-tidal delta.............................................................................................12
The Pittwater estuary to sea level rise (2100)................................................................................13
Discussion......................................................................................................................................13
Conclusion.....................................................................................................................................15
2
⊘ This is a preview!⊘
Do you want full access?
Subscribe today to unlock all pages.
Trusted by 1+ million students worldwide
ENVIRONMENTAL MANAGEMENT
Abstract
The report is compiled by Pittwater Estuarine System on the Environmental Management for
Sustainable Development. Pittwater is located near the mouth of the Hawkesbury Nepean River
system. The Pittwater waterway focuses on leisure, tourism, business and important
environmental assets (Birch, Gunns, & Olmos, 2015). The Pittwater has various processes that
are geared toward maintaining the system. These methods are divided into hydraulic processes,
physical processes, water quality processes, human usage processes, sedimentary processes and
ecological processes. There are also key environments that affect the system. This report will be
analysing the way ASMITA model relate to the key environments, processes and the data as
ephasised by (Townend et al., 2017). The report is limited to Pittwater Estuarine system in
Australia. Pittwater being a semi-develop tide-ruled suffocated valley estuary is situated around
40 kilometres (25 mi) north of the Sydney focal business locale, New South Wales, Australia;
being one of the waterways that different more prominent Metropolitan Sydney from the Central
Coast.
3
Paraphrase This Document
Need a fresh take? Get an instant paraphrase of this document with our AI Paraphraser
ENVIRONMENTAL MANAGEMENT
Introduction
As a person concerned with administration and maintenance of industry, you are expected to
comprehend on the risks involved in complex collaborations between the natural, physical,
social, economic and political part of the organisation. The methodologies involved in this
particular activity are essential for explaining the major natural and maintainability issues
confronting the processes. There is along these lines a need of superior comprehension of the
multidisciplinary interrelationships between reasonable advancement, human wellbeing, and
nature.
Sea course designs impact atmosphere and climate. Researchers have cautioned of the likelihood,
affected by environmental change, of a sudden environmental change. For examples, a sea
streams that could modify the atmosphere in a few areas of the globe is of major concern
(Cooper & Sheets, 2012). Major human ecological effects happen in the more livable districts of
the sea borders – the estuaries, coastline, and bayous. Ten for every penny of the total populace –
around 600 million individuals – live in low-lying regions helpless against ocean level ascent.
Patterns of worry that require administration include over-angling; coral fading because of sea
warming and sea fermentation because of expanding levels of breaking down carbon dioxide,
and ocean level ascent because of environmental change. Helpful procedures include an
administration set aside for ensuring no waste products on the site, statutory control of
overfishing; and maintainable aquaculture and fishing mechanism, depletion of non-renewable
energy source outflows and rebuilding of beachfront and another marine territory Pittwater
Estuarine System (Paalvast & van der Velde, 2014).
4
ENVIRONMENTAL MANAGEMENT
Various processes are involved in Pittwater Estuarine System. These processes are focused
toward maintaining the system. The environment at Pittwater is very important especially to the
hosts. Some of the Key environments are discussed below as well as the key processes involved
in the system.
Key Environments
The key Environments in the ASMITA model (Rosigleyse et al., 2016) include;
1. The tidal range (H). The tidal range takes records the range of the tide at a particular time.
Every tide has different range measure.
2. The mean high waters (MHW). The mean high waters record how high the water reaches
during the tide occurrence.
3. The mean low water (MLW). The mean low water takes in the lowest height reached by the
tide.
4. The area at the mean high water represented by (Ab ). The area is the average area covered by
the tide.
5. Vc is the volume of the channel
6. (Vf) is the volume of the flats
Key Processes (Council, 2002)
Hydraulic Processes
The hydraulic process is motivated by the limited capacity of the intertidal tide which increases
into Broken Bay and Brisbane water. The importance of sea wave with respect to the hydraulic
process is by the wave happening at the lower side from the northern end as it is constrained.
Catchment streams to the estuary have no negligible impacts on water-powered procedures on
the estuary, and therefore the stratification forms the negligible impact on the estuary.
5
⊘ This is a preview!⊘
Do you want full access?
Subscribe today to unlock all pages.
Trusted by 1+ million students worldwide
ENVIRONMENTAL MANAGEMENT
Water Quality Processes
Water quality processes techniques happening at Pittwater are managed by an extensive grouping
of catchment, oceanic and estuarine systems (Ji, 2016). As a rule, the estuary is overpowered by
tidal inflows and surges, and also commitments inside the catchment from both diffuse and point
foundations. Data exhibits that the water eminence in damp atmosphere conditions has every one
of the reserves of being an issue for shorelines and embayment, mainly from a human prosperity
perception. Litter was routinely detected along the dimension of the foreshore. Noteworthy
locales of litter fuse portions of the southern shore and Carmel Bay.
Sedimentary Processes
Critical parts of the associated sedimentation exhibit are laid out quickly underneath. A sum of
26 disintegrating locales was perceived around Pittwater (Mosher et al., 2017). Evaluation of the
reasons for separating and their comparative reality shows that Boat Wash-down is one of the
essential drivers of disintegrating inside Pittwater. Additional crucial explanations behind
foreshore separating merge draft carried waves, swift releases related with storm-water outlets,
and open riparian entrance to the foreshore. These areas are masterminded in the direction of the
south of Pittwater, where the greater bit of cruising, bay, and business sculling action happens,
which contrasts and the district where tidal flushing isn't as persuading at evacuating
contaminants. Specifically, the range in the south-east of the estuary is strikingly polluted.
Ecological Processes
Ecological Processes that are identified at Pittwater include; Historical clearing of vegetation and
urban change in the incorporating catchment has achieved lifted deposit weights to the estuary
making antagonistic affects estuarine biota, for instance, seagrass. The zones between Mona
Vale and Careel Bay have the best influence on sedimentation inside Pittwater. Sedimentation
6
Paraphrase This Document
Need a fresh take? Get an instant paraphrase of this document with our AI Paraphraser
ENVIRONMENTAL MANAGEMENT
has also inclined wetland domains in Carmel Bay, where it has influenced mangroves to take out
saltmarsh. Storm-water overflow inputs in like manner impression on water quality and estuarine
organic groups.
Human Usage Processes
The human usage processes support the atypical state of water use including a different range of
convoluted recreational exercises, an extensive variety of canoeing exercises and an economic
activity such as fishery. Swipe bays possess twenty-five percent of the conduit, for the most part,
along with the eastern, southwestern and southern shores. There is rivalry among client bunches
for the conduit asset, and subsequently, some contention exists between these gatherings.
The data input
In the ASMITA model, there are various input data involved in this process. These include;
1. SCAPE wave conditions
2. SCAPE water levels
3. Joint probabilities
4. Time series extension
The SCAPE wave conditions
These conditions is projected by the utilisation of the numerical model HANDWAVE. This
specific model conjectures the wave development by the under breeze activity, and it requires
data on measured breezes and the get over which the tide was produced. The SCAPE wave
condition is investigated concerning both the seaward wave conditions and furthermore the close
shore wave conditions (Kozlovsky & Grobman, 2017).
7
ENVIRONMENTAL MANAGEMENT
The SCAPE wave levels
The water levels are used as input data by the ASMITA demonstrates. Wallingford evaluated the
water levels through a ten year of successive hourly water level data which was recorded. The
extraordinary esteem were determined by the utilisation of another strategy by Dixon together
with Tawh.
Joint Probabilities
The approach of this input data is to permit the mix of the outrageous water level expectations
with extraordinary wave forecasts to infer general extraordinary ocean conditions with given
joint return periods. The water level and the wave are used to partner with the date and time
which at that point makes the time arrangement input.
Time series Extension
This sort input was required for the turn-up phase of morphological demonstrating. In the
estimation of this sort of contribution, there is the aggregation of sets of long stretches of the
output data portraying coupled waves and water levels. A long time series are the created by
haphazardly testing complete time structures.
The data output
The data output received from the ASMITA model should use by the management team to
predict the future of the estuary. In a position where a coupled system model has been used, an
extensive number of yield data is used as a consolidated turn-up period. The consequent
parameters are isolated into two classes which join; float and estuary (Duong et al., 2017). Those
parameters related with a float are; shoreline volumes, shoreline position, and withdraw rates,
8
⊘ This is a preview!⊘
Do you want full access?
Subscribe today to unlock all pages.
Trusted by 1+ million students worldwide
ENVIRONMENTAL MANAGEMENT
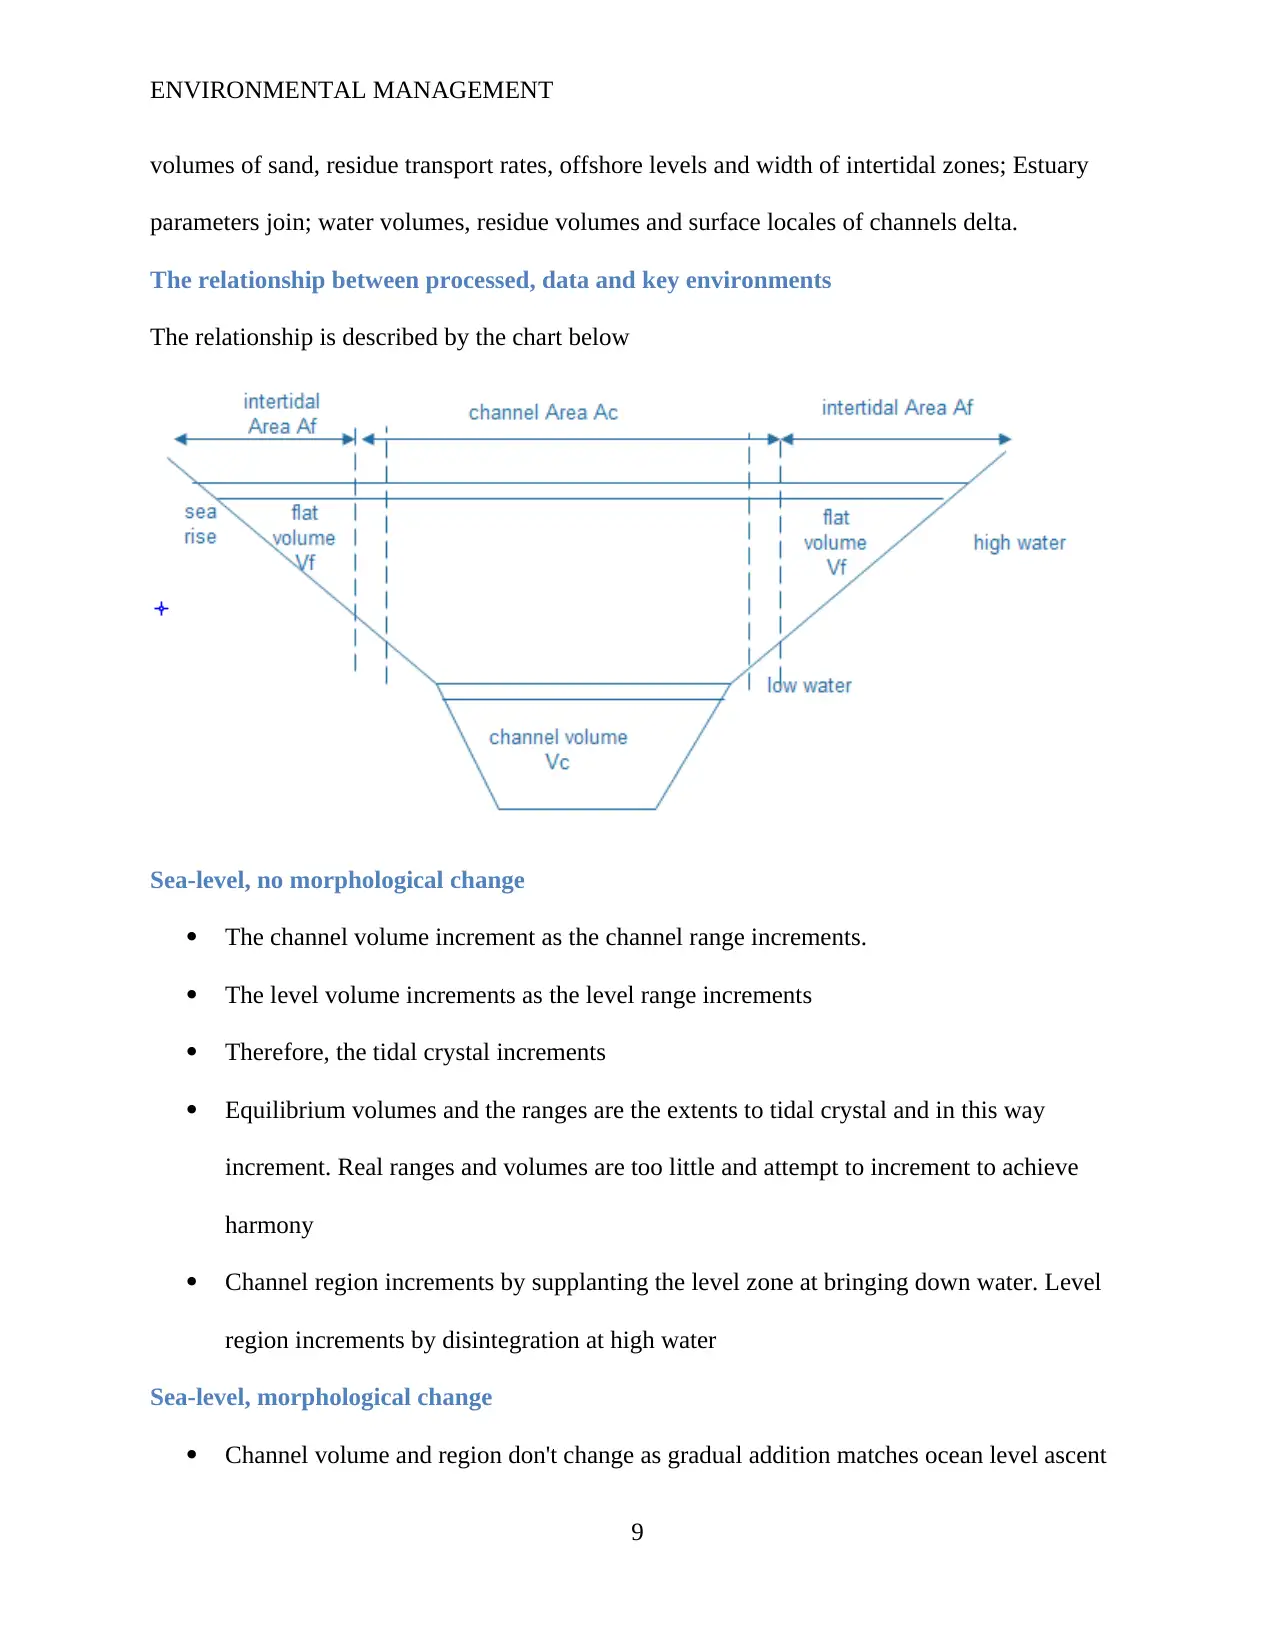
volumes of sand, residue transport rates, offshore levels and width of intertidal zones; Estuary
parameters join; water volumes, residue volumes and surface locales of channels delta.
The relationship between processed, data and key environments
The relationship is described by the chart below
Sea-level, no morphological change
The channel volume increment as the channel range increments.
The level volume increments as the level range increments
Therefore, the tidal crystal increments
Equilibrium volumes and the ranges are the extents to tidal crystal and in this way
increment. Real ranges and volumes are too little and attempt to increment to achieve
harmony
Channel region increments by supplanting the level zone at bringing down water. Level
region increments by disintegration at high water
Sea-level, morphological change
Channel volume and region don't change as gradual addition matches ocean level ascent
9
Paraphrase This Document
Need a fresh take? Get an instant paraphrase of this document with our AI Paraphraser
ENVIRONMENTAL MANAGEMENT
Flat size and area don't change
Tidal crystal does not change
Equilibrium volumes and territories don't change, so genuine amounts are near harmony,
and no further change is activated
If the gradual addition is more noteworthy than ocean level ascent, the crystal is
diminished, harmony volumes decline and real volumes reduction to take after balance
(Harrison et al., 2017).
The advantages of ASMITA model
1. A very vital importance of ASMITA model is that it can perform a sensitivity analysis and
make robust predictions of the future of an estuary.
2. This robust prediction helps the management to develop a risk mitigation plan for protecting
the estuary.
3. An estuary management team can use ASMITA model to develop a management plan for the
estuary.
4. ASMITA model can help the management team to budget on the Estuary through prediction
of its behaviours.
5. ASMITA model can establish the relationship between the element state and tidal prism.
6. ASMITA model can help in describing the evolution of tidal inlet systems in the direction of
equilibrium.
10
ENVIRONMENTAL MANAGEMENT
The disadvantages of ASMITA model
1. ASMITA can produce wrong readings because it depends on variables which depend on
human accuracy. The measurement of flat volume and channel and intertidal areas depends
on other instruments. In this case, if those measurements are done incorrectly, they will lead
inconsequential incorrect results from the ASMITA hence the wrong prediction.
2. ASMITA cannot be depended onto 100% prediction level. ASMITA predicts on long-term
evolution but does not give a correct prediction for short-term evolution.
3. For accuracy purposes, there is a need to incorporate more than one model while using
ASMITA model to compare the results and hence to validate its accuracy. This coupling is
very costly.
4. When using ASMITA modelling, there is a need for the constraint to standard schematization
as opposed to when using behaviour-oriented modelling.
An example ASMITA model
There are not less than 170 estuaries with various characteristics in the United Kingdom. Most of
those estuaries have some forms that would need protection since there are major sites for
various species of animals such as birds (Robins et al., 2016). It also offers recreational activities
such as sailing, walking fishing. These estuaries also provide economic benefits to the UK such
as ports, fishing dregs. It’s vital to be in a position to predict how these estuaries might change in
days to come to manage them. The United Kingdom applied the ASMITA Model to forecast the
extreme rates of sea-level escalation that can occur earlier the intertidal areas are lost totally.
The ASMITA model had been used to represent the estuaries as a succession of morphological
features. In this case, every element develops in the direction of an empirically resulting
steadiness volume and relate to the neighbouring elements by residue exchange.
11
⊘ This is a preview!⊘
Do you want full access?
Subscribe today to unlock all pages.
Trusted by 1+ million students worldwide
1 out of 18
Your All-in-One AI-Powered Toolkit for Academic Success.
+13062052269
info@desklib.com
Available 24*7 on WhatsApp / Email
![[object Object]](/_next/static/media/star-bottom.7253800d.svg)
Unlock your academic potential
Copyright © 2020–2026 A2Z Services. All Rights Reserved. Developed and managed by ZUCOL.