Pivot Table Application: Social Media Trends & OMT Sales Analysis

Verified

Added on  2023/04/17

|8
|1121
|133
Report
AI Summary
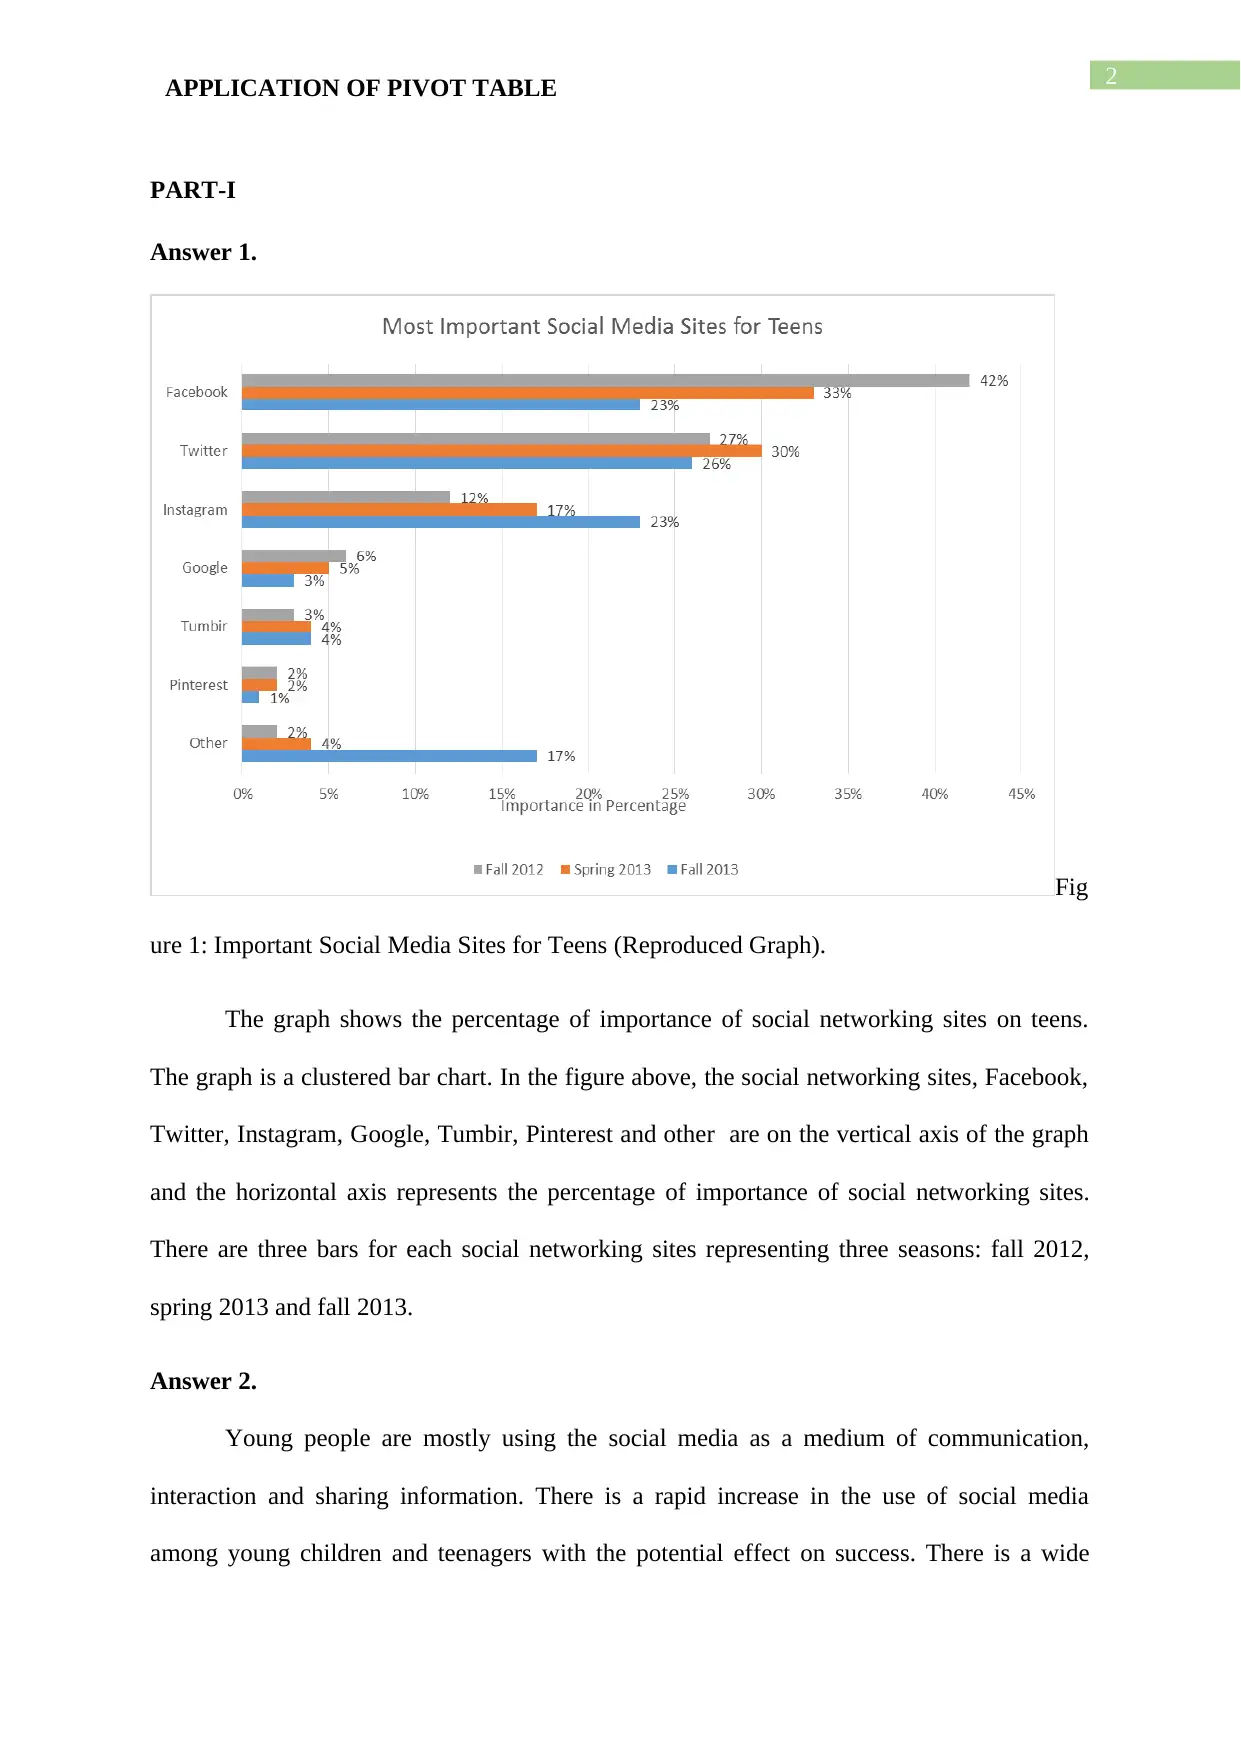
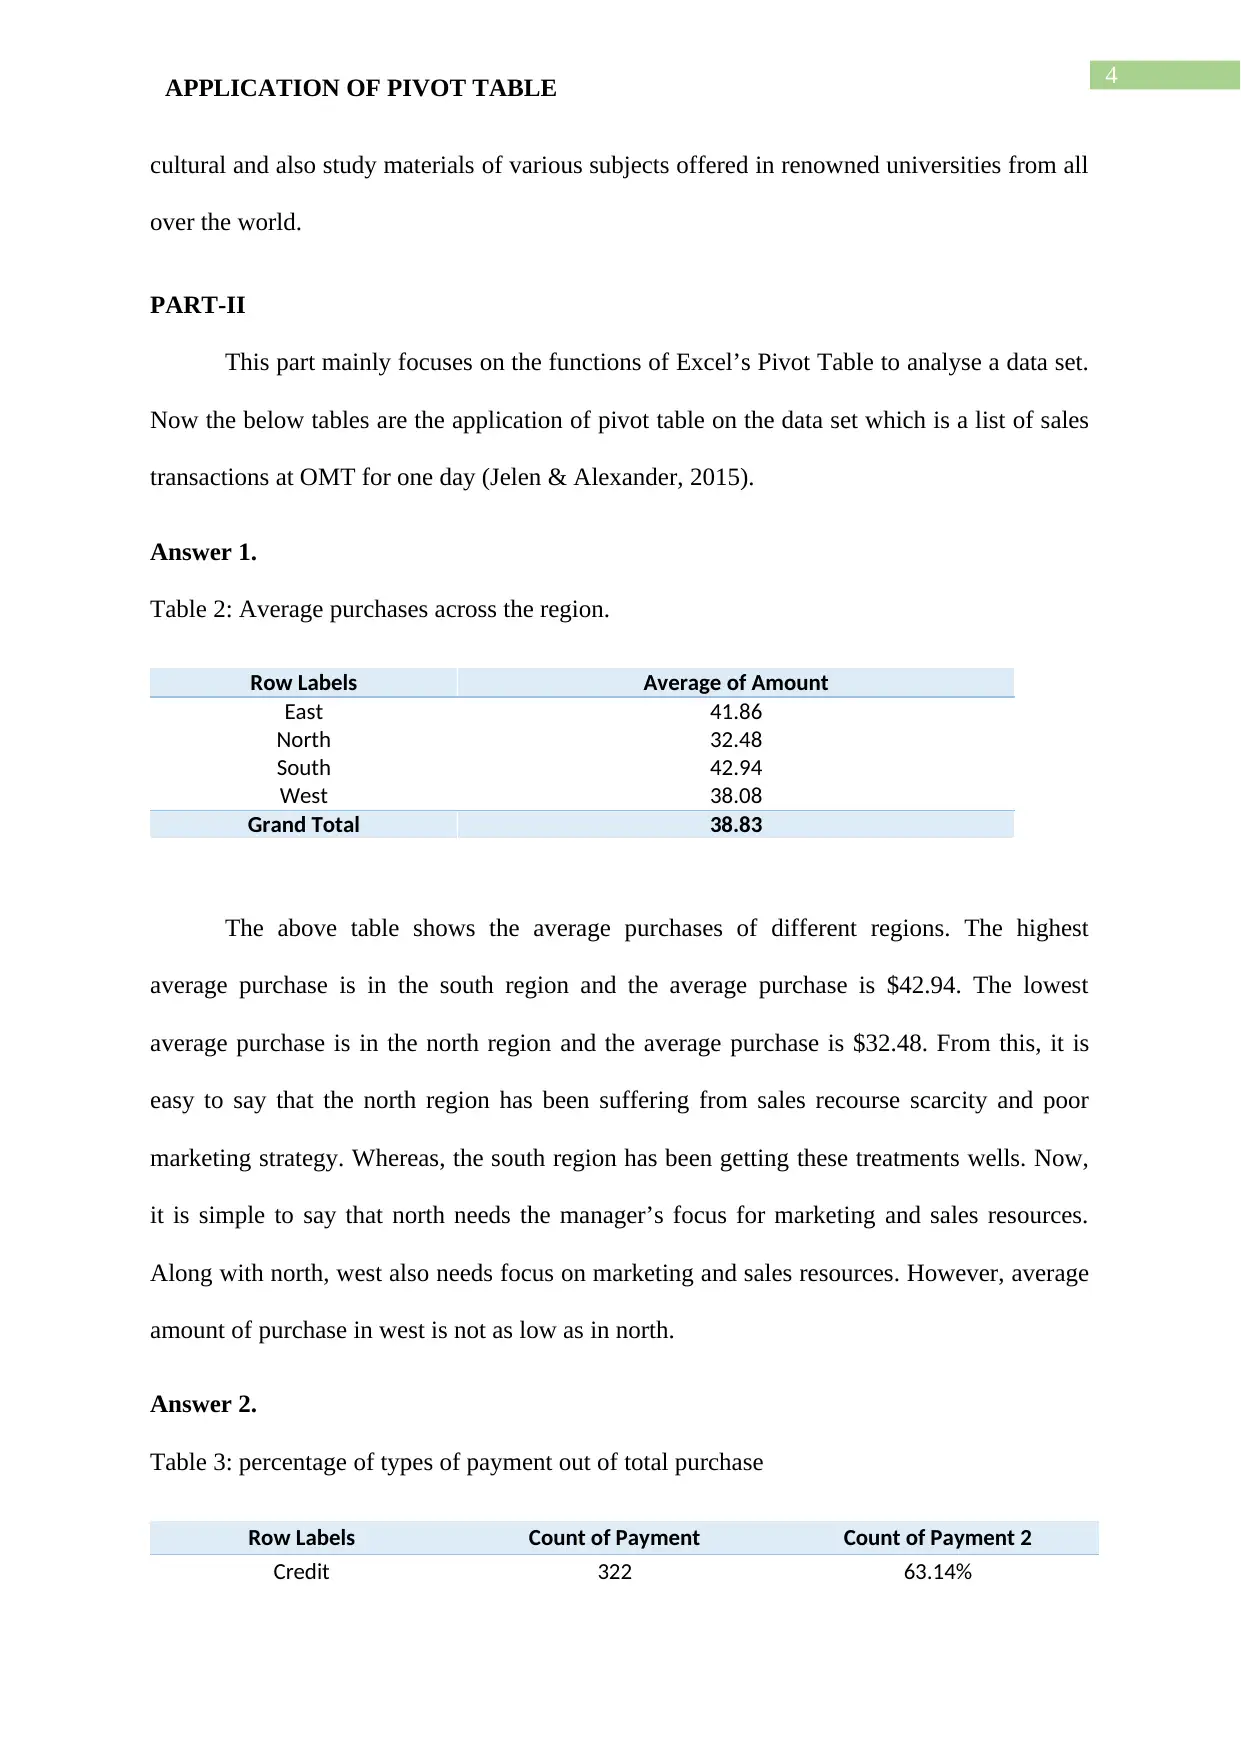
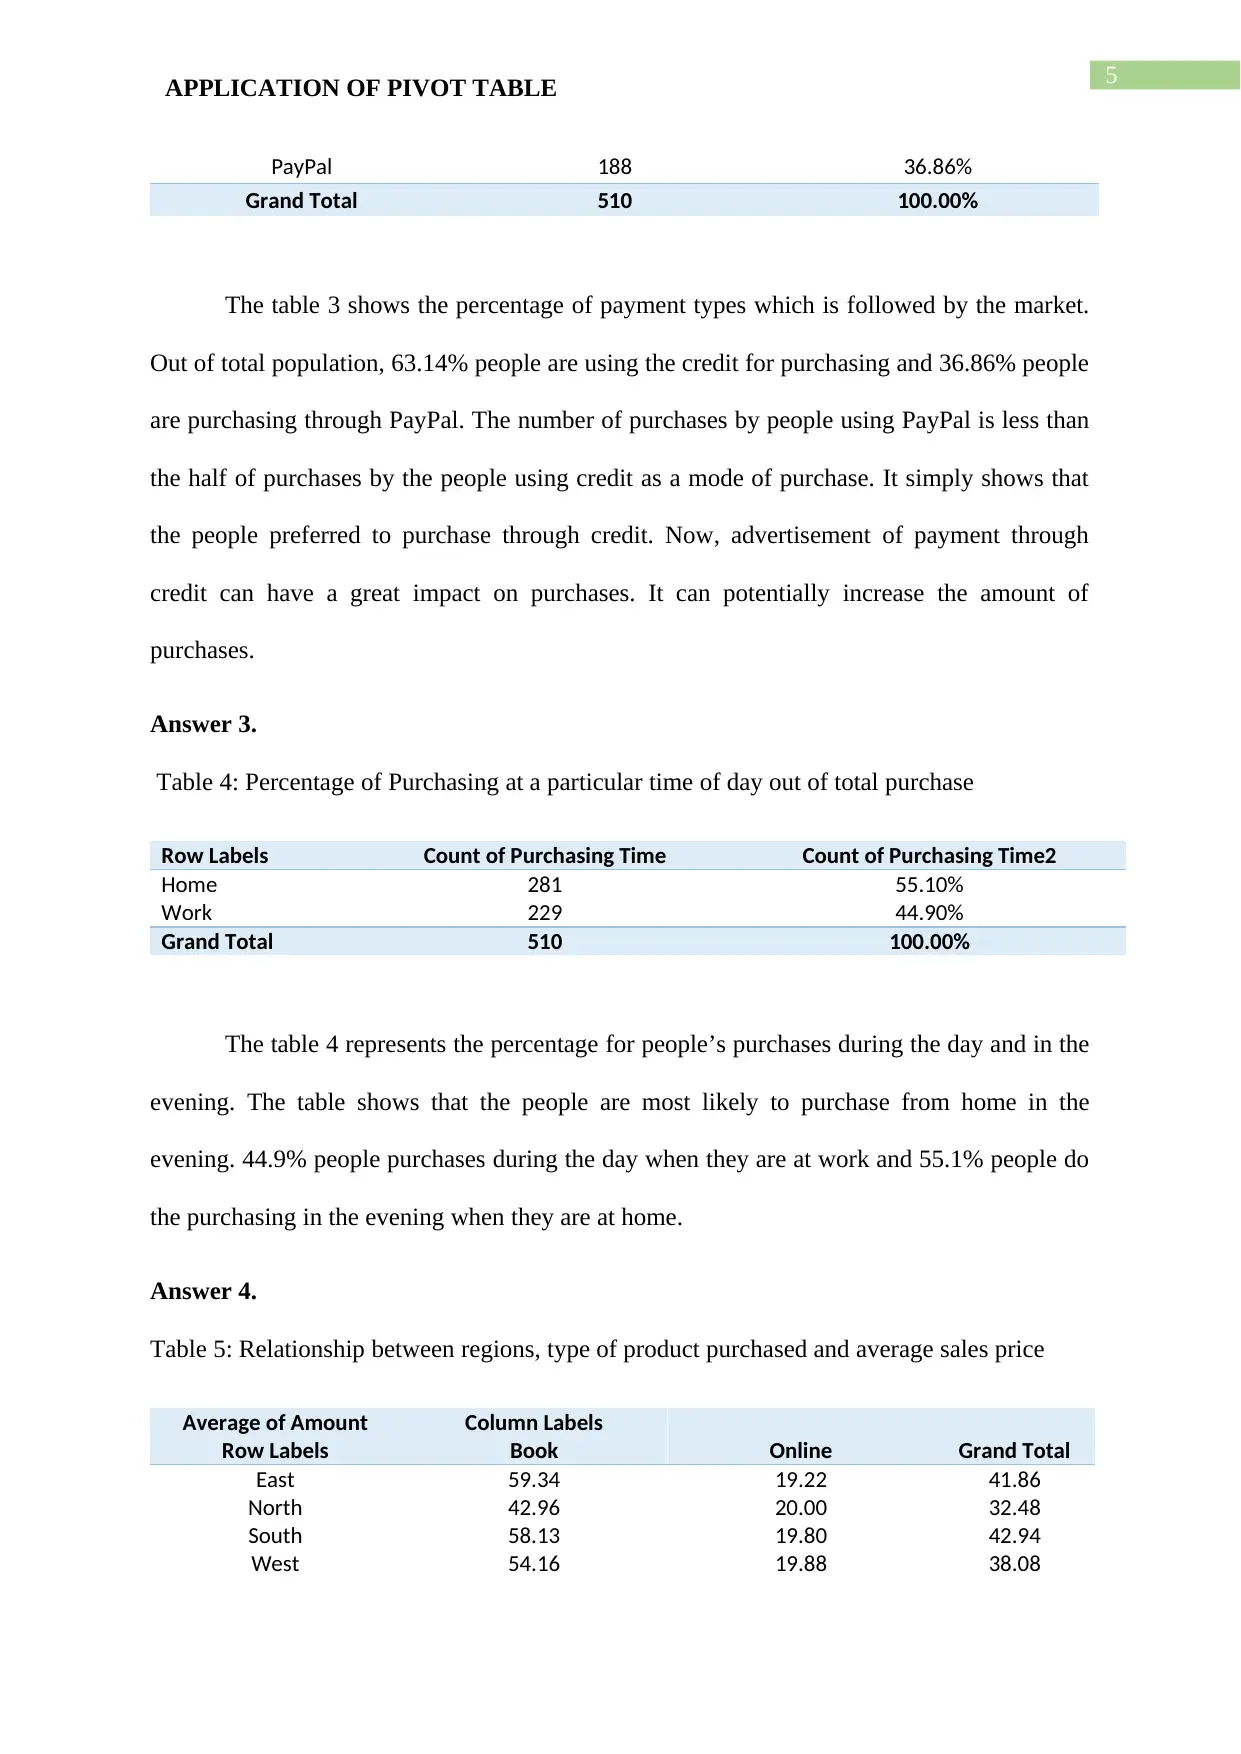
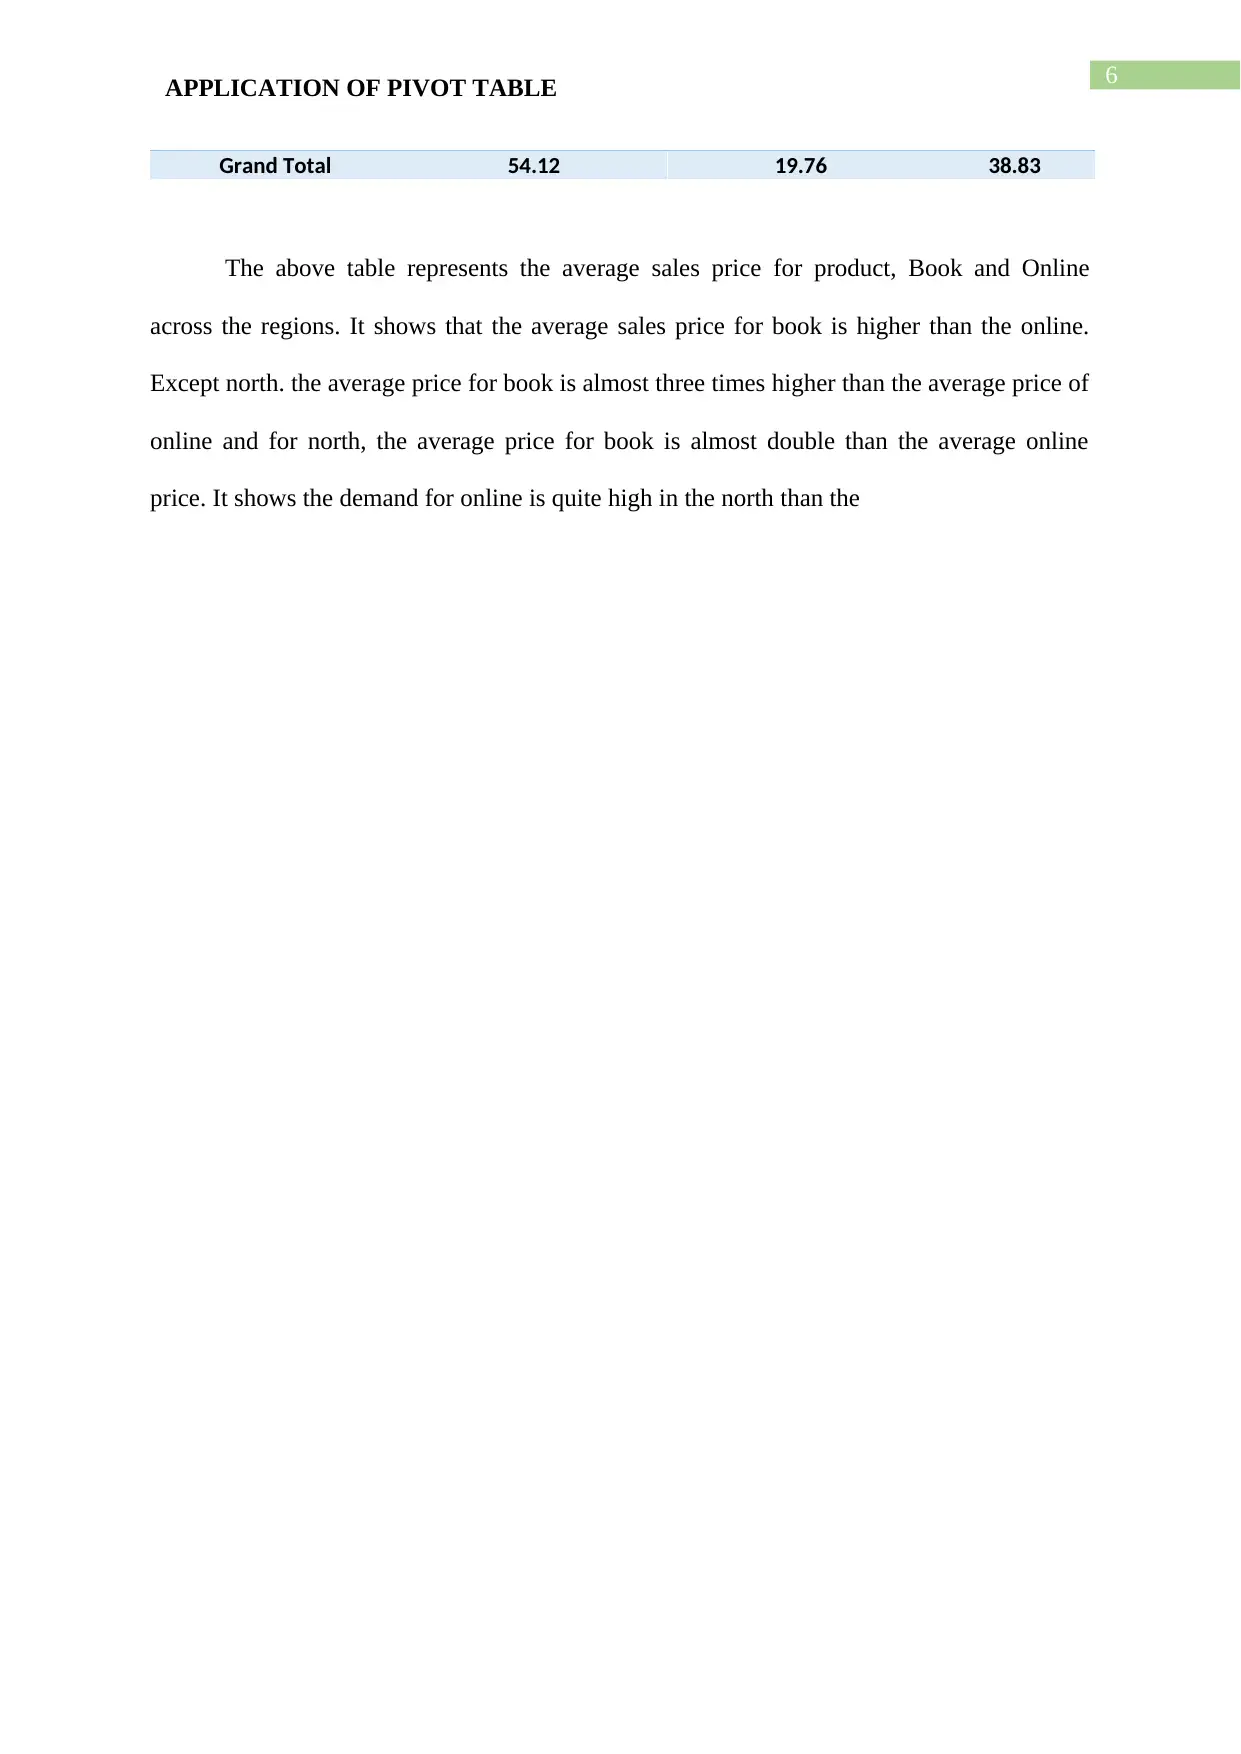
This report demonstrates the application of pivot tables in analyzing data from two different domains: social media usage among teenagers and sales transactions at OMT. The first part analyzes a clustered bar chart showing the importance of various social media platforms (Facebook, Twitter, Instagram, etc.) among teens across different seasons. It discusses the increasing importance of platforms like Instagram and the declining importance of others. The second part focuses on using Excel's pivot table functionality to analyze a dataset of sales transactions at OMT. It examines average purchases across different regions, the percentage of different payment types used, purchasing times, and the relationship between regions, product types, and average sales prices. The analysis highlights regional sales performance, payment preferences, and product demand variations, providing actionable insights for marketing and sales strategies. Desklib provides similar solved assignments and resources for students.
Document Page
Running head: APPLICATION OF PIVOT TABLE
Application of Pivot Table
Name of the Student:
Name of the University:
Author Note:
tabler-icon-diamond-filled.svg

Paraphrase This Document

Need a fresh take? Get an instant paraphrase of this document with our AI Paraphraser
Document Page
1APPLICATION OF PIVOT TABLE
Table of Contents
PART-I.......................................................................................................................................2
Answer 1................................................................................................................................2
Answer 2................................................................................................................................2
PART-II......................................................................................................................................4
Answer 1................................................................................................................................4
Answer 2................................................................................................................................4
Answer 3................................................................................................................................5
Answer 4................................................................................................................................5
Document Page
2APPLICATION OF PIVOT TABLE
PART-I
Answer 1.
Fig
ure 1: Important Social Media Sites for Teens (Reproduced Graph).
The graph shows the percentage of importance of social networking sites on teens.
The graph is a clustered bar chart. In the figure above, the social networking sites, Facebook,
Twitter, Instagram, Google, Tumbir, Pinterest and other are on the vertical axis of the graph
and the horizontal axis represents the percentage of importance of social networking sites.
There are three bars for each social networking sites representing three seasons: fall 2012,
spring 2013 and fall 2013.
Answer 2.
Young people are mostly using the social media as a medium of communication,
interaction and sharing information. There is a rapid increase in the use of social media
among young children and teenagers with the potential effect on success. There is a wide
Document Page
3APPLICATION OF PIVOT TABLE
range of social networking sites and the important and globally used social networking sites
are Facebook, Instagram, google, Tumbir and Pinterest. There are positive impacts of social
media on teenagers like social media provides help and support at hard times, it empowers
the girls to express their thoughts and things they value and most importantly it connects
them with their friends easily(Seo, Houston, Knight, Kennedy & Inglish, 2014.). Social
media plays a role to the teenagers to spread social awareness, to access educational benefits
through discussion, to enhance their skills, to enhance creativity, confidence and
independence.
Now the figure 1 shows the importance of social media on teens in fall 2012, spring
2013 and fall 2013. The most Facebook have the greater importance on teens among other
social website in fall 2012 and spring 2013. In fall 2013, Twitter becomes topper at the list of
social website having importance on teens. The whole picture depicts that the growth of other
social media sites except Facebook, Instagram, google, tumber and Pinterest have a huge
growth in fall 2013. In fall 2013, the importance of Facebook, twitter and Instagram has
almost same level of importance on teens in the social world. Though, the importance of
Google and Facebook is falling compared to the other existing social websites as shown in
the figure 1. Where the importance of Instagram is growing in opposite of Facebook and
google.
Instagram is a platform where one can showcase their photography and videography
skills and also can share with the world. This platform has unique presentation mode which is
visual rather descriptive. This can play a major role in spreading the awareness of relative
skills among the people roaming around the social websites. This can enhance the relative
skills and can bring the relative opportunities to the young people of the society. This is also
being used in the online education process by making videos on various subjects like social,
tabler-icon-diamond-filled.svg

Paraphrase This Document

Need a fresh take? Get an instant paraphrase of this document with our AI Paraphraser
Document Page
4APPLICATION OF PIVOT TABLE
cultural and also study materials of various subjects offered in renowned universities from all
over the world.
PART-II
This part mainly focuses on the functions of Excel’s Pivot Table to analyse a data set.
Now the below tables are the application of pivot table on the data set which is a list of sales
transactions at OMT for one day (Jelen & Alexander, 2015).
Answer 1.
Table 2: Average purchases across the region.
Row Labels Average of Amount
East 41.86
North 32.48
South 42.94
West 38.08
Grand Total 38.83
The above table shows the average purchases of different regions. The highest
average purchase is in the south region and the average purchase is $42.94. The lowest
average purchase is in the north region and the average purchase is $32.48. From this, it is
easy to say that the north region has been suffering from sales recourse scarcity and poor
marketing strategy. Whereas, the south region has been getting these treatments wells. Now,
it is simple to say that north needs the manager’s focus for marketing and sales resources.
Along with north, west also needs focus on marketing and sales resources. However, average
amount of purchase in west is not as low as in north.
Answer 2.
Table 3: percentage of types of payment out of total purchase
Row Labels Count of Payment Count of Payment 2
Credit 322 63.14%
Document Page
5APPLICATION OF PIVOT TABLE
PayPal 188 36.86%
Grand Total 510 100.00%
The table 3 shows the percentage of payment types which is followed by the market.
Out of total population, 63.14% people are using the credit for purchasing and 36.86% people
are purchasing through PayPal. The number of purchases by people using PayPal is less than
the half of purchases by the people using credit as a mode of purchase. It simply shows that
the people preferred to purchase through credit. Now, advertisement of payment through
credit can have a great impact on purchases. It can potentially increase the amount of
purchases.
Answer 3.
Table 4: Percentage of Purchasing at a particular time of day out of total purchase
Row Labels Count of Purchasing Time Count of Purchasing Time2
Home 281 55.10%
Work 229 44.90%
Grand Total 510 100.00%
The table 4 represents the percentage for people’s purchases during the day and in the
evening. The table shows that the people are most likely to purchase from home in the
evening. 44.9% people purchases during the day when they are at work and 55.1% people do
the purchasing in the evening when they are at home.
Answer 4.
Table 5: Relationship between regions, type of product purchased and average sales price
Average of Amount Column Labels
Row Labels Book Online Grand Total
East 59.34 19.22 41.86
North 42.96 20.00 32.48
South 58.13 19.80 42.94
West 54.16 19.88 38.08
Document Page
6APPLICATION OF PIVOT TABLE
Grand Total 54.12 19.76 38.83
The above table represents the average sales price for product, Book and Online
across the regions. It shows that the average sales price for book is higher than the online.
Except north. the average price for book is almost three times higher than the average price of
online and for north, the average price for book is almost double than the average online
price. It shows the demand for online is quite high in the north than the
tabler-icon-diamond-filled.svg

Paraphrase This Document

Need a fresh take? Get an instant paraphrase of this document with our AI Paraphraser
Document Page
7APPLICATION OF PIVOT TABLE
Reference:
Jelen, B., & Alexande, M. (2015). Excel 2016 Pivot Table Data Crunching. Que Publishing.
Seo, H., Houston, J. B., Knight, L. A. T., Kennedy, E. J., & Inglish, A. B. (2014). Teens’
social media use and collective action. new media & society, 16(6), 883-902.
chevron_up_icon
1 out of 8
circle_padding
hide_on_mobile
zoom_out_icon
[object Object]