Work Plan Analysis Graph: Analysis of Planned vs. Utilized Study Time

Verified

Added on  2023/06/04

|3
|520
|497
Practical Assignment
AI Summary
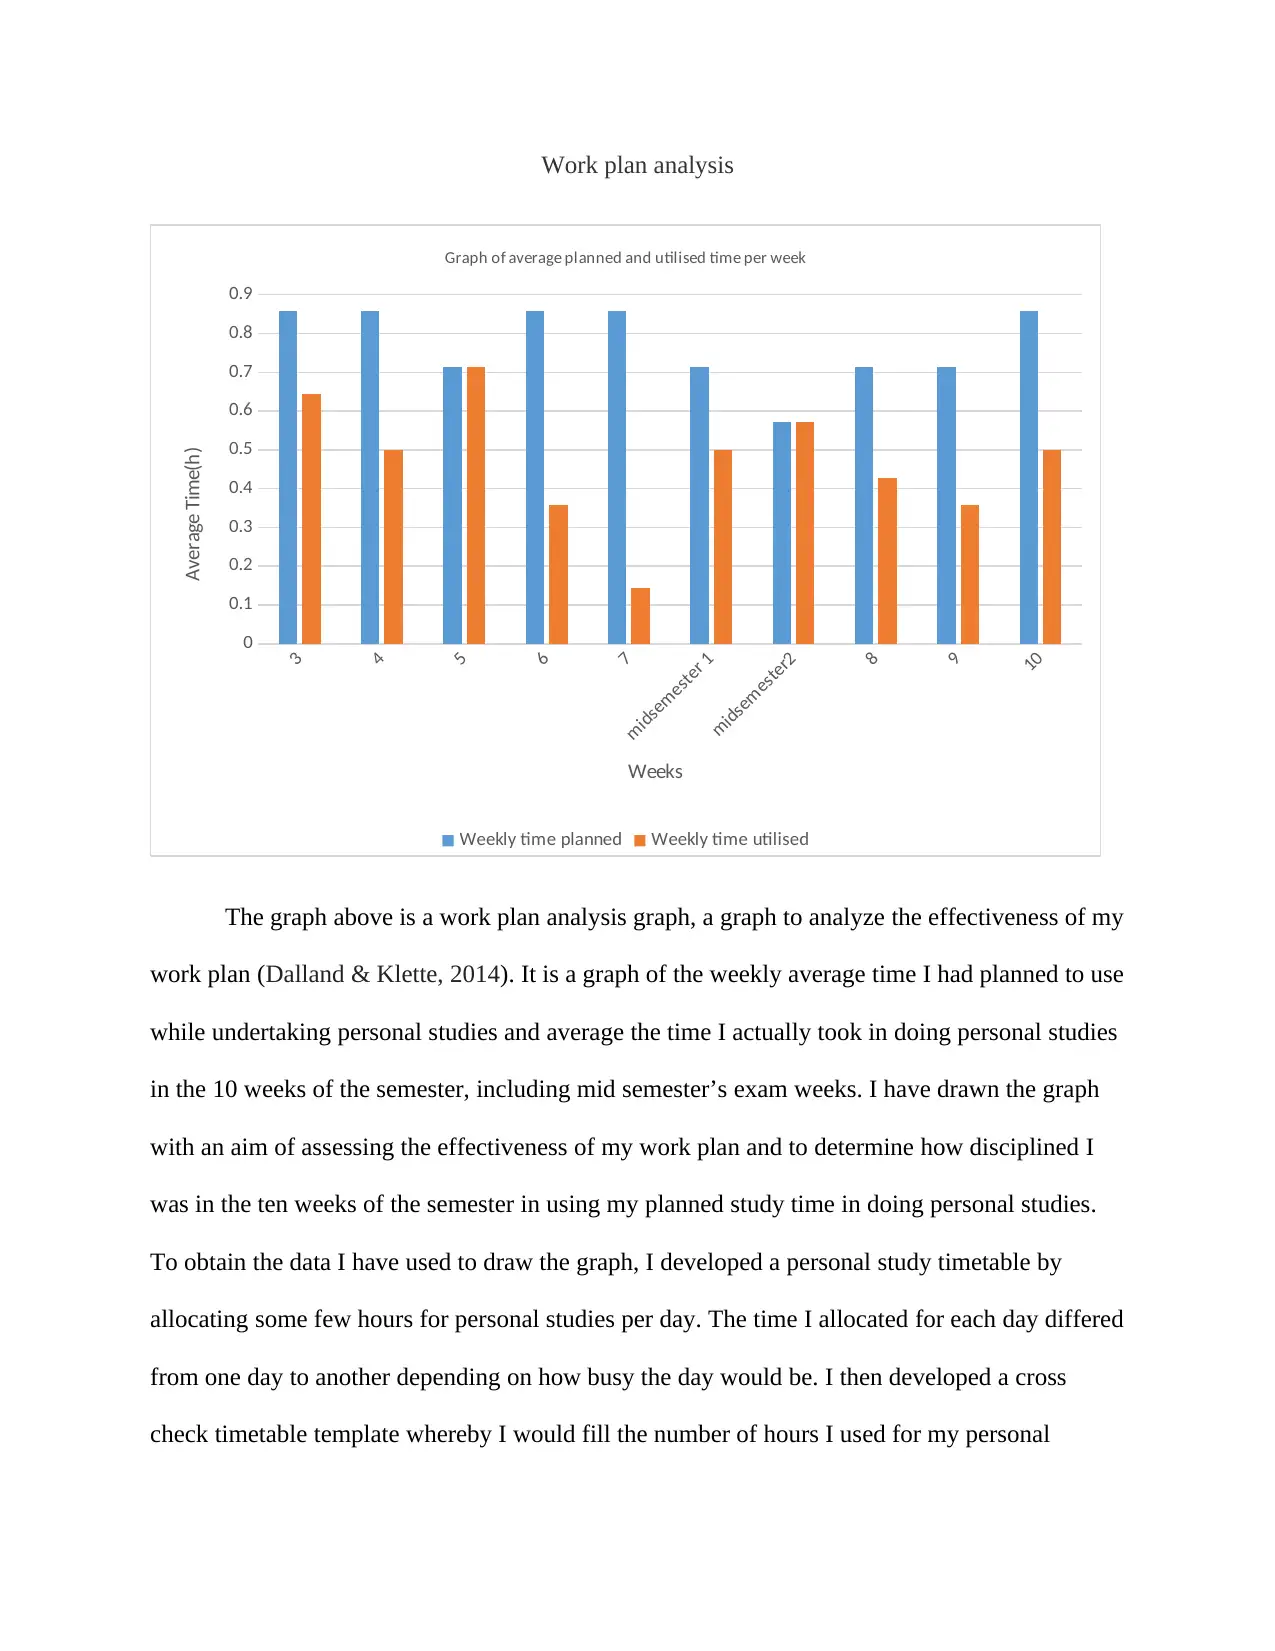
This assignment presents a work plan analysis graph created to assess the effectiveness of the student's study plan over a ten-week semester, including mid-semester exam weeks. The graph compares the average planned study time per week with the average time actually utilized, revealing discrepancies in time management. Data was collected from a personal study timetable and a cross-check template. The analysis highlights weeks where the student successfully adhered to the plan and identifies areas for improvement in time allocation and discipline. References to relevant academic research on self-control and study strategies are included to support the analysis. The assignment aims to visualize the student's study habits and provide insights for better time management. This work is available on Desklib, a platform offering AI-based study tools and resources for students.
Document Page
Work plan analysis
3
4
5
6
7
midsemester 1
midsemester2
8
9
10
0
0.1
0.2
0.3
0.4
0.5
0.6
0.7
0.8
0.9
Graph of average planned and utilised time per week
Weekly time planned Weekly time utilised
Weeks
Average Time(h)
The graph above is a work plan analysis graph, a graph to analyze the effectiveness of my
work plan (Dalland & Klette, 2014). It is a graph of the weekly average time I had planned to use
while undertaking personal studies and average the time I actually took in doing personal studies
in the 10 weeks of the semester, including mid semester’s exam weeks. I have drawn the graph
with an aim of assessing the effectiveness of my work plan and to determine how disciplined I
was in the ten weeks of the semester in using my planned study time in doing personal studies.
To obtain the data I have used to draw the graph, I developed a personal study timetable by
allocating some few hours for personal studies per day. The time I allocated for each day differed
from one day to another depending on how busy the day would be. I then developed a cross
check timetable template whereby I would fill the number of hours I used for my personal
tabler-icon-diamond-filled.svg

Paraphrase This Document

Need a fresh take? Get an instant paraphrase of this document with our AI Paraphraser
Document Page
studies and therefore I came up with two data sets. These are the number of hour I had planned to
study per day and the number of hours I actually studied per day.
In order to draw the graph, I did little bit of data processing so that I could produce data
set fitting for use in drawing of the graph. I calculated weekly average time for the two data sets
and then used this result to draw the graph. The graph shows that there is a disparity between the
number of hours I had planned to study and what I actually used. In most of the weeks I never
utilized all the time I had planned to undertake personal studies to do so. It was only in two
weeks in the whole semester where I was disciplined enough to use all the time I had planned to
use for personal studies (Oaten, & Cheng. 2006), in week five and week 9. Week 7 was the
semester week when I used the least planned time for personal studies. This is because it was the
week when I had my midsemester exam.
Document Page
References
Oaten, M., and K. Cheng. 2006. Improved self-control: The benefits of a regular program of
academic study. Basic and Applied Social Psychology 28 (1):1-16.
Dalland, C.P. and Klette, K., 2014. Work-plan heroes: Student strategies in lower-secondary
Norwegian classrooms. Scandinavian Journal of Educational Research, 58(4), pp.400 423.
chevron_up_icon
1 out of 3
circle_padding
hide_on_mobile
zoom_out_icon
[object Object]