Planning and Analysis of Quality
VerifiedAdded on 2020/03/15
|19
|6411
|35
Report
AI Summary
This report delves into the planning and analysis of quality management, focusing on customer satisfaction, stakeholder analysis, and various methodologies such as SWOT and Kano analysis. It emphasizes the importance of quality assurance in business development and provides insights into effective strategies for enhancing customer experience and product quality.

Running head: PLANNING AND ANALYSIS OF QUALITY
Planning and Analysis of Quality
Name of the Student:
Name of the University:
Author’s Note:
Planning and Analysis of Quality
Name of the Student:
Name of the University:
Author’s Note:
Paraphrase This Document
Need a fresh take? Get an instant paraphrase of this document with our AI Paraphraser

PLANNING AND ANALYSIS OF QUALITY 1
Executive Summary:
The report discusses about the quality planning, activity and analysis for future. Here we are elaborately providing an overview of
quality assurance and management. The scope and measures of selling a product is also discussed in the report. A SWOT analysis is
incorporated for proper planning. Finally, we have provided a broad conclusion about analyzed data, graphs and calculations.
Necessary Kano analysis, stakeholder analysis and SPC charts are provided in the following report. The following report extends the
helping hands towards business analysis and engineering. For customer evaluation and satisfaction, designing the risk analysis and
Supplier Selection System are the provided in the report. This report is the reflection of problem solving strategies that reflects the true
scenario of quality planning and analysis apprehended by statistical packages and marketing criteria. Our objective is to provide the
pathway of marketing and management strategies inferred by statistical conclusions.
PLANNING AND ANALYSIS OF QUALITY 2
Table of Contents
1. Introduction:-.......................................................................................................................................................................................3
Overview of Quality Management characteristics:-................................................................................................................................3
2. CUSTOMER SATISFACTION:.........................................................................................................................................................3
2.1. Stakeholder Analysis:.......................................................................................................................................................................3
2.2. Process of capturing the Customer needs:........................................................................................................................................5
2.3. Analysis of Customer Needs (Kano Analysis):................................................................................................................................5
3. REQUIREMENTS OF DESIGNING:....................................................................................................................................................7
3.1. Translation of Customer Needs to Design Requirements (QFD):....................................................................................................7
3.2. Design Risk Analysis:.......................................................................................................................................................................9
4.SUPPLIER SELECTION AND EVALUATION:.................................................................................................................................10
4.1. Identification of Component elements:..........................................................................................................................................10
4.2. Method of developing the Supplier Selection System:...................................................................................................................10
4.3. Construction and Use of a Supplier Selection System:..................................................................................................................11
4.4. Conclusion:-....................................................................................................................................................................................11
5. METHOD OF STATISTICAL PROCESS CONTROL:......................................................................................................................12
5.1. Identification of the processes:.......................................................................................................................................................12
5.2. Construction and Use of a SPC chart:.........................................................................................................................................13
6. STRATEGY TO SOLVE THE PROBLEM:........................................................................................................................................14
6.1. Identification of Problems and Use of Problem-Solving Tools:....................................................................................................14
6.2. Construction and Use of Problem-Solving Tools:..........................................................................................................................15
Check sheet:-.....................................................................................................................................................................................15
Problem solving form........................................................................................................................................................................15
7. Conclusion:............................................................................................................................................................................................16
Reference:-.................................................................................................................................................................................................17
⊘ This is a preview!⊘
Do you want full access?
Subscribe today to unlock all pages.
Trusted by 1+ million students worldwide
PLANNING AND ANALYSIS OF QUALITY 3
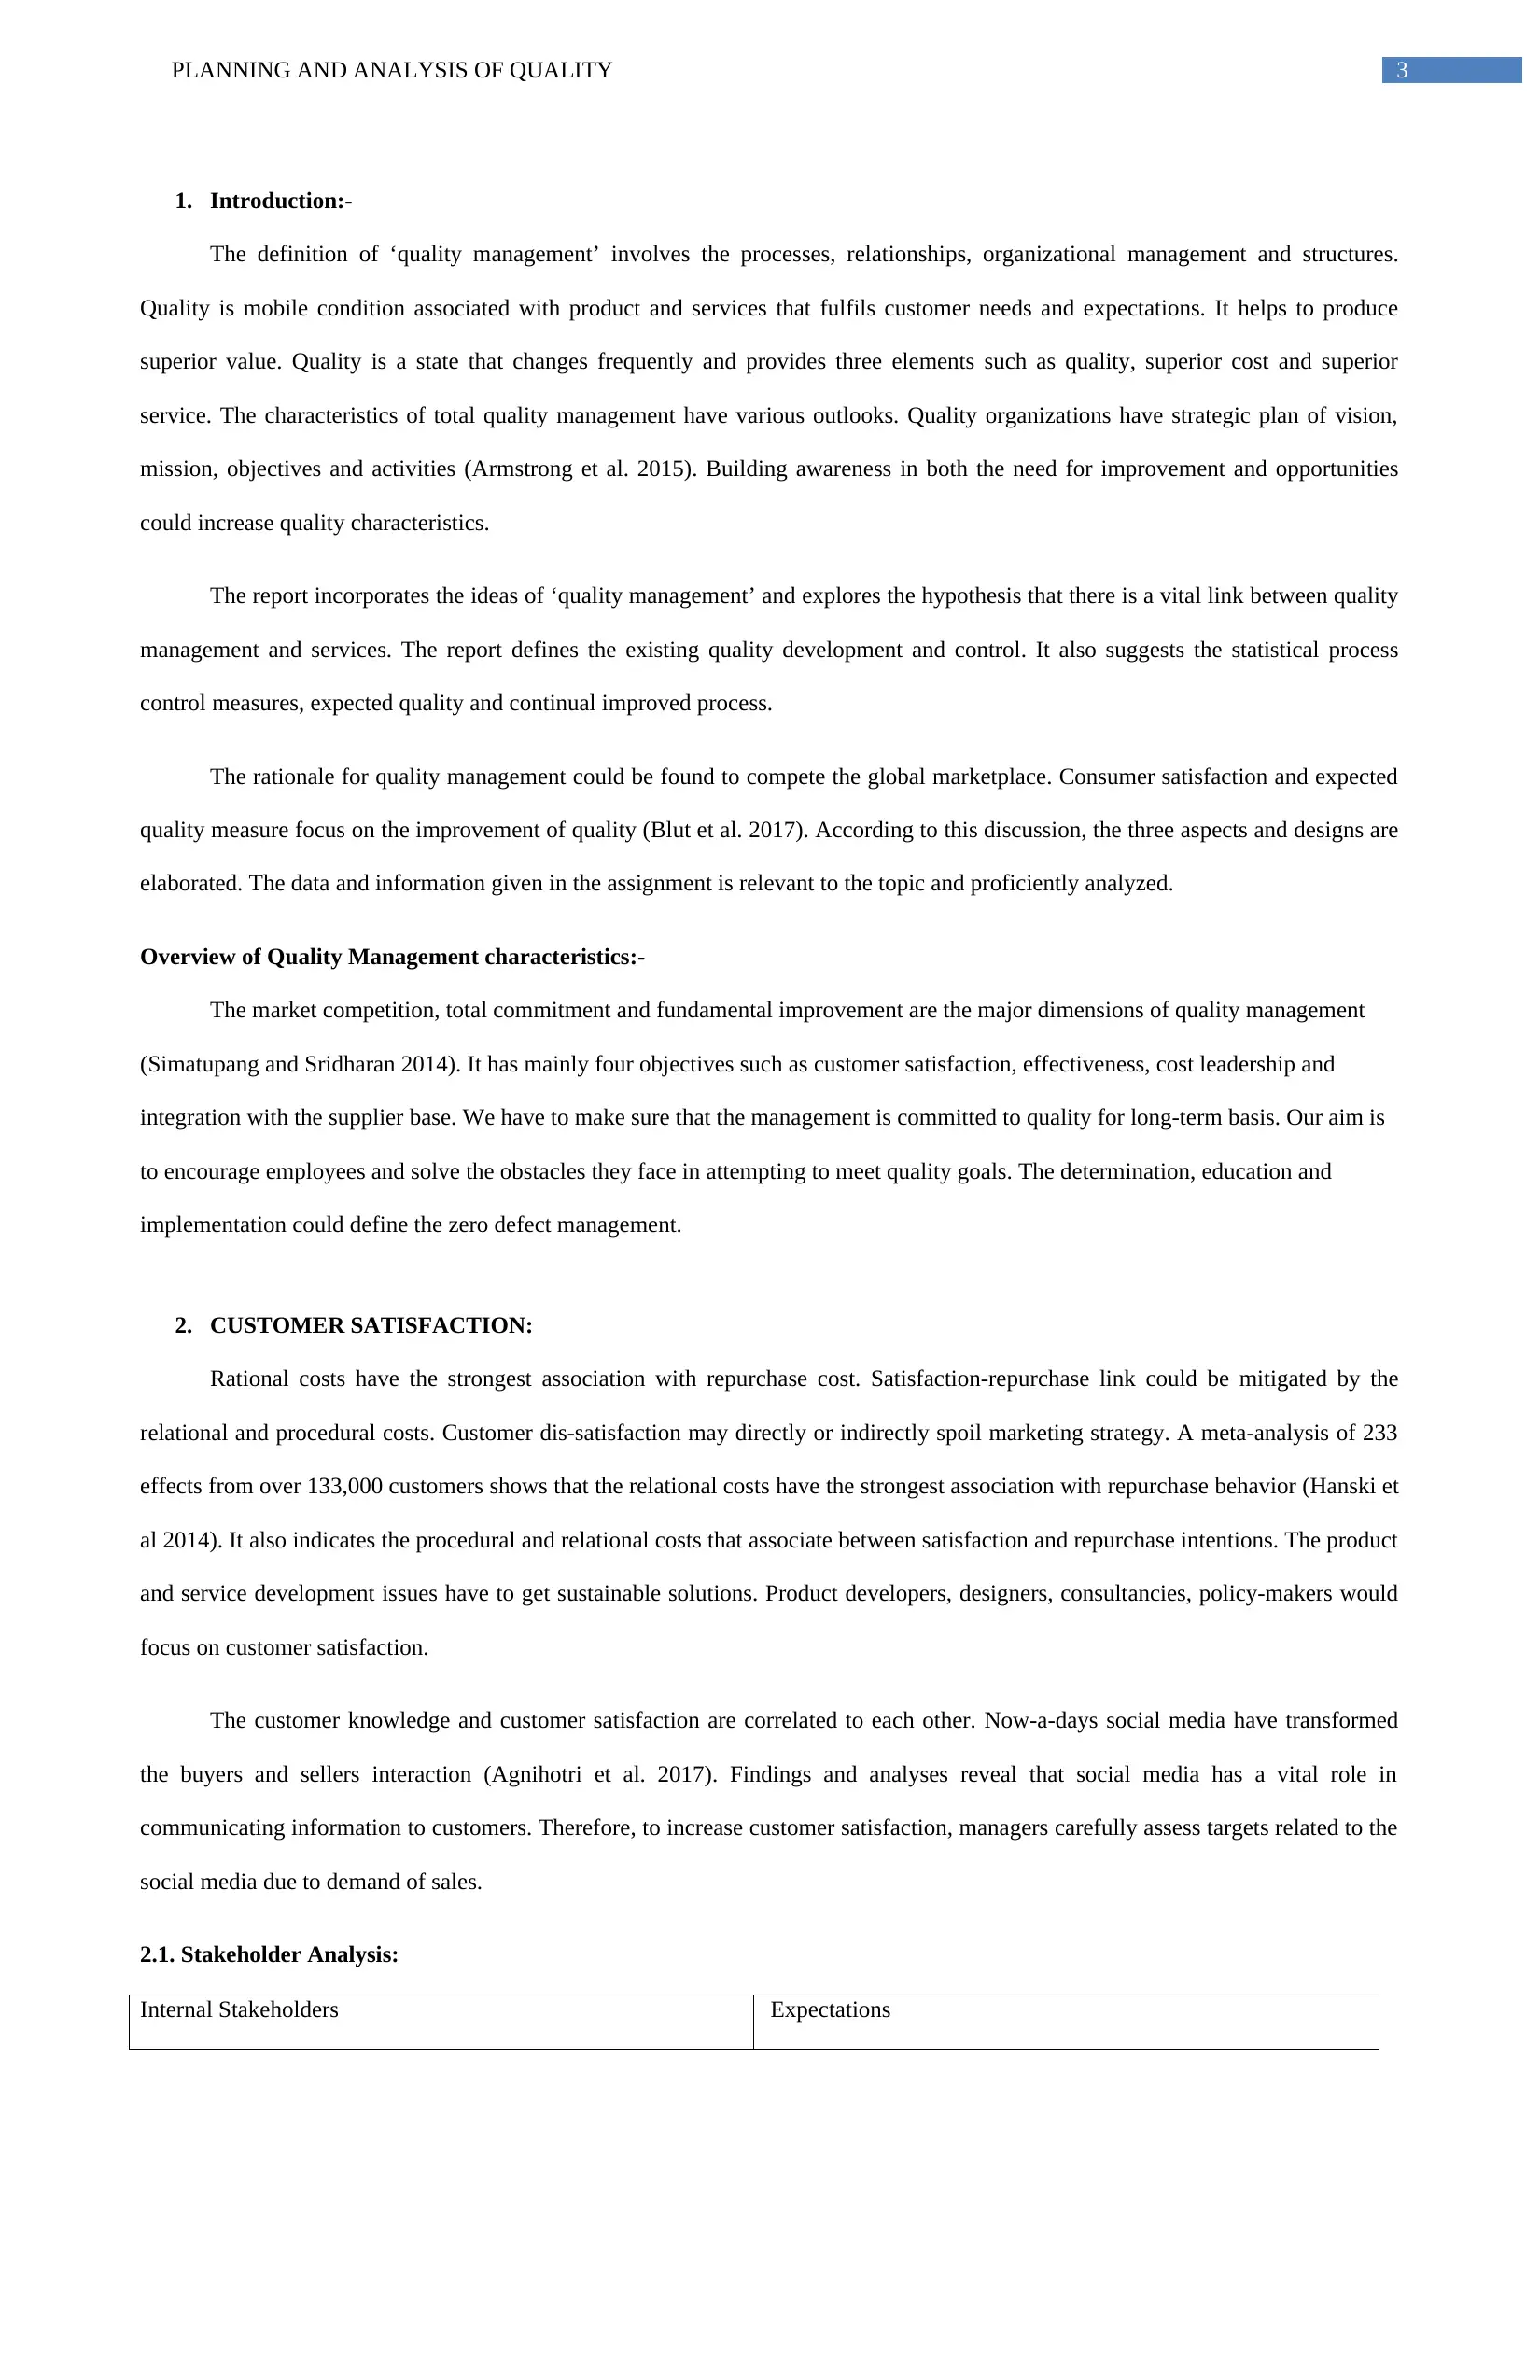
1. Introduction:-
The definition of ‘quality management’ involves the processes, relationships, organizational management and structures.
Quality is mobile condition associated with product and services that fulfils customer needs and expectations. It helps to produce
superior value. Quality is a state that changes frequently and provides three elements such as quality, superior cost and superior
service. The characteristics of total quality management have various outlooks. Quality organizations have strategic plan of vision,
mission, objectives and activities (Armstrong et al. 2015). Building awareness in both the need for improvement and opportunities
could increase quality characteristics.
The report incorporates the ideas of ‘quality management’ and explores the hypothesis that there is a vital link between quality
management and services. The report defines the existing quality development and control. It also suggests the statistical process
control measures, expected quality and continual improved process.
The rationale for quality management could be found to compete the global marketplace. Consumer satisfaction and expected
quality measure focus on the improvement of quality (Blut et al. 2017). According to this discussion, the three aspects and designs are
elaborated. The data and information given in the assignment is relevant to the topic and proficiently analyzed.
Overview of Quality Management characteristics:-
The market competition, total commitment and fundamental improvement are the major dimensions of quality management
(Simatupang and Sridharan 2014). It has mainly four objectives such as customer satisfaction, effectiveness, cost leadership and
integration with the supplier base. We have to make sure that the management is committed to quality for long-term basis. Our aim is
to encourage employees and solve the obstacles they face in attempting to meet quality goals. The determination, education and
implementation could define the zero defect management.
2. CUSTOMER SATISFACTION:
Rational costs have the strongest association with repurchase cost. Satisfaction-repurchase link could be mitigated by the
relational and procedural costs. Customer dis-satisfaction may directly or indirectly spoil marketing strategy. A meta-analysis of 233
effects from over 133,000 customers shows that the relational costs have the strongest association with repurchase behavior (Hanski et
al 2014). It also indicates the procedural and relational costs that associate between satisfaction and repurchase intentions. The product
and service development issues have to get sustainable solutions. Product developers, designers, consultancies, policy-makers would
focus on customer satisfaction.
The customer knowledge and customer satisfaction are correlated to each other. Now-a-days social media have transformed
the buyers and sellers interaction (Agnihotri et al. 2017). Findings and analyses reveal that social media has a vital role in
communicating information to customers. Therefore, to increase customer satisfaction, managers carefully assess targets related to the
social media due to demand of sales.
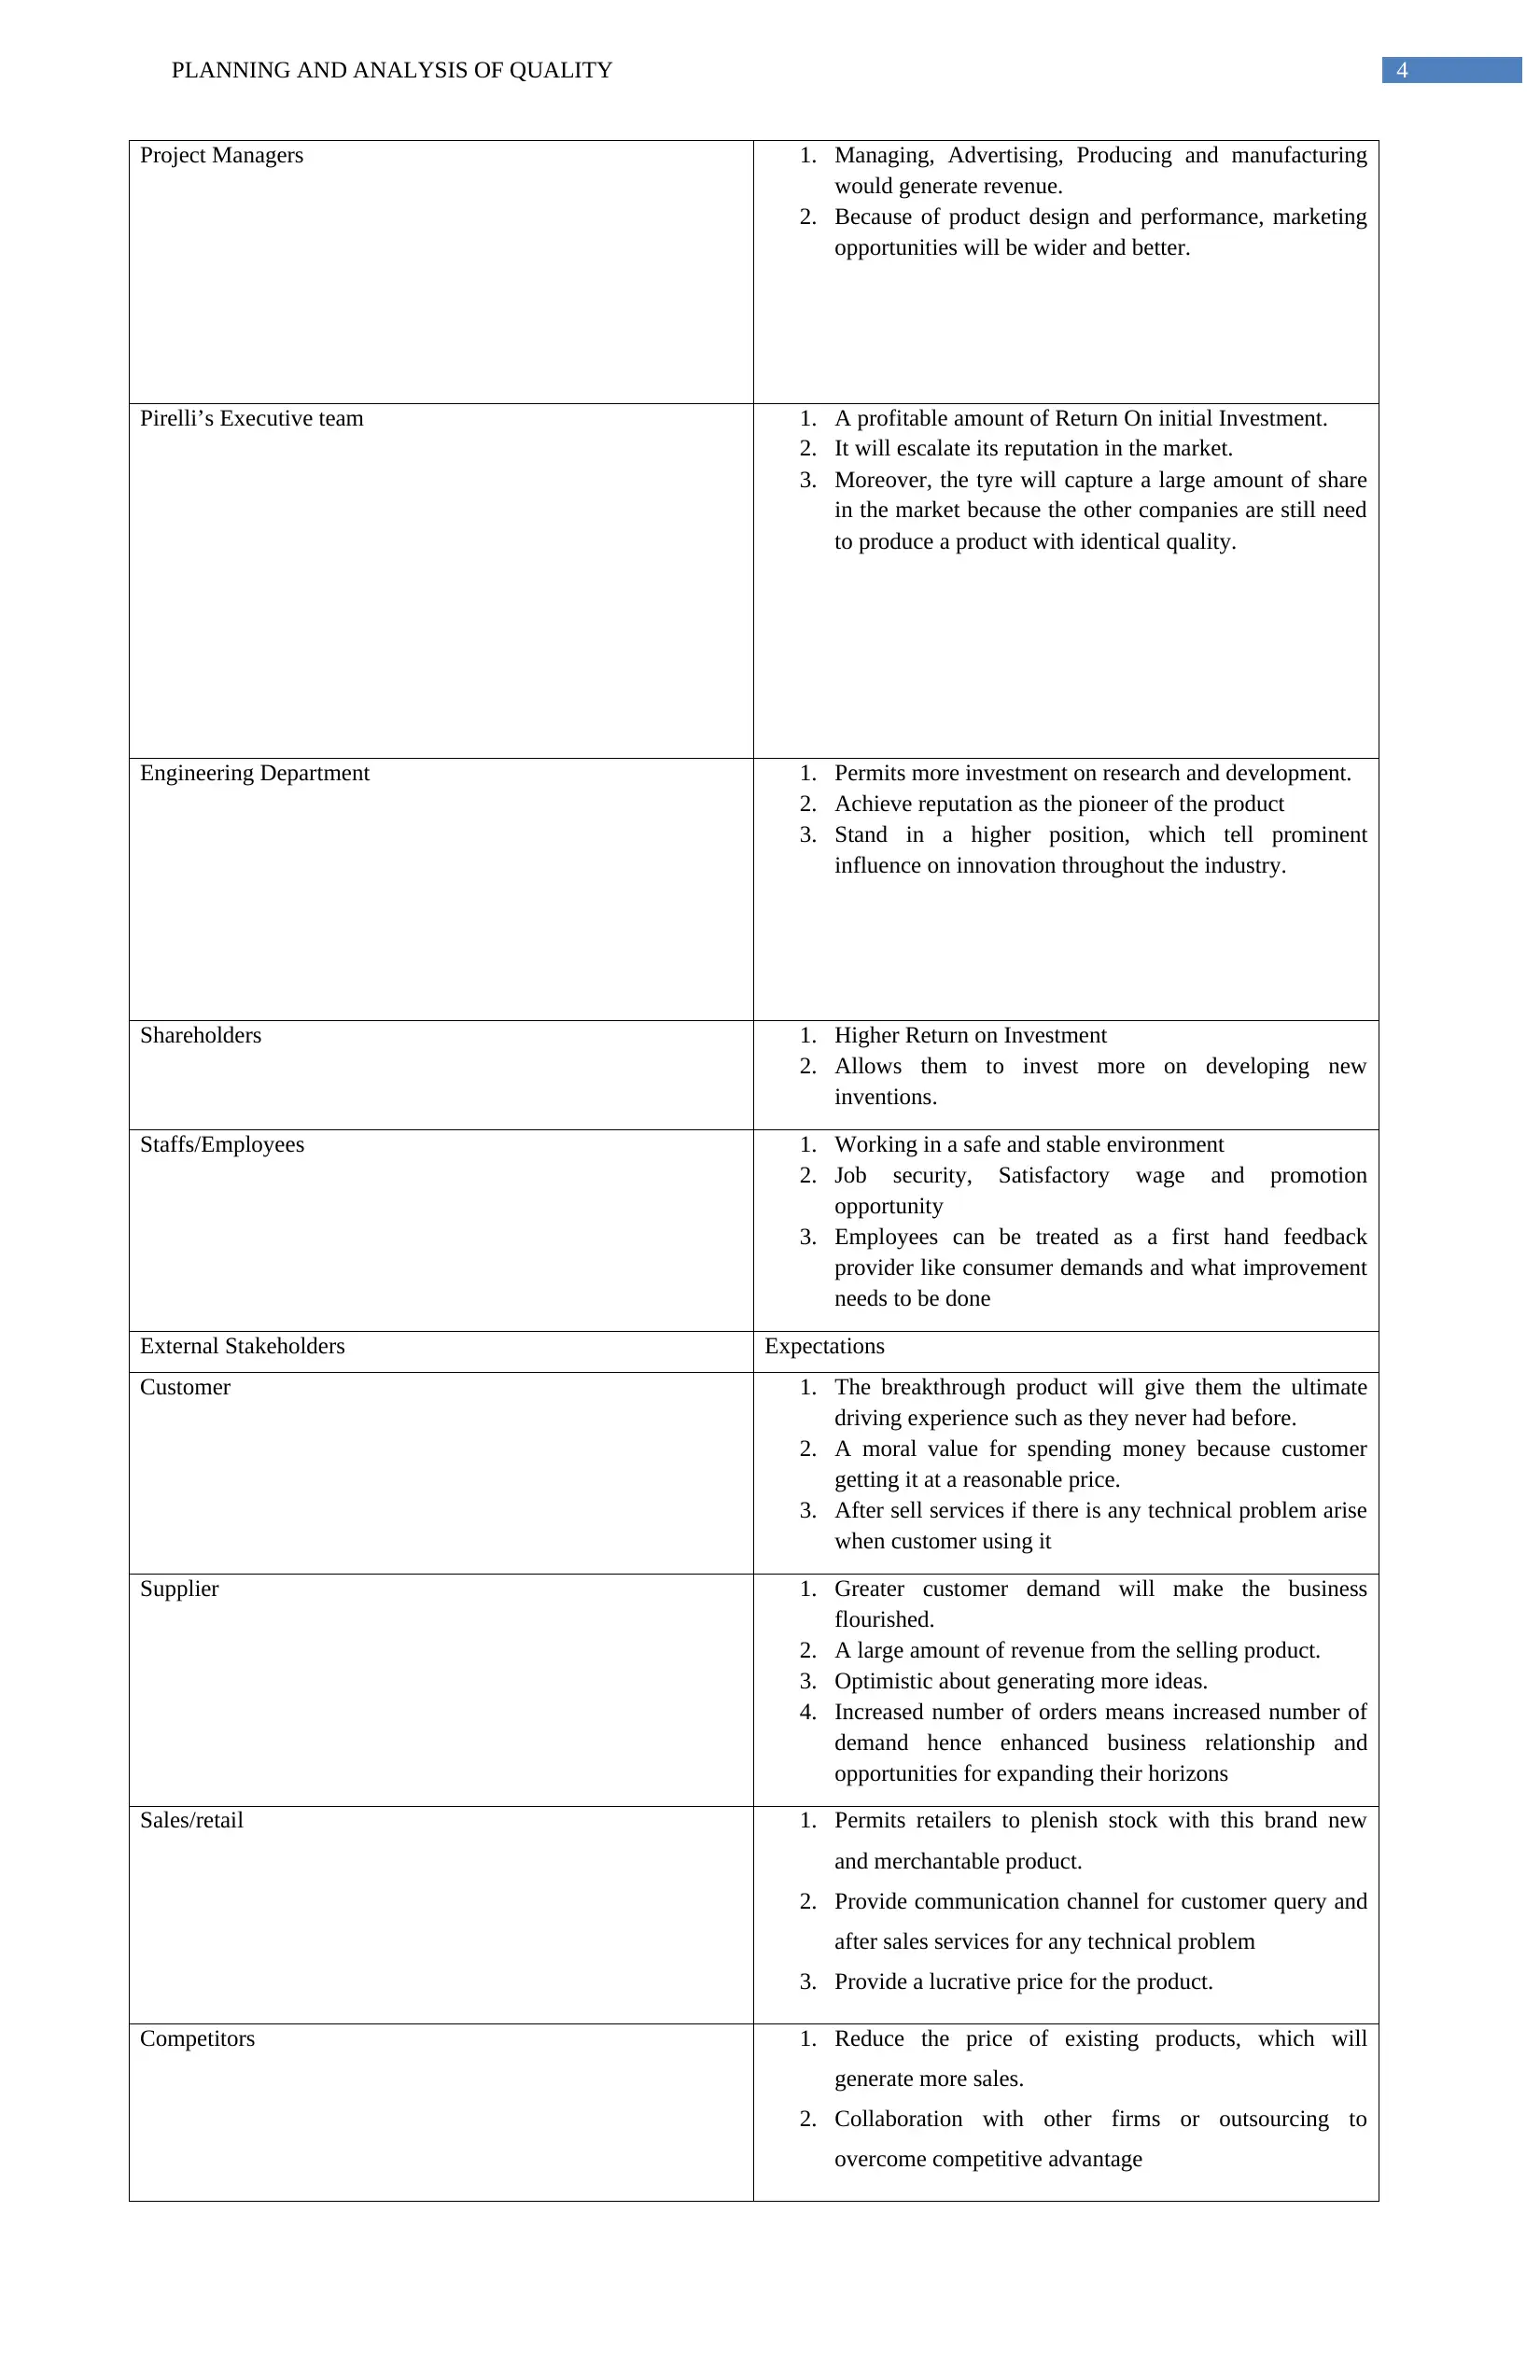
2.1. Stakeholder Analysis:
Internal Stakeholders Expectations
1. Introduction:-
The definition of ‘quality management’ involves the processes, relationships, organizational management and structures.
Quality is mobile condition associated with product and services that fulfils customer needs and expectations. It helps to produce
superior value. Quality is a state that changes frequently and provides three elements such as quality, superior cost and superior
service. The characteristics of total quality management have various outlooks. Quality organizations have strategic plan of vision,
mission, objectives and activities (Armstrong et al. 2015). Building awareness in both the need for improvement and opportunities
could increase quality characteristics.
The report incorporates the ideas of ‘quality management’ and explores the hypothesis that there is a vital link between quality
management and services. The report defines the existing quality development and control. It also suggests the statistical process
control measures, expected quality and continual improved process.
The rationale for quality management could be found to compete the global marketplace. Consumer satisfaction and expected
quality measure focus on the improvement of quality (Blut et al. 2017). According to this discussion, the three aspects and designs are
elaborated. The data and information given in the assignment is relevant to the topic and proficiently analyzed.
Overview of Quality Management characteristics:-
The market competition, total commitment and fundamental improvement are the major dimensions of quality management
(Simatupang and Sridharan 2014). It has mainly four objectives such as customer satisfaction, effectiveness, cost leadership and
integration with the supplier base. We have to make sure that the management is committed to quality for long-term basis. Our aim is
to encourage employees and solve the obstacles they face in attempting to meet quality goals. The determination, education and
implementation could define the zero defect management.
2. CUSTOMER SATISFACTION:
Rational costs have the strongest association with repurchase cost. Satisfaction-repurchase link could be mitigated by the
relational and procedural costs. Customer dis-satisfaction may directly or indirectly spoil marketing strategy. A meta-analysis of 233
effects from over 133,000 customers shows that the relational costs have the strongest association with repurchase behavior (Hanski et
al 2014). It also indicates the procedural and relational costs that associate between satisfaction and repurchase intentions. The product
and service development issues have to get sustainable solutions. Product developers, designers, consultancies, policy-makers would
focus on customer satisfaction.
The customer knowledge and customer satisfaction are correlated to each other. Now-a-days social media have transformed
the buyers and sellers interaction (Agnihotri et al. 2017). Findings and analyses reveal that social media has a vital role in
communicating information to customers. Therefore, to increase customer satisfaction, managers carefully assess targets related to the
social media due to demand of sales.
2.1. Stakeholder Analysis:
Internal Stakeholders Expectations
Paraphrase This Document
Need a fresh take? Get an instant paraphrase of this document with our AI Paraphraser
PLANNING AND ANALYSIS OF QUALITY 4
Project Managers 1. Managing, Advertising, Producing and manufacturing
would generate revenue.
2. Because of product design and performance, marketing
opportunities will be wider and better.
Pirelli’s Executive team 1. A profitable amount of Return On initial Investment.
2. It will escalate its reputation in the market.
3. Moreover, the tyre will capture a large amount of share
in the market because the other companies are still need
to produce a product with identical quality.
Engineering Department 1. Permits more investment on research and development.
2. Achieve reputation as the pioneer of the product
3. Stand in a higher position, which tell prominent
influence on innovation throughout the industry.
Shareholders 1. Higher Return on Investment
2. Allows them to invest more on developing new
inventions.
Staffs/Employees 1. Working in a safe and stable environment
2. Job security, Satisfactory wage and promotion
opportunity
3. Employees can be treated as a first hand feedback
provider like consumer demands and what improvement
needs to be done
External Stakeholders Expectations
Customer 1. The breakthrough product will give them the ultimate
driving experience such as they never had before.
2. A moral value for spending money because customer
getting it at a reasonable price.
3. After sell services if there is any technical problem arise
when customer using it
Supplier 1. Greater customer demand will make the business
flourished.
2. A large amount of revenue from the selling product.
3. Optimistic about generating more ideas.
4. Increased number of orders means increased number of
demand hence enhanced business relationship and
opportunities for expanding their horizons
Sales/retail 1. Permits retailers to plenish stock with this brand new
and merchantable product.
2. Provide communication channel for customer query and
after sales services for any technical problem
3. Provide a lucrative price for the product.
Competitors 1. Reduce the price of existing products, which will
generate more sales.
2. Collaboration with other firms or outsourcing to
overcome competitive advantage
PLANNING AND ANALYSIS OF QUALITY 5
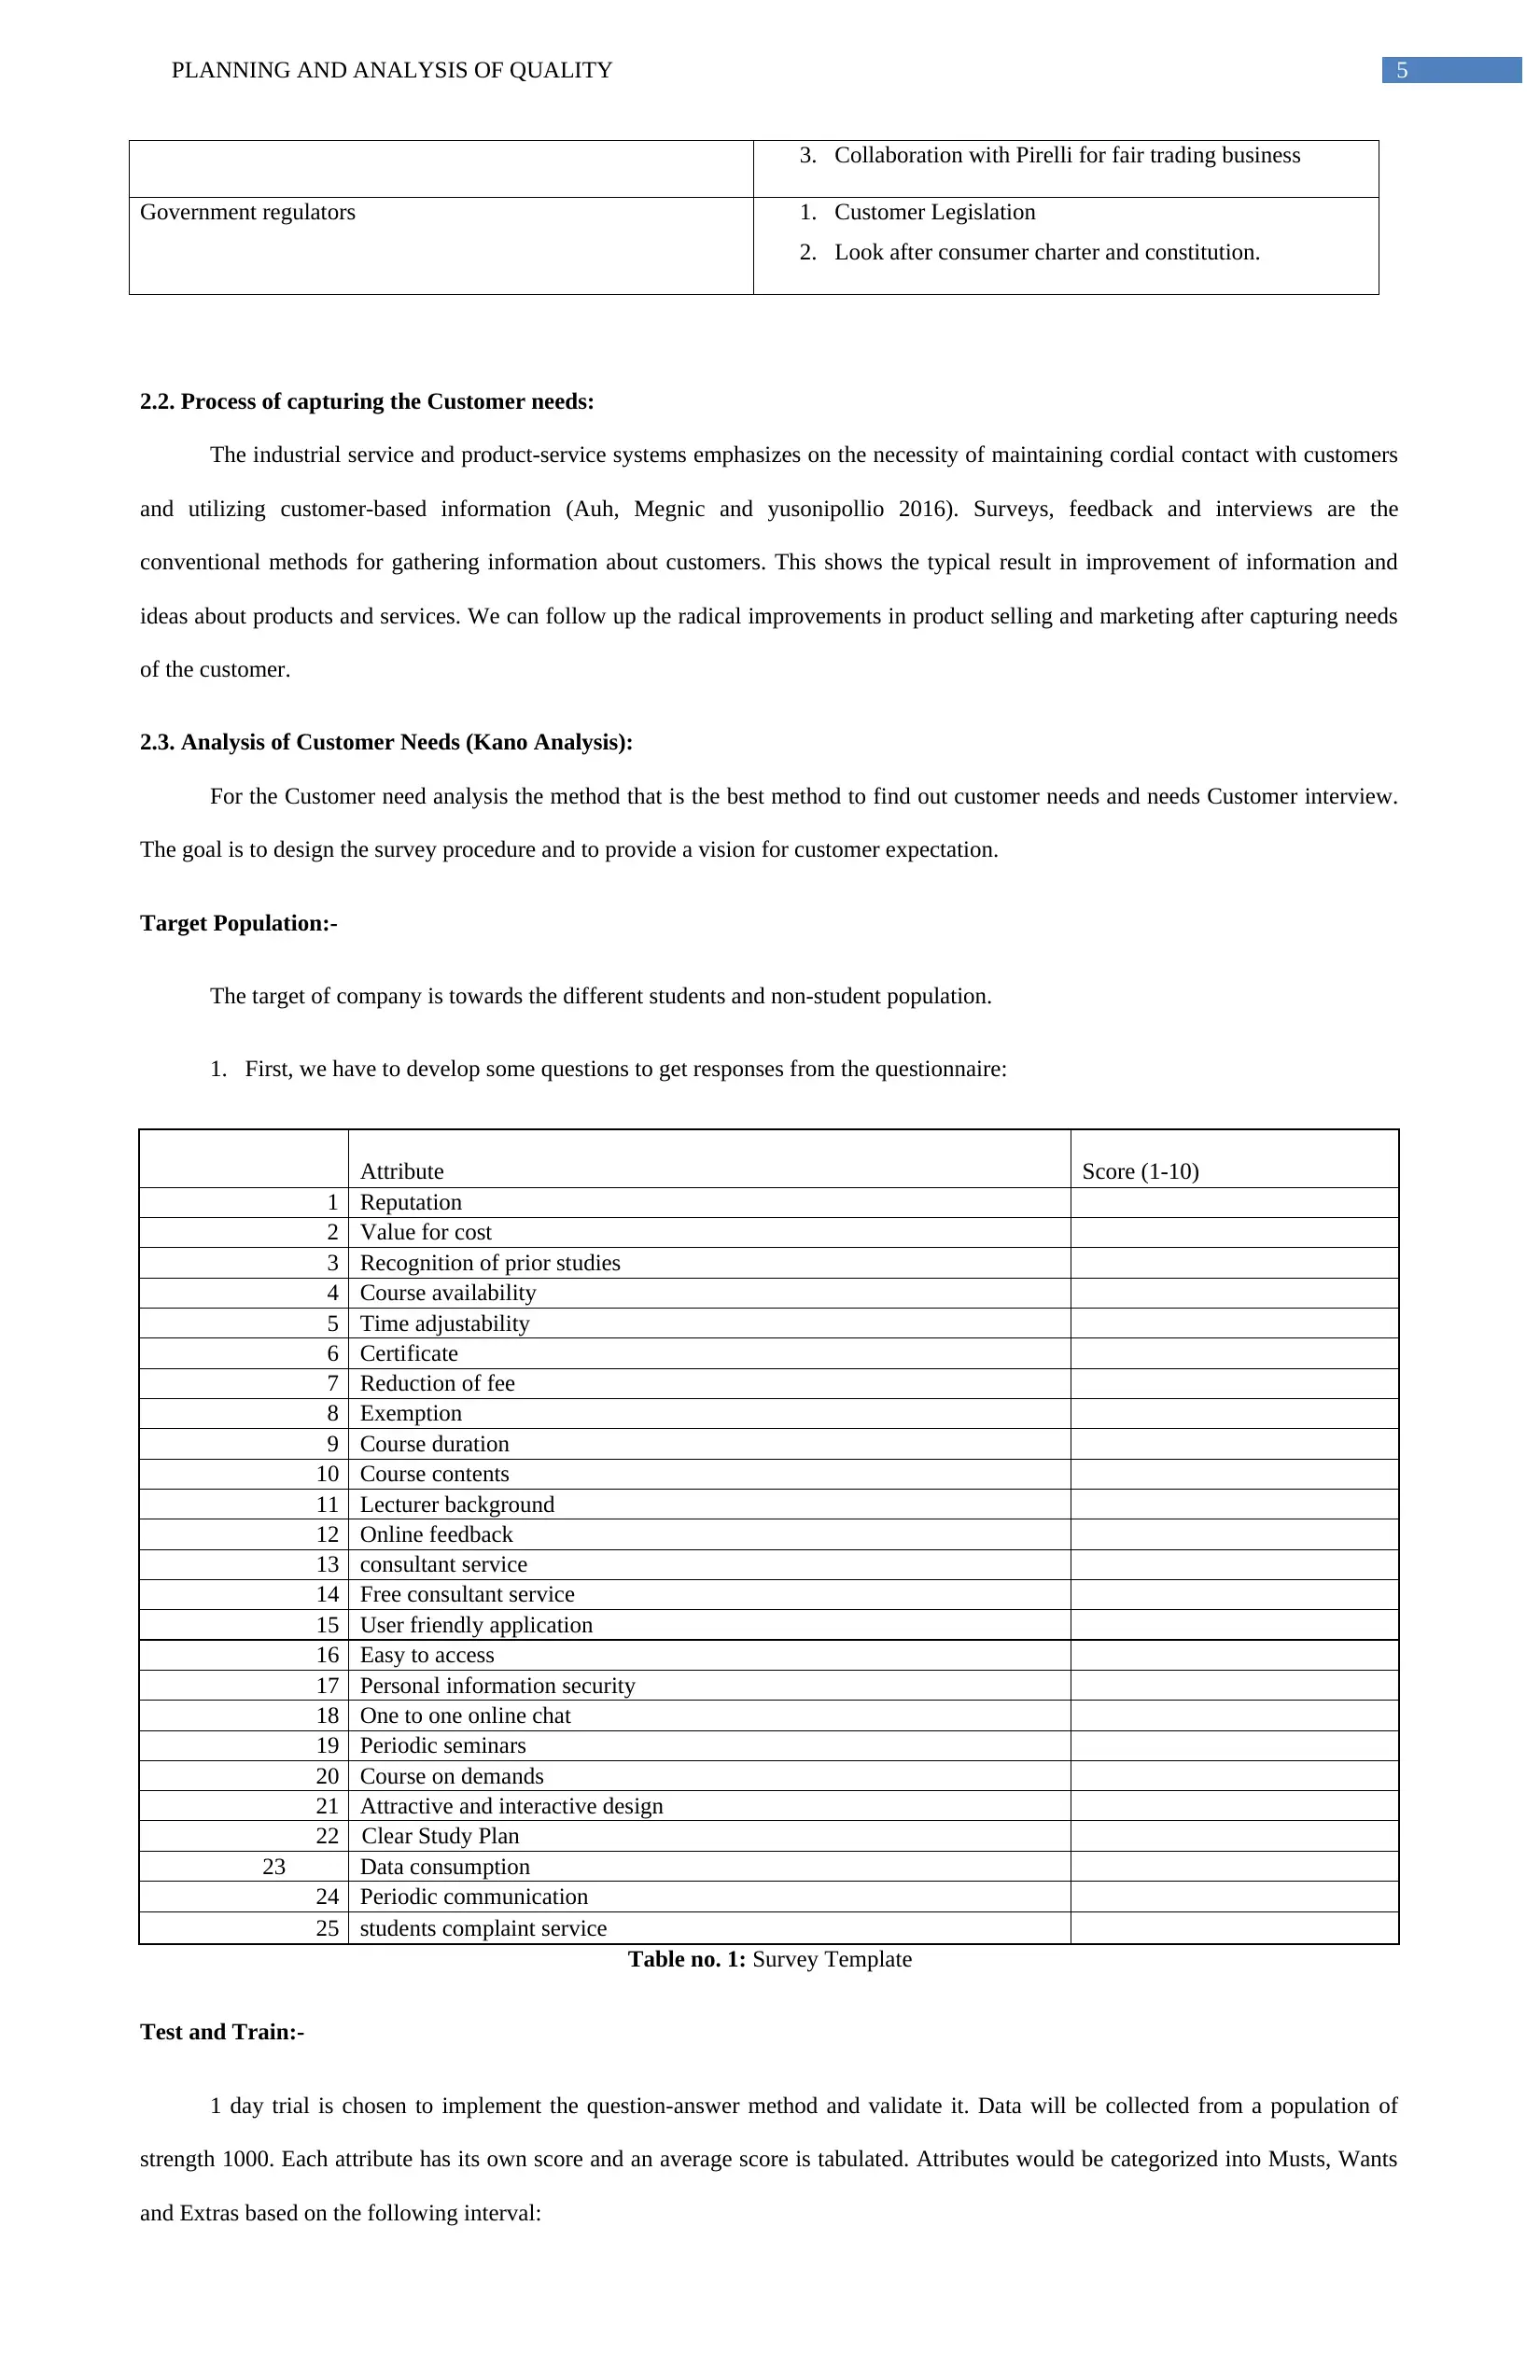
3. Collaboration with Pirelli for fair trading business
Government regulators 1. Customer Legislation
2. Look after consumer charter and constitution.
2.2. Process of capturing the Customer needs:
The industrial service and product-service systems emphasizes on the necessity of maintaining cordial contact with customers
and utilizing customer-based information (Auh, Megnic and yusonipollio 2016). Surveys, feedback and interviews are the
conventional methods for gathering information about customers. This shows the typical result in improvement of information and
ideas about products and services. We can follow up the radical improvements in product selling and marketing after capturing needs
of the customer.
2.3. Analysis of Customer Needs (Kano Analysis):
For the Customer need analysis the method that is the best method to find out customer needs and needs Customer interview.
The goal is to design the survey procedure and to provide a vision for customer expectation.
Target Population:-
The target of company is towards the different students and non-student population.
1. First, we have to develop some questions to get responses from the questionnaire:
Attribute Score (1-10)
1 Reputation
2 Value for cost
3 Recognition of prior studies
4 Course availability
5 Time adjustability
6 Certificate
7 Reduction of fee
8 Exemption
9 Course duration
10 Course contents
11 Lecturer background
12 Online feedback
13 consultant service
14 Free consultant service
15 User friendly application
16 Easy to access
17 Personal information security
18 One to one online chat
19 Periodic seminars
20 Course on demands
21 Attractive and interactive design
22 Clear Study Plan
23 Data consumption
24 Periodic communication
25 students complaint service
Table no. 1: Survey Template
Test and Train:-
1 day trial is chosen to implement the question-answer method and validate it. Data will be collected from a population of
strength 1000. Each attribute has its own score and an average score is tabulated. Attributes would be categorized into Musts, Wants
and Extras based on the following interval:
⊘ This is a preview!⊘
Do you want full access?
Subscribe today to unlock all pages.
Trusted by 1+ million students worldwide
PLANNING AND ANALYSIS OF QUALITY 6
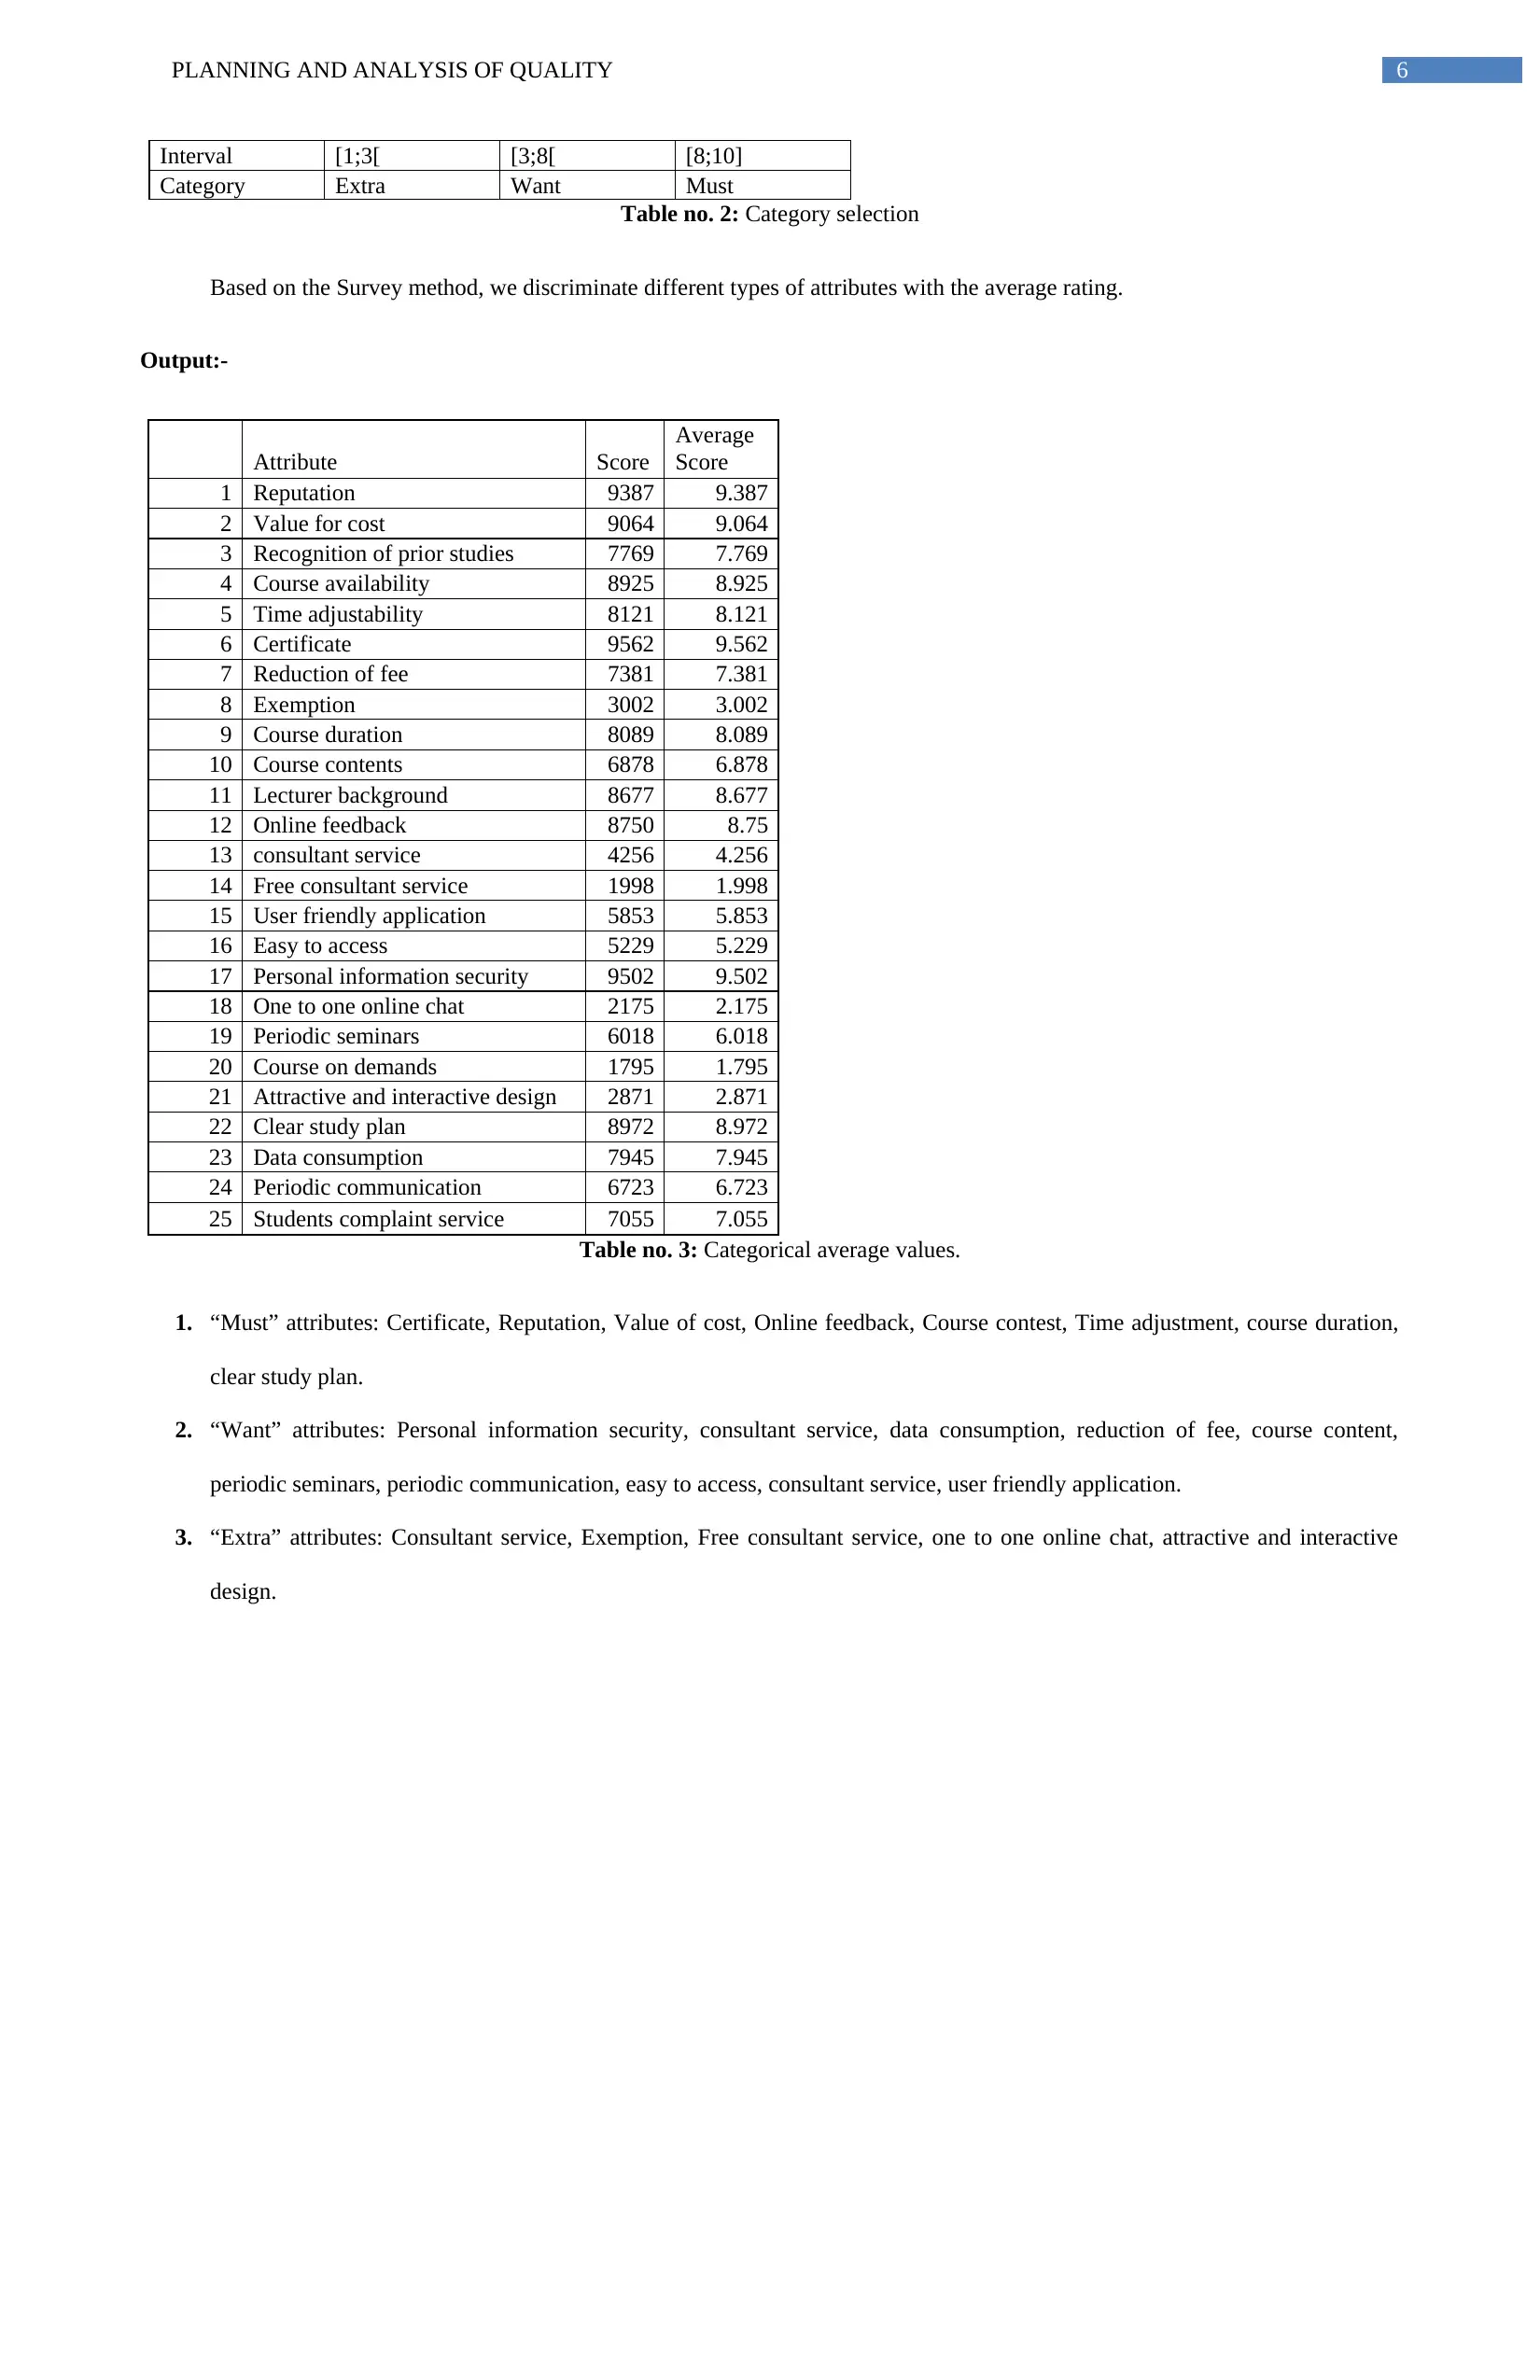
Interval [1;3[ [3;8[ [8;10]
Category Extra Want Must
Table no. 2: Category selection
Based on the Survey method, we discriminate different types of attributes with the average rating.
Output:-
Attribute Score
Average
Score
1 Reputation 9387 9.387
2 Value for cost 9064 9.064
3 Recognition of prior studies 7769 7.769
4 Course availability 8925 8.925
5 Time adjustability 8121 8.121
6 Certificate 9562 9.562
7 Reduction of fee 7381 7.381
8 Exemption 3002 3.002
9 Course duration 8089 8.089
10 Course contents 6878 6.878
11 Lecturer background 8677 8.677
12 Online feedback 8750 8.75
13 consultant service 4256 4.256
14 Free consultant service 1998 1.998
15 User friendly application 5853 5.853
16 Easy to access 5229 5.229
17 Personal information security 9502 9.502
18 One to one online chat 2175 2.175
19 Periodic seminars 6018 6.018
20 Course on demands 1795 1.795
21 Attractive and interactive design 2871 2.871
22 Clear study plan 8972 8.972
23 Data consumption 7945 7.945
24 Periodic communication 6723 6.723
25 Students complaint service 7055 7.055
Table no. 3: Categorical average values.
1. “Must” attributes: Certificate, Reputation, Value of cost, Online feedback, Course contest, Time adjustment, course duration,
clear study plan.
2. “Want” attributes: Personal information security, consultant service, data consumption, reduction of fee, course content,
periodic seminars, periodic communication, easy to access, consultant service, user friendly application.
3. “Extra” attributes: Consultant service, Exemption, Free consultant service, one to one online chat, attractive and interactive
design.
Paraphrase This Document
Need a fresh take? Get an instant paraphrase of this document with our AI Paraphraser
PLANNING AND ANALYSIS OF QUALITY 7
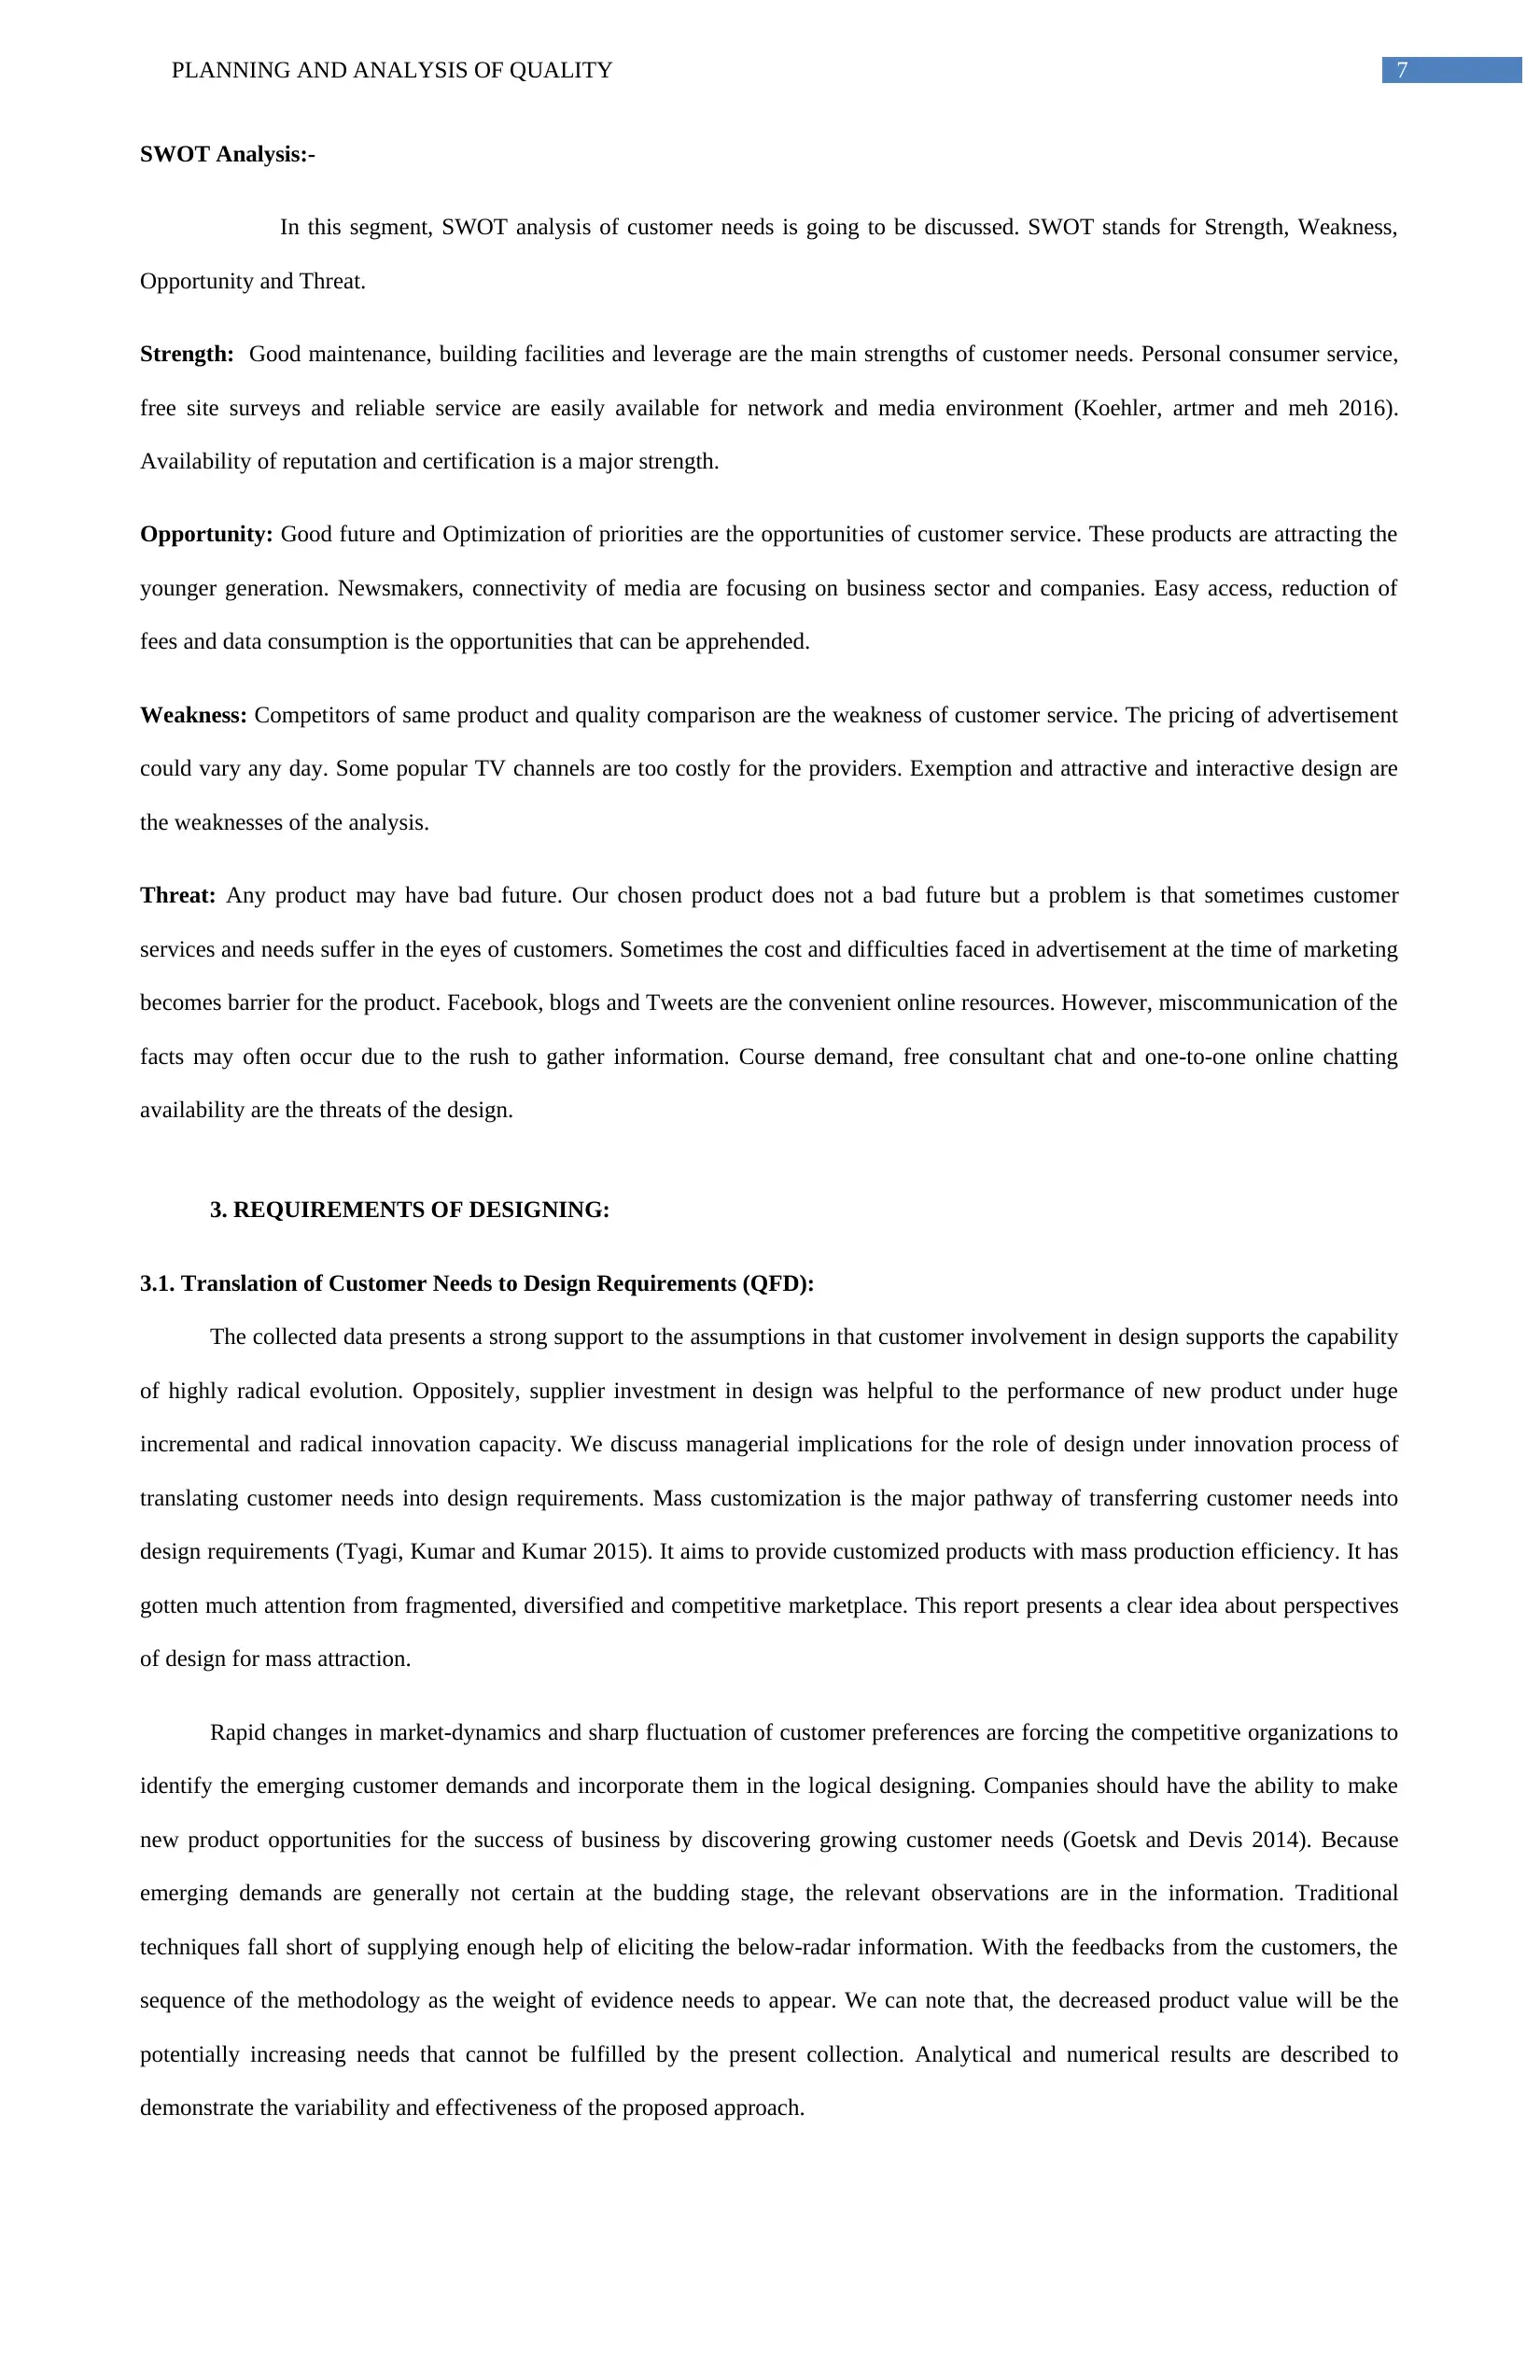
SWOT Analysis:-
In this segment, SWOT analysis of customer needs is going to be discussed. SWOT stands for Strength, Weakness,
Opportunity and Threat.
Strength: Good maintenance, building facilities and leverage are the main strengths of customer needs. Personal consumer service,
free site surveys and reliable service are easily available for network and media environment (Koehler, artmer and meh 2016).
Availability of reputation and certification is a major strength.
Opportunity: Good future and Optimization of priorities are the opportunities of customer service. These products are attracting the
younger generation. Newsmakers, connectivity of media are focusing on business sector and companies. Easy access, reduction of
fees and data consumption is the opportunities that can be apprehended.
Weakness: Competitors of same product and quality comparison are the weakness of customer service. The pricing of advertisement
could vary any day. Some popular TV channels are too costly for the providers. Exemption and attractive and interactive design are
the weaknesses of the analysis.
Threat: Any product may have bad future. Our chosen product does not a bad future but a problem is that sometimes customer
services and needs suffer in the eyes of customers. Sometimes the cost and difficulties faced in advertisement at the time of marketing
becomes barrier for the product. Facebook, blogs and Tweets are the convenient online resources. However, miscommunication of the
facts may often occur due to the rush to gather information. Course demand, free consultant chat and one-to-one online chatting
availability are the threats of the design.
3. REQUIREMENTS OF DESIGNING:
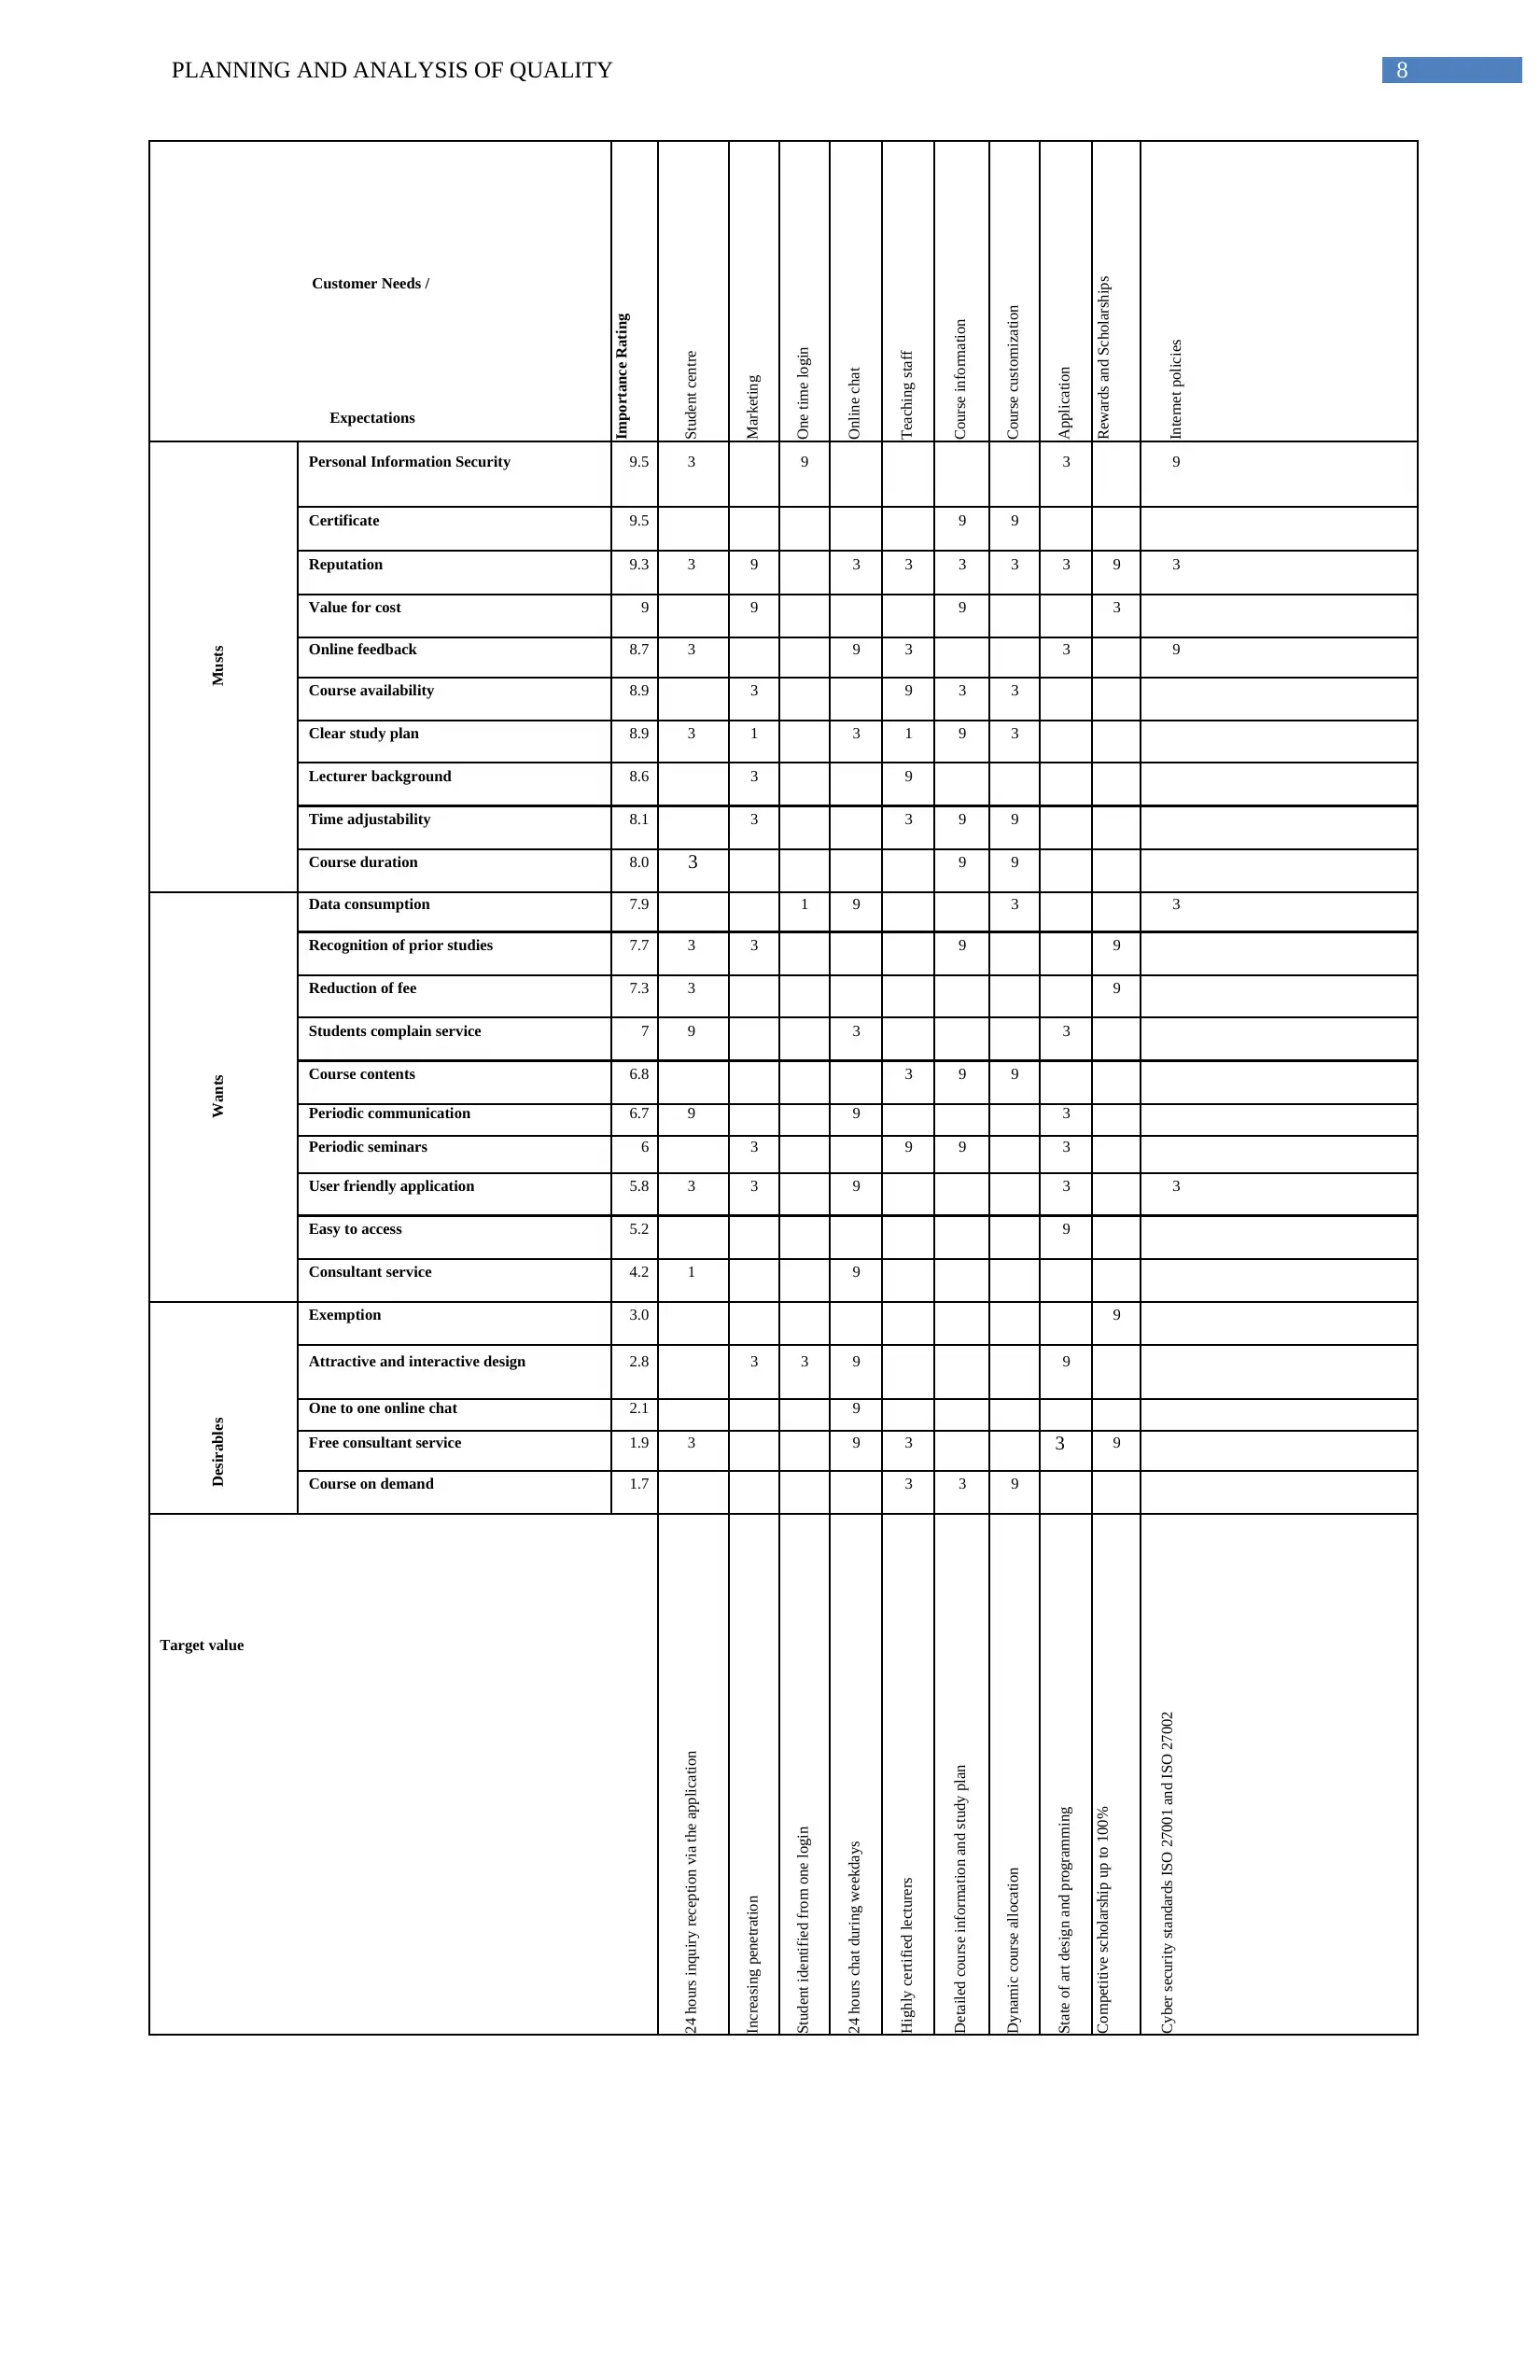
3.1. Translation of Customer Needs to Design Requirements (QFD):
The collected data presents a strong support to the assumptions in that customer involvement in design supports the capability
of highly radical evolution. Oppositely, supplier investment in design was helpful to the performance of new product under huge
incremental and radical innovation capacity. We discuss managerial implications for the role of design under innovation process of
translating customer needs into design requirements. Mass customization is the major pathway of transferring customer needs into
design requirements (Tyagi, Kumar and Kumar 2015). It aims to provide customized products with mass production efficiency. It has
gotten much attention from fragmented, diversified and competitive marketplace. This report presents a clear idea about perspectives
of design for mass attraction.
Rapid changes in market-dynamics and sharp fluctuation of customer preferences are forcing the competitive organizations to
identify the emerging customer demands and incorporate them in the logical designing. Companies should have the ability to make
new product opportunities for the success of business by discovering growing customer needs (Goetsk and Devis 2014). Because
emerging demands are generally not certain at the budding stage, the relevant observations are in the information. Traditional
techniques fall short of supplying enough help of eliciting the below-radar information. With the feedbacks from the customers, the
sequence of the methodology as the weight of evidence needs to appear. We can note that, the decreased product value will be the
potentially increasing needs that cannot be fulfilled by the present collection. Analytical and numerical results are described to
demonstrate the variability and effectiveness of the proposed approach.
SWOT Analysis:-
In this segment, SWOT analysis of customer needs is going to be discussed. SWOT stands for Strength, Weakness,
Opportunity and Threat.
Strength: Good maintenance, building facilities and leverage are the main strengths of customer needs. Personal consumer service,
free site surveys and reliable service are easily available for network and media environment (Koehler, artmer and meh 2016).
Availability of reputation and certification is a major strength.
Opportunity: Good future and Optimization of priorities are the opportunities of customer service. These products are attracting the
younger generation. Newsmakers, connectivity of media are focusing on business sector and companies. Easy access, reduction of
fees and data consumption is the opportunities that can be apprehended.
Weakness: Competitors of same product and quality comparison are the weakness of customer service. The pricing of advertisement
could vary any day. Some popular TV channels are too costly for the providers. Exemption and attractive and interactive design are
the weaknesses of the analysis.
Threat: Any product may have bad future. Our chosen product does not a bad future but a problem is that sometimes customer
services and needs suffer in the eyes of customers. Sometimes the cost and difficulties faced in advertisement at the time of marketing
becomes barrier for the product. Facebook, blogs and Tweets are the convenient online resources. However, miscommunication of the
facts may often occur due to the rush to gather information. Course demand, free consultant chat and one-to-one online chatting
availability are the threats of the design.
3. REQUIREMENTS OF DESIGNING:
3.1. Translation of Customer Needs to Design Requirements (QFD):
The collected data presents a strong support to the assumptions in that customer involvement in design supports the capability
of highly radical evolution. Oppositely, supplier investment in design was helpful to the performance of new product under huge
incremental and radical innovation capacity. We discuss managerial implications for the role of design under innovation process of
translating customer needs into design requirements. Mass customization is the major pathway of transferring customer needs into
design requirements (Tyagi, Kumar and Kumar 2015). It aims to provide customized products with mass production efficiency. It has
gotten much attention from fragmented, diversified and competitive marketplace. This report presents a clear idea about perspectives
of design for mass attraction.
Rapid changes in market-dynamics and sharp fluctuation of customer preferences are forcing the competitive organizations to
identify the emerging customer demands and incorporate them in the logical designing. Companies should have the ability to make
new product opportunities for the success of business by discovering growing customer needs (Goetsk and Devis 2014). Because
emerging demands are generally not certain at the budding stage, the relevant observations are in the information. Traditional
techniques fall short of supplying enough help of eliciting the below-radar information. With the feedbacks from the customers, the
sequence of the methodology as the weight of evidence needs to appear. We can note that, the decreased product value will be the
potentially increasing needs that cannot be fulfilled by the present collection. Analytical and numerical results are described to
demonstrate the variability and effectiveness of the proposed approach.
PLANNING AND ANALYSIS OF QUALITY 8
Customer Needs /
Importance Rating
Student centre
Marketing
One time login
Online chat
Teaching staff
Course information
Course customization
Application
Rewards and Scholarships
Internet policies
Expectations
Musts
Personal Information Security 9.5 3 9 3 9
Certificate 9.5 9 9
Reputation 9.3 3 9 3 3 3 3 3 9 3
Value for cost 9 9 9 3
Online feedback 8.7 3 9 3 3 9
Course availability 8.9 3 9 3 3
Clear study plan 8.9 3 1 3 1 9 3
Lecturer background 8.6 3 9
Time adjustability 8.1 3 3 9 9
Course duration 8.0 3 9 9
Wants
Data consumption 7.9 1 9 3 3
Recognition of prior studies 7.7 3 3 9 9
Reduction of fee 7.3 3 9
Students complain service 7 9 3 3
Course contents 6.8 3 9 9
Periodic communication 6.7 9 9 3
Periodic seminars 6 3 9 9 3
User friendly application 5.8 3 3 9 3 3
Easy to access 5.2 9
Consultant service 4.2 1 9
99
Desirables
Exemption 3.0 9
Attractive and interactive design 2.8 3 3 9 9
One to one online chat 2.1 9
Free consultant service 1.9 3 9 3 3 9
Course on demand 1.7 3 3 9
Target value
24 hours inquiry reception via the application
Increasing penetration
Student identified from one login
24 hours chat during weekdays
Highly certified lecturers
Detailed course information and study plan
Dynamic course allocation
State of art design and programming
Competitive scholarship up to 100%
Cyber security standards ISO 27001 and ISO 27002
⊘ This is a preview!⊘
Do you want full access?
Subscribe today to unlock all pages.
Trusted by 1+ million students worldwide
PLANNING AND ANALYSIS OF QUALITY 9
Absolute score (total) 329 313 107 421 318 624 417 279 287 226
Part or
function
Potenti
al
failur
e
Effect
on
syste
m
Root
Cause
Risk
before
Action
taken
Action to
reduce
risk
Risk after action
taken
of failure P S R P S R
COURSE
INFORMA
TION
Incorrect
informatio
n
Dissatisfi
ed student No
review
1 4 6
Periodic review
from an
educational
consultancy
firm
-Offer a course
change with a full
1 1 1
ONLINE
CHAT
Connecti
on loss
Service
unavailab
le
Unplanne
d server
update
2 4 5 Stick to a prior
update planning
1 3 3
COURSE
CUSTOMIZA
TION
Subject
unavailab
le
Uncomplet
ed course /
No
graduation
Full
number of
student
attended
4 6 9
-One year
enrolment
prior
planning.
-Open a new
subject class.
1 1 3
STUDENT
CENTER
No
inquiries
responses.
No
service /
unsatisfied
student
No
staff
availab
le
5 6 8 On call staff. 1 3 5
TEACHING
STAFF
Incomple
te answer
No accurate
response to
student /
dissatisfacti
on
Uncertaint
y of
answer
1 2 5
-Periodic Teaching
staff training
-Search for
response after
session and
send it back
to student
1 1 1
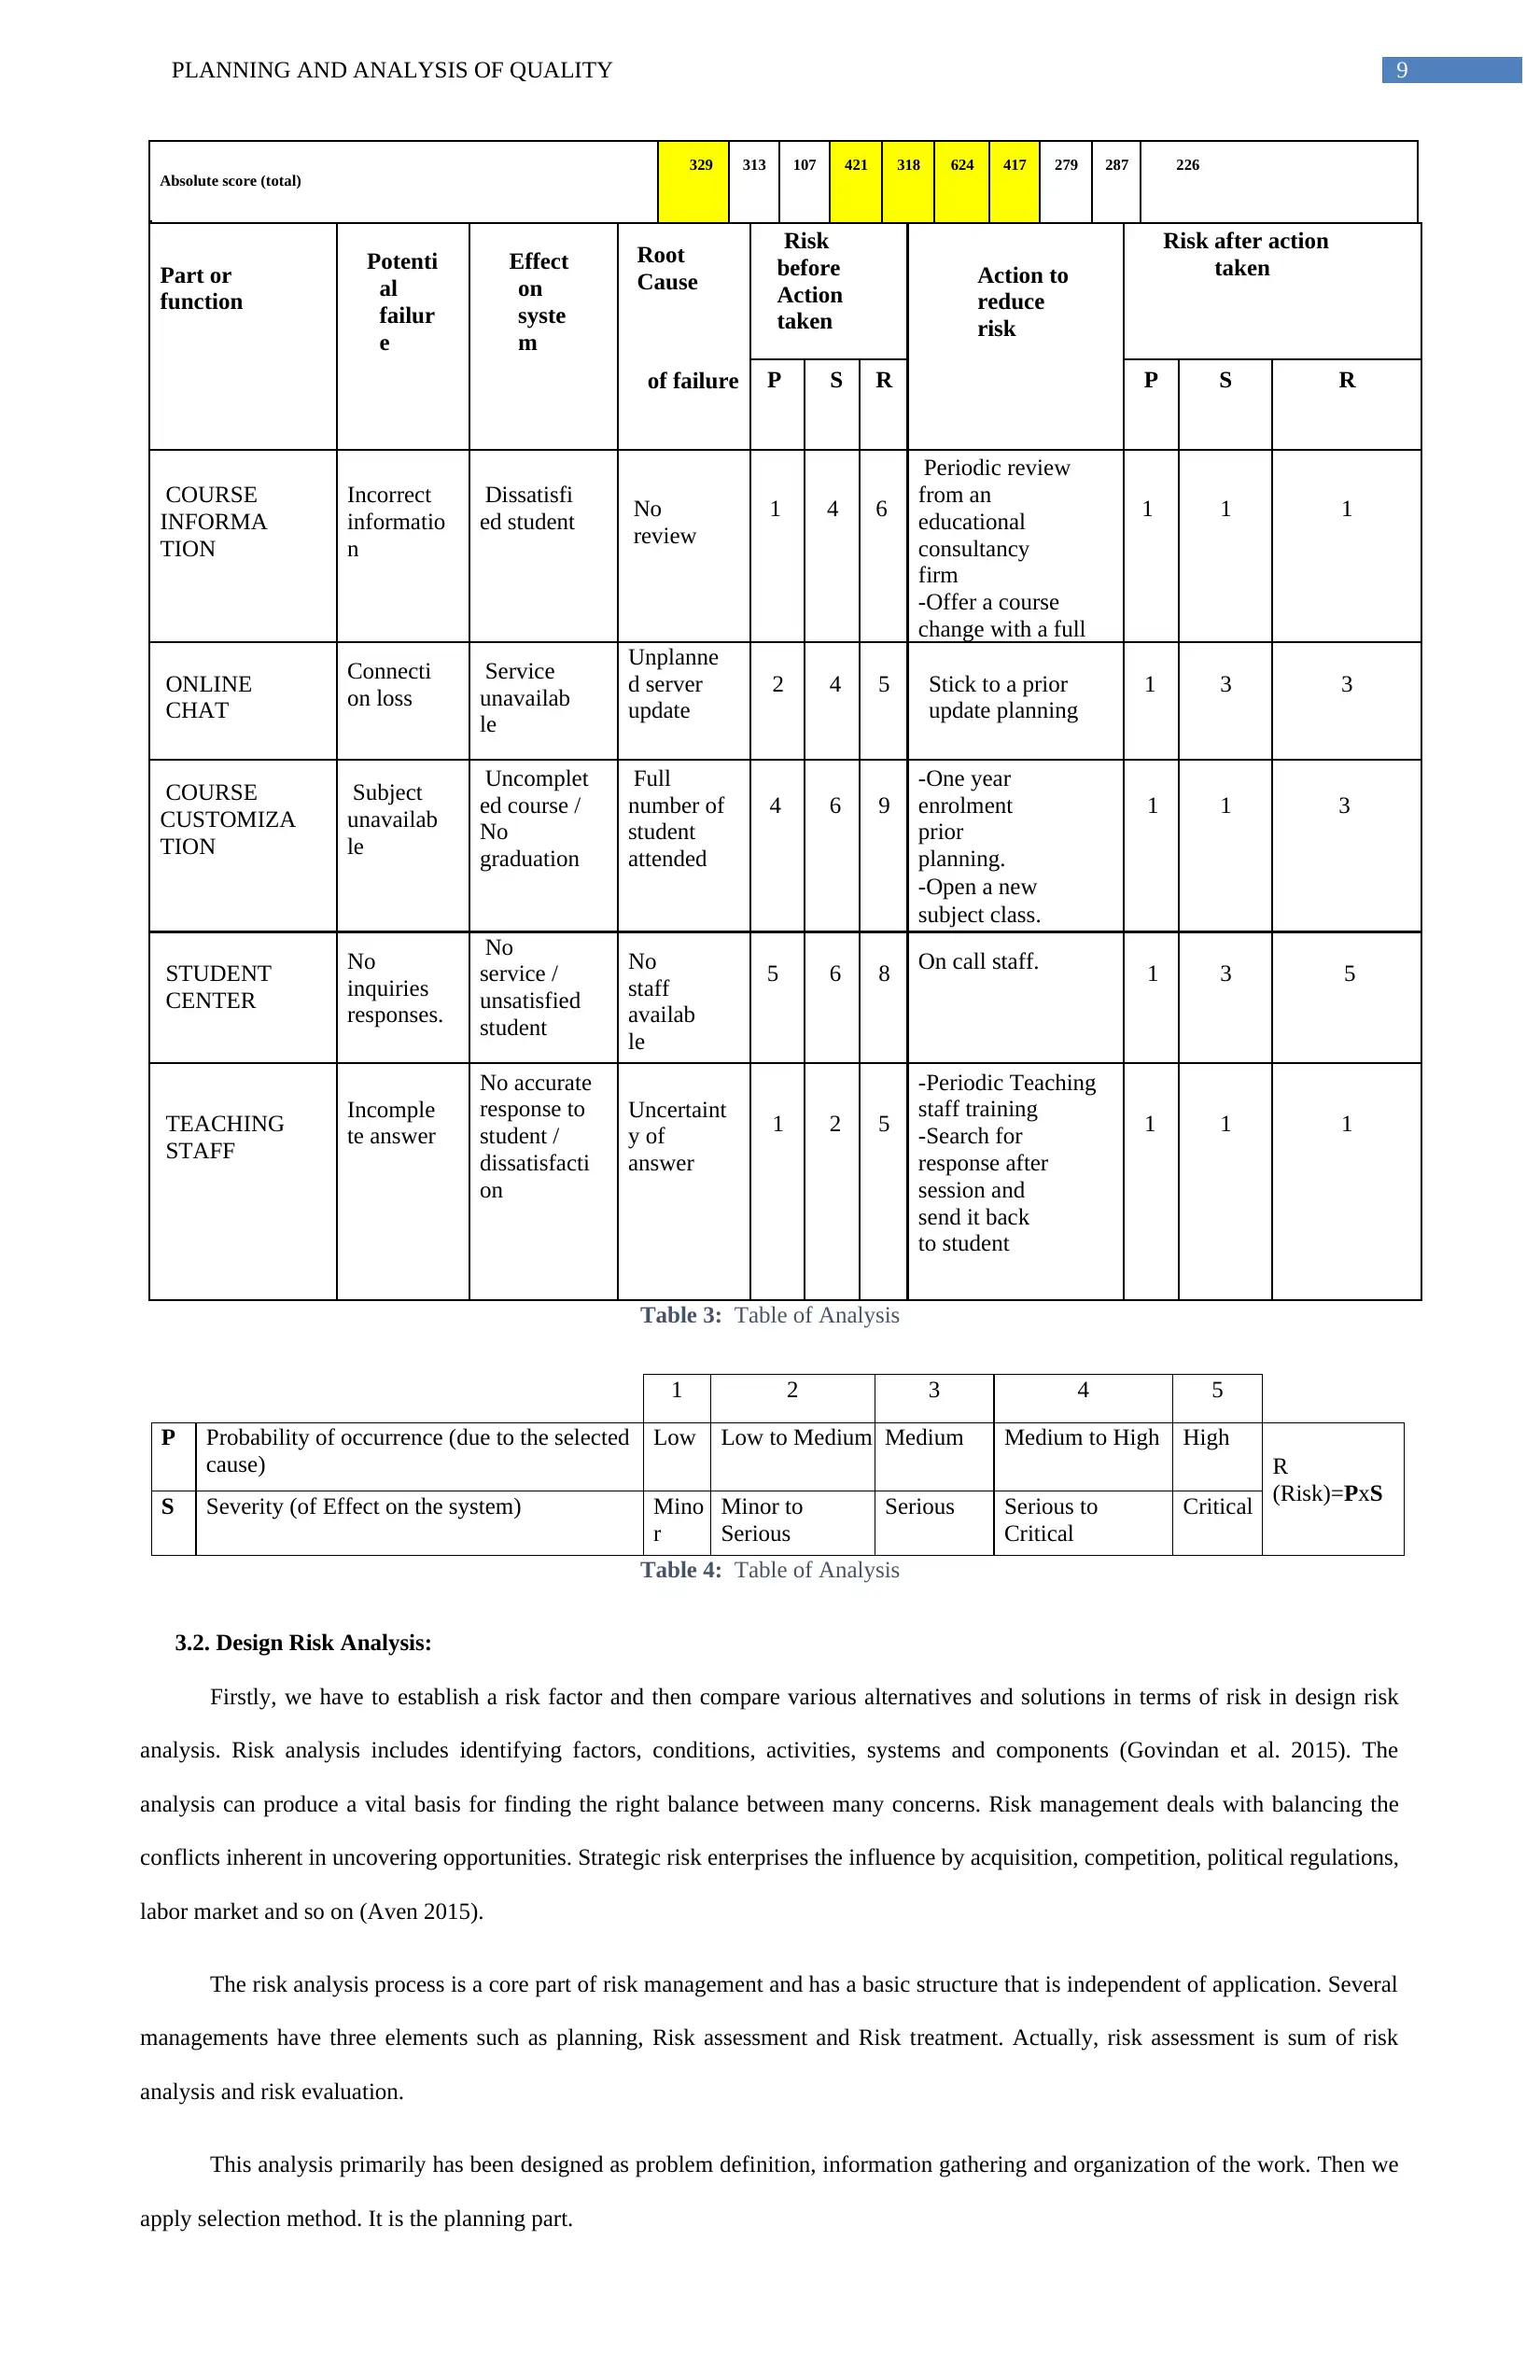
Table 3: Table of Analysis
1 2 3 4 5
P Probability of occurrence (due to the selected
cause)
Low Low to Medium Medium Medium to High High
R
(Risk)=PxS
S Severity (of Effect on the system) Mino
r
Minor to
Serious
Serious Serious to
Critical
Critical
Table 4: Table of Analysis
3.2. Design Risk Analysis:
Firstly, we have to establish a risk factor and then compare various alternatives and solutions in terms of risk in design risk
analysis. Risk analysis includes identifying factors, conditions, activities, systems and components (Govindan et al. 2015). The
analysis can produce a vital basis for finding the right balance between many concerns. Risk management deals with balancing the
conflicts inherent in uncovering opportunities. Strategic risk enterprises the influence by acquisition, competition, political regulations,
labor market and so on (Aven 2015).
The risk analysis process is a core part of risk management and has a basic structure that is independent of application. Several
managements have three elements such as planning, Risk assessment and Risk treatment. Actually, risk assessment is sum of risk
analysis and risk evaluation.
This analysis primarily has been designed as problem definition, information gathering and organization of the work. Then we
apply selection method. It is the planning part.
Absolute score (total) 329 313 107 421 318 624 417 279 287 226
Part or
function
Potenti
al
failur
e
Effect
on
syste
m
Root
Cause
Risk
before
Action
taken
Action to
reduce
risk
Risk after action
taken
of failure P S R P S R
COURSE
INFORMA
TION
Incorrect
informatio
n
Dissatisfi
ed student No
review
1 4 6
Periodic review
from an
educational
consultancy
firm
-Offer a course
change with a full
1 1 1
ONLINE
CHAT
Connecti
on loss
Service
unavailab
le
Unplanne
d server
update
2 4 5 Stick to a prior
update planning
1 3 3
COURSE
CUSTOMIZA
TION
Subject
unavailab
le
Uncomplet
ed course /
No
graduation
Full
number of
student
attended
4 6 9
-One year
enrolment
prior
planning.
-Open a new
subject class.
1 1 3
STUDENT
CENTER
No
inquiries
responses.
No
service /
unsatisfied
student
No
staff
availab
le
5 6 8 On call staff. 1 3 5
TEACHING
STAFF
Incomple
te answer
No accurate
response to
student /
dissatisfacti
on
Uncertaint
y of
answer
1 2 5
-Periodic Teaching
staff training
-Search for
response after
session and
send it back
to student
1 1 1
Table 3: Table of Analysis
1 2 3 4 5
P Probability of occurrence (due to the selected
cause)
Low Low to Medium Medium Medium to High High
R
(Risk)=PxS
S Severity (of Effect on the system) Mino
r
Minor to
Serious
Serious Serious to
Critical
Critical
Table 4: Table of Analysis
3.2. Design Risk Analysis:
Firstly, we have to establish a risk factor and then compare various alternatives and solutions in terms of risk in design risk
analysis. Risk analysis includes identifying factors, conditions, activities, systems and components (Govindan et al. 2015). The
analysis can produce a vital basis for finding the right balance between many concerns. Risk management deals with balancing the
conflicts inherent in uncovering opportunities. Strategic risk enterprises the influence by acquisition, competition, political regulations,
labor market and so on (Aven 2015).
The risk analysis process is a core part of risk management and has a basic structure that is independent of application. Several
managements have three elements such as planning, Risk assessment and Risk treatment. Actually, risk assessment is sum of risk
analysis and risk evaluation.
This analysis primarily has been designed as problem definition, information gathering and organization of the work. Then we
apply selection method. It is the planning part.
Paraphrase This Document
Need a fresh take? Get an instant paraphrase of this document with our AI Paraphraser
PLANNING AND ANALYSIS OF QUALITY 10
The risk management includes three parts. Firstly, identification of initiating events, then cause analysis or consequence
analysis is handled. Lastly, risk picture is presented to the organization.
Final part is risk treatment. Here, two major tasks are done. The first one is the comparison of alternatives and assessment of
measures (Wu and Burnes 2016). Second one is management review and judgment decision.
4.SUPPLIER SELECTION AND EVALUATION:
4.1. Identification of Component elements:
The leading ten components of selections of our product or services are the-
1. Application programmer
2. Higher education consultancy firm
3. Billing system
4. Seminar planner
5. Data consumption record
6. Market analysis and statistics record
7. Accounting consultants
8. Lecturer
9. IT services
10. Law and regulation consultancy
4.2. Method of developing the Supplier Selection System:
The system dynamic model is consists of upstream and downstream customers in a supply chain (Wei and Chen 2017).
Autonomous entities and their partners prefer to collaborate in a supply chain allay to take the advantage of the highly competitive
business situation. Supplier selection system and distribution has a deep impact on Samsung’s business environment. A supplier
selection system addresses a supply chain including investors, suppliers and retailers. It proposes a tendency to select the downstream
and upstream partner selection. This tendency affects the policies in the whole supply chain (Charter and Tischner 2017).
The 10 selection criterion of managers that is used to select the provider is given by:
1. Reputation
2. Cost
3. Response time
4. Location
5. Certification
6. Impact factor
7. Previous work
8. Loyalty
9. Customer service
10. Number of course that it can review

PLANNING AND ANALYSIS OF QUALITY 11
4.3. Construction and Use of a Supplier Selection System:
Application and practical performance of an automobile company indicates the fast-track of equipment manufacturing
industry. The supply selection system of an electronic gadget like cell phones is constructed by combination of analytical network
process (ANP) and multi-objective programming (MOP) methodologies (Dobos and Vorosmarty 2015).Evaluation and promotion of
quantitative and qualitative attributes is a challenging issue (Wu and Chung 2016). The main problem of selling the mobile sets could
be analyzed by Analytical Hierarchical Process (AHP) quantitatively.Comprehensive Evaluation Index (CEI) could determine the
optimal selling of Samsung set. It could indicate the references to select the reasonable mobile to for the customers. Realistic scenario
of different devices, vehicles and inhibitors of carbon emission in the industry is constructed by supply chain and carbon saving in
automobile sectors.
In case of heavy equipment industry, heavy-duty vehicles hold an important role in execution of construction projects and
production operation. Often it is shown that company faces scarcity of sufficient information to deliver a preface of the identifications
of the heavy equipment supply. Therefore, these companies lack communication and incentives (Hsu 2017). The pharmaceutical
supply chain explores unique characterization of production, distribution and utilization cycles (Kannan et al 2014). Sector like
Green Supply Management (GSCM) are prospering and compromising among the business competition of organizations. All
organizations are emphasizing on design for environment, waste management, recycling process, information sharing with the help of
providers, web based technologies and manufacturing innovations.
Suppliers
Selection criteria
degree of
importance
U lead
Education
professionals Global educational consultant
Score
Weighted
score Score
Weighted score
Score
Weighted score
Reputation 3 7 21 9 27 8 24
cost 1 8 8 9 9 6 6
Response time 2 9 18 6 12 9 18
location 1 8 8 6 6 8 8
certification 4 8 32 5 20 9 36
impact factor 6 5 30 6 36 8 48
previous work 3 6 18 9 27 7 21
loyalty 6 8 48 6 36 8 48
customer service 2 7 14 6 12 9 18
number of course
that it can review 3 8 24 8 24 9 27
Total 74 221 70 209 81 254
Table 5: Table of Analysis of supplier selected system.
4.4. Conclusion:-
The case study demonstrates that organizations can open a space and draw in resources that follow time and consideration of
the collection of issues. Through the Technique for Order of Preference by Similarity to Ideal Solution (TOPSIS), we can choose the
best alternative to improve the performance. The capacity Building suggests the alternative web-based technologies and social media
to consider a significant effect in enhancing the performance of a service (Tseng and Hu 2014). The transformation of smart world is
looking for proper transport, good services and excellent marketing of supplier selection systems.
⊘ This is a preview!⊘
Do you want full access?
Subscribe today to unlock all pages.
Trusted by 1+ million students worldwide
1 out of 19
Related Documents


Your All-in-One AI-Powered Toolkit for Academic Success.
+13062052269
info@desklib.com
Available 24*7 on WhatsApp / Email
![[object Object]](/_next/static/media/star-bottom.7253800d.svg)
Unlock your academic potential
Copyright © 2020–2026 A2Z Services. All Rights Reserved. Developed and managed by ZUCOL.