Data Analysis Project: Pleasant Aromas and Student Learning

Verified

Added on  2022/11/27

|12
|2149
|397
Project
AI Summary
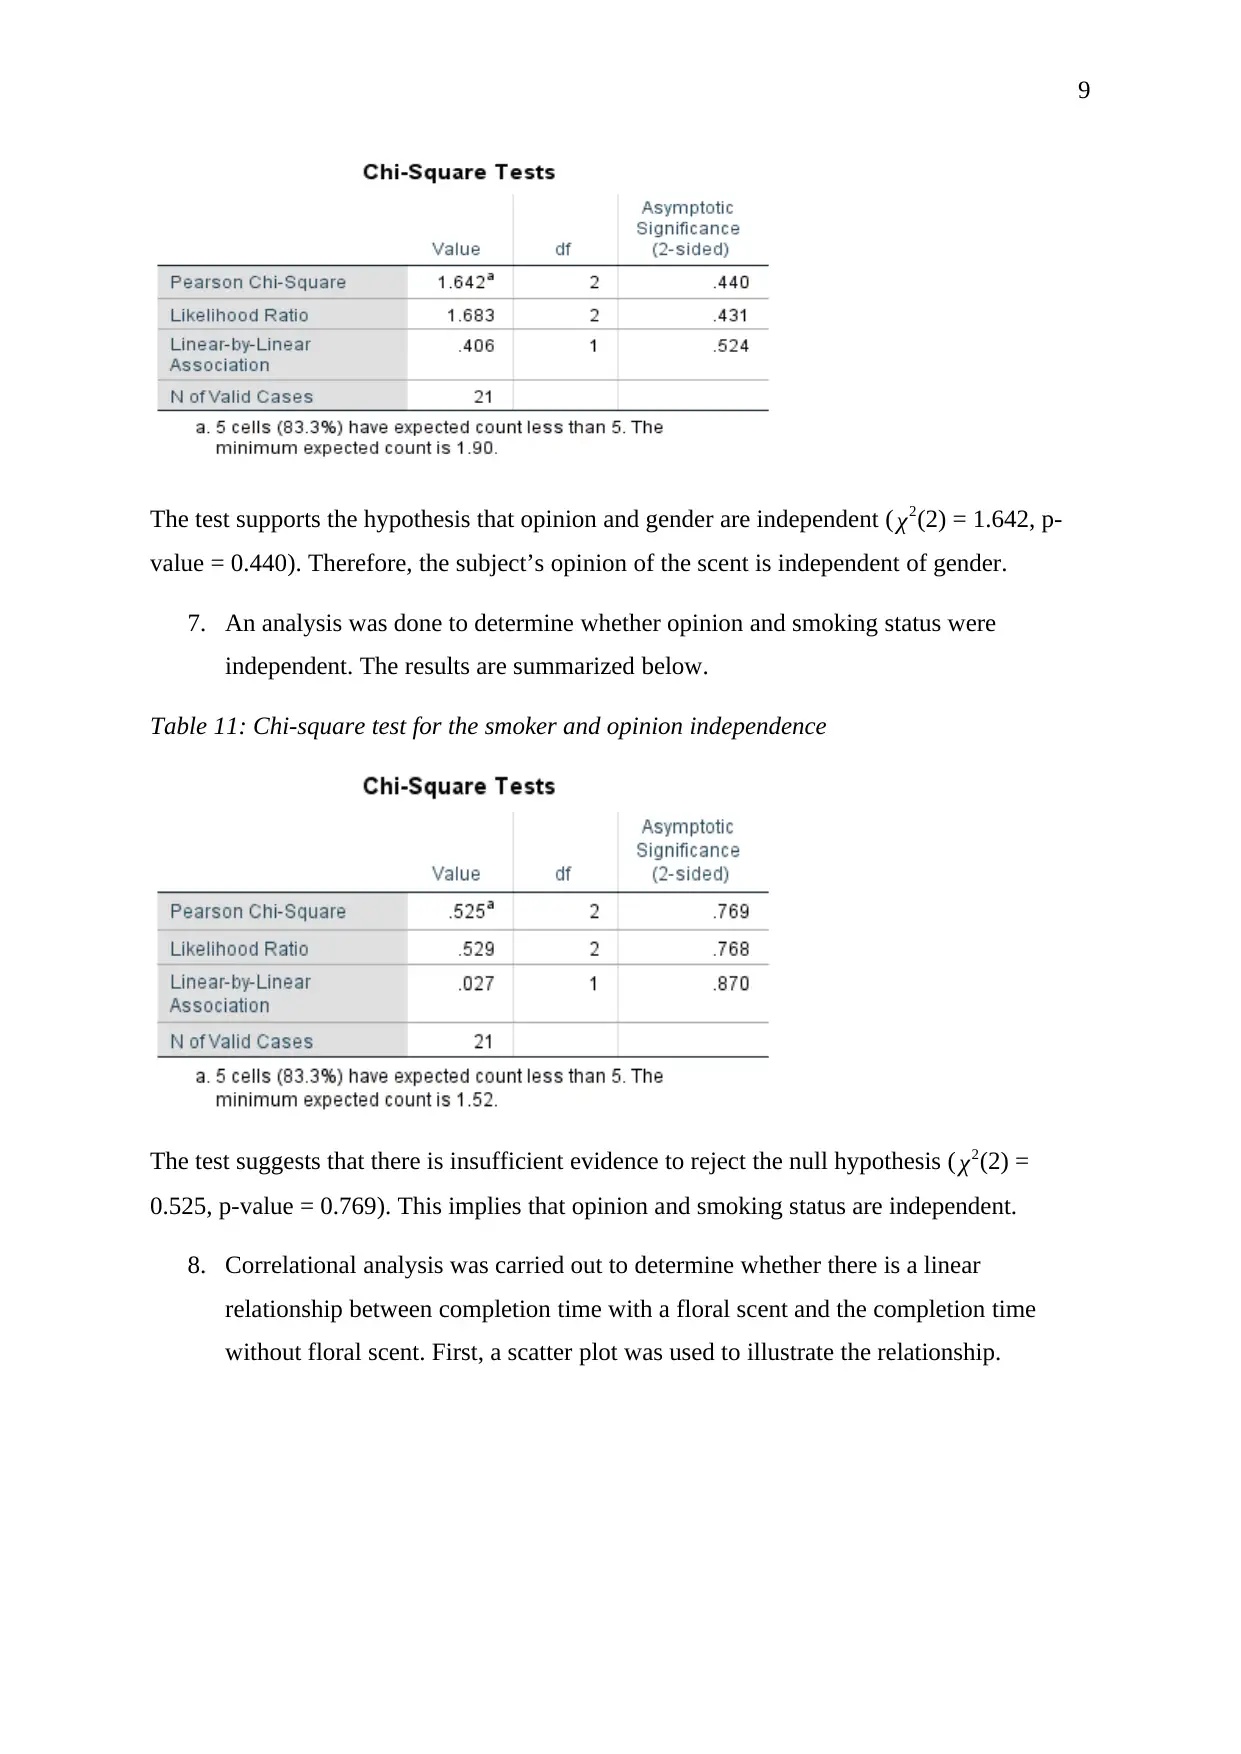
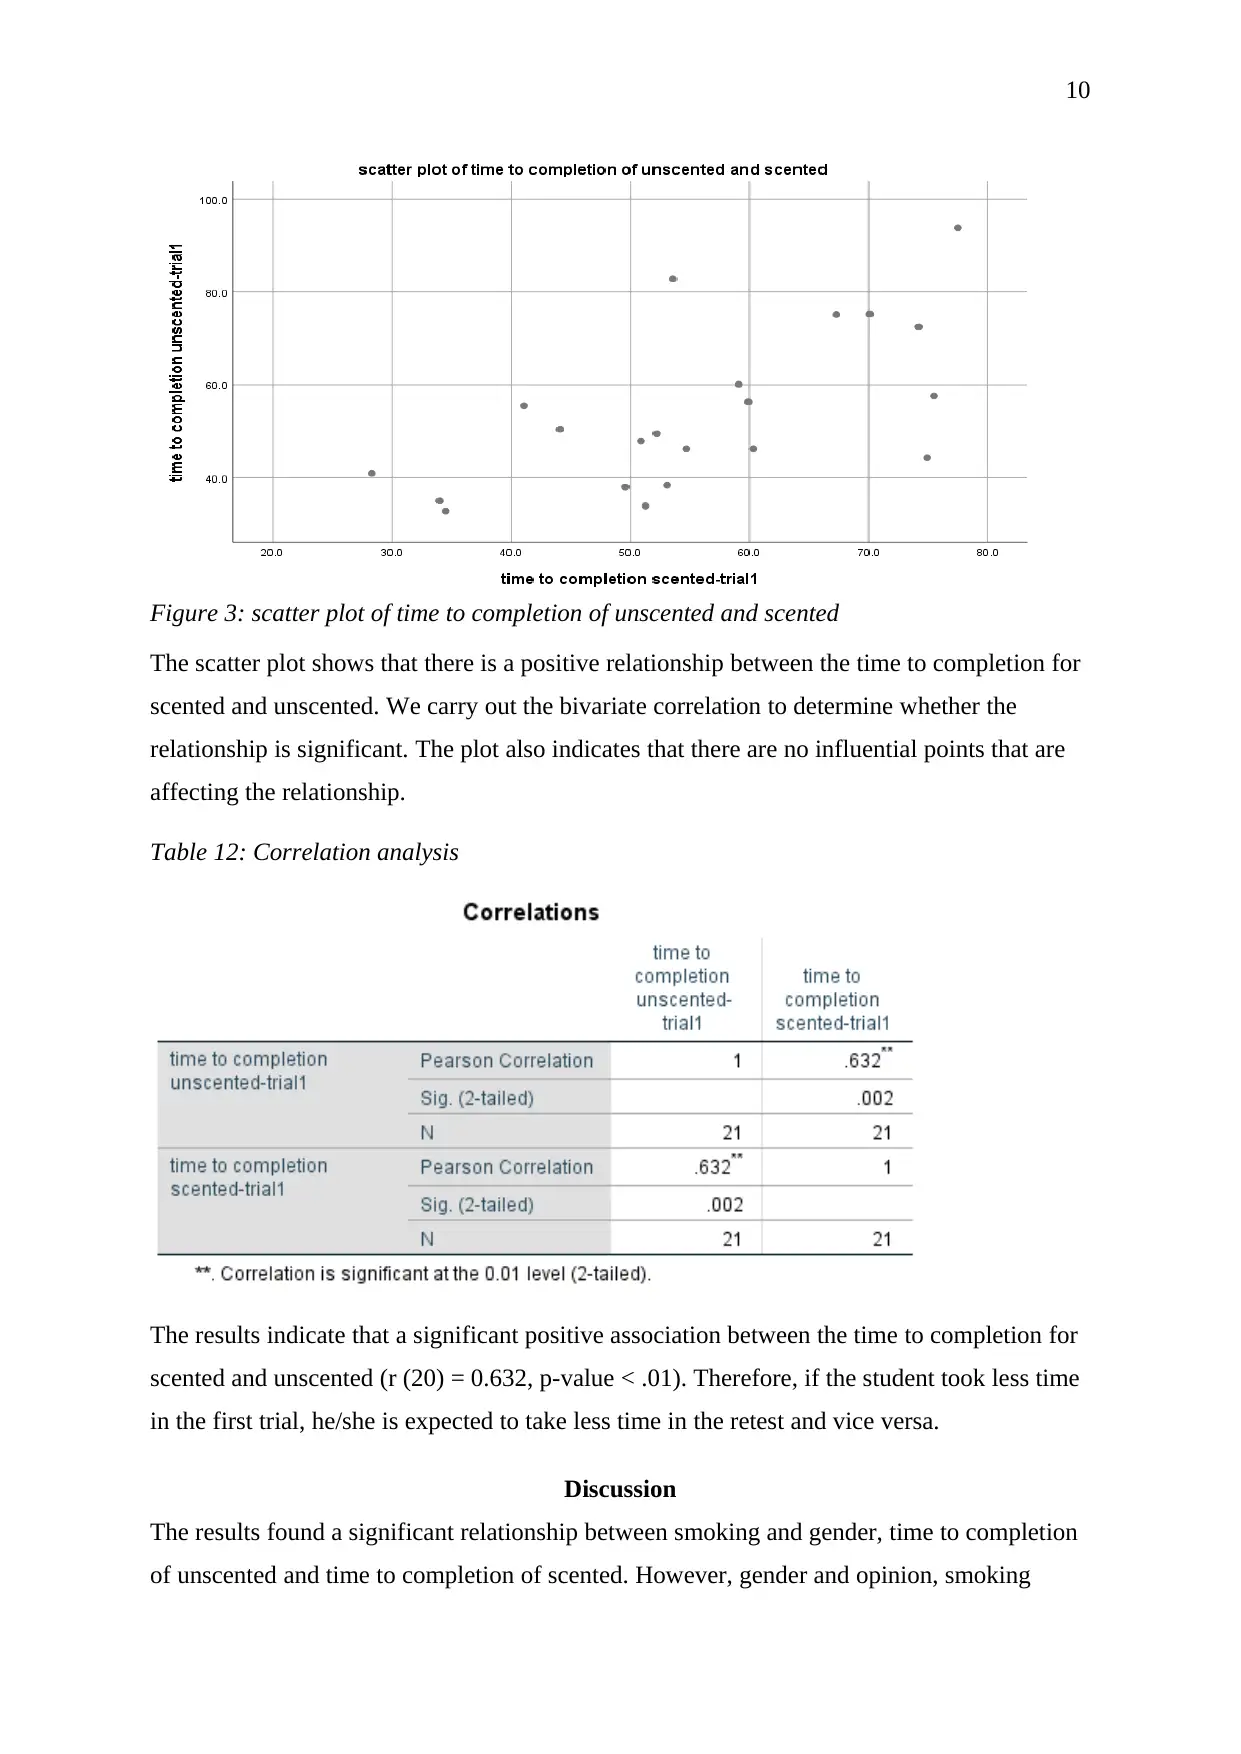
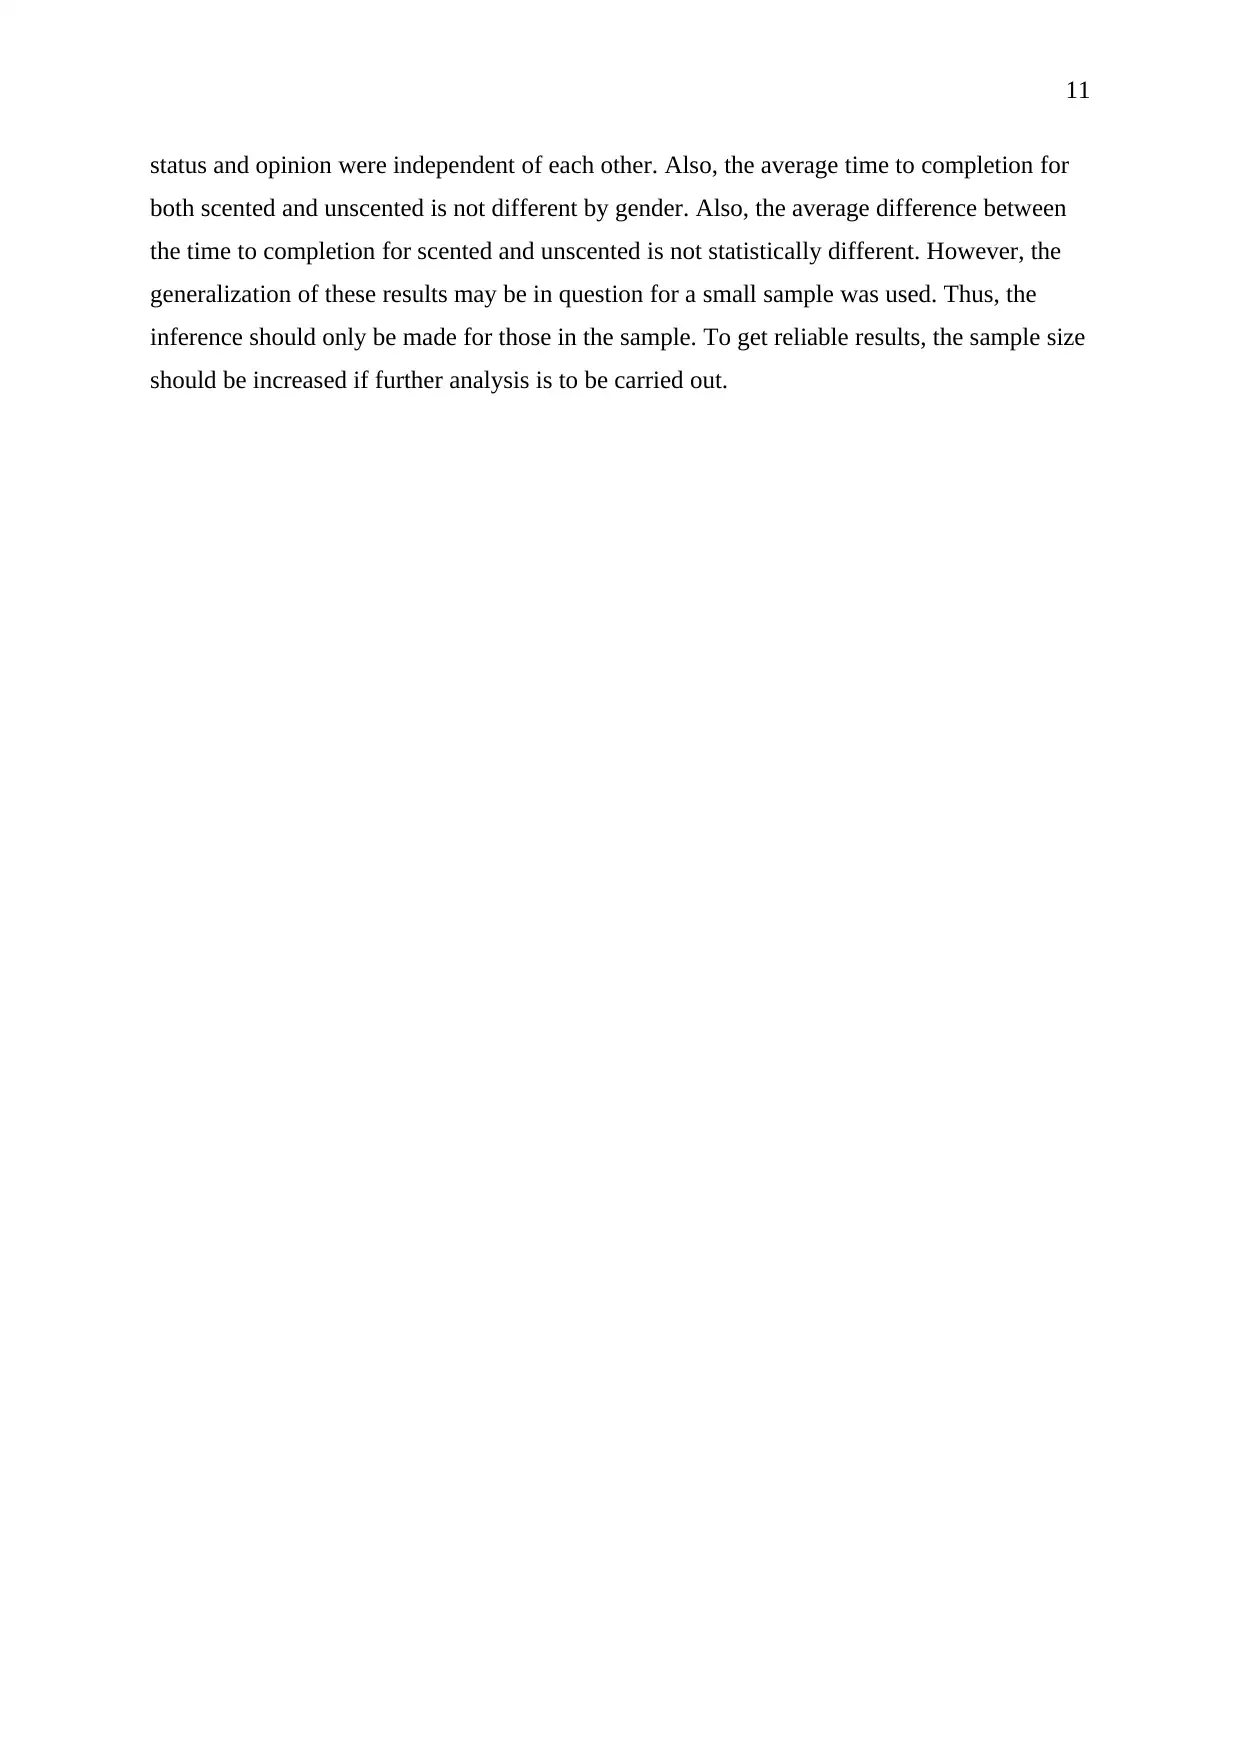
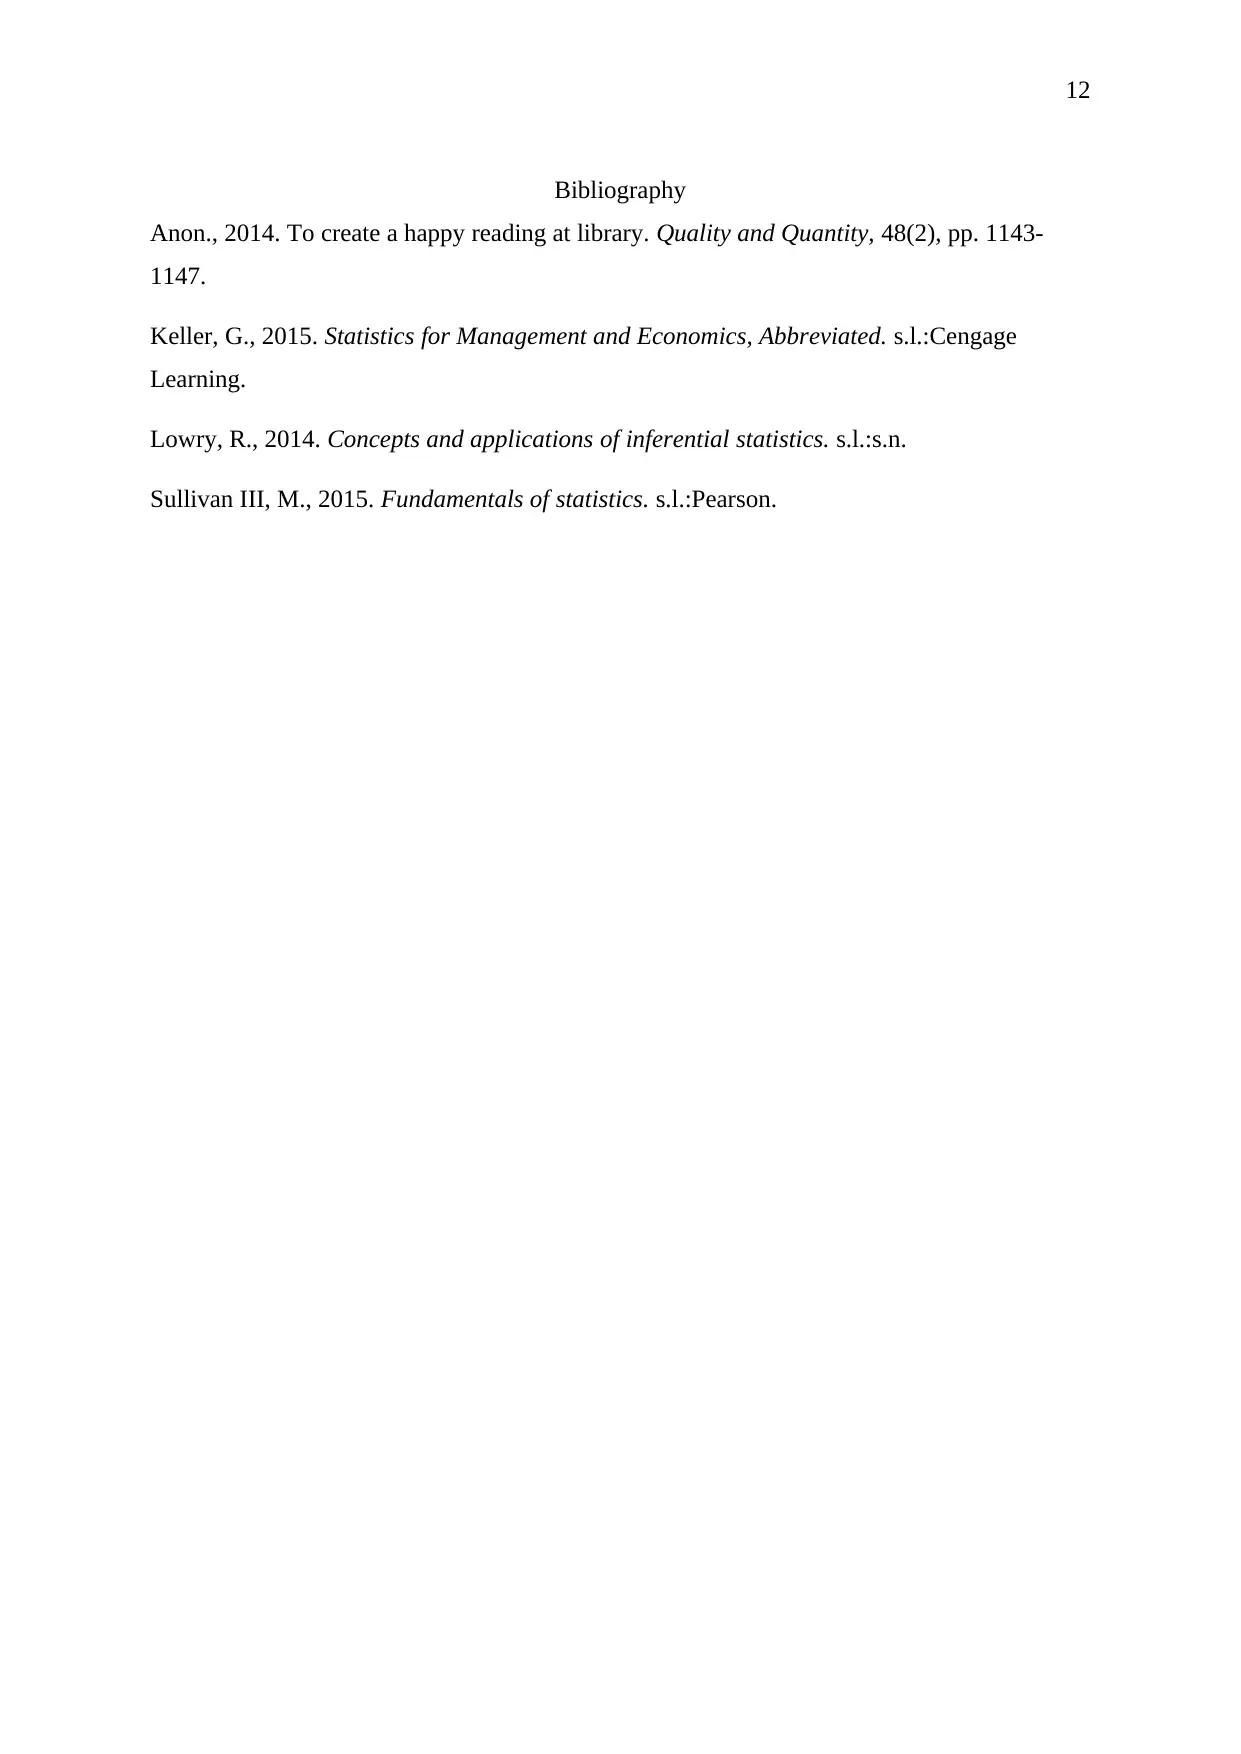
This data analysis project investigates the potential impact of pleasant aromas on student learning, based on a study where participants completed a maze task while wearing either a floral-scented or an unscented mask. The study collected data on participant demographics (gender, smoking status, opinion on scent), and their completion times for the maze under both conditions. The analysis employed various statistical methods, including chi-square tests to assess the independence of categorical variables (gender and smoking status, gender and opinion, opinion and smoking status), t-tests to compare mean completion times between groups (males vs. females, scented vs. unscented), and correlation analysis to examine the relationship between completion times in the scented and unscented trials. The results revealed a significant association between smoking habits and gender, and between completion times with and without scent. The study found no significant difference in average completion times based on gender, or between scented and unscented trials. The study concludes that while the study reveals some interesting relationships, the small sample size limits the generalizability of the findings.
Document Page
1
Do Pleasant Aromas Help Students Learn Better?
Name:
The Name of the Class (Course):
Professor (Tutor):
The Name of the School (University):
The City and State where it is located:
Date:
tabler-icon-diamond-filled.svg

Paraphrase This Document

Need a fresh take? Get an instant paraphrase of this document with our AI Paraphraser
Document Page
2
Abstract
This study used an exploratory approach to assess whether there is an association between
pleasant aroma and peoples’ test time to completion. On average, it was established that the
average time to completion with and without scent is not different. Also, the average time to
completion with and without scent is equal among the male and female. However, it was
established that there was a significant linear relationship between the completion with and
without scent.
Introduction
This research was designed in understanding whether pleasant aromas help students learn
better. Anon., (2014, p. 1144) pointed out that when a student is learning in an environment
with sweet tea aroma or book aroma it increases their mood. Therefore, in this case, we will
use a sample of 21 people worked through a pencil and paper maze six times.
The replication was done three times while the participants were wearing
scented masks and three times wearing an unscented mask and the time
they took to complete the task recorded. Among other variables that were
recorded include; their age, gender, opinion on sensitivity to odour,
smoking status, and the order they did their test. Some of the tests run
include: this study will test whether there is an association between
gender and smoking status, gender and opinion, opinion and smoking
status; mean differences between male and female completion time; the
correlation between completion time for scented and unscented among
other tests.
Data Analysis
Generally, the questions asked fell into these three categories: i) cross-tabulation for testing
the independence of the nominal variables; ii) test for difference in averages for two groups;
iii) and test for association between continuous variables. For the cross-tabulation
(assessment for the independence of gender and opinion/smoking or smoking and opinion)
chi-square test for independence would be carried out. The primary assumptions are that the
data are counts and the variables are in categories which are met. The two types of t-test
(paired t-test and independent t-test) would be carried out. First, paired t-test was used to find
Document Page
3
out whether the average time to completion with and without the floral scent is equal. On the
other hand, the independent t-test assessed whether male and female means for the time to
completion with and without the floral scent are equal. The primary assumptions are that the
data are normally distributed (which was tested, see Table 1) and there are no outliers (which
is met). Lastly, correlation analysis was carried out to determine whether there is a linear
association between time to completion with and without the floral scent. The assumption is
that the data are normally distributed and there is no influential point (see Figure 3).
Results
An analysis was carried out to test for normality of the three continuous variables (age, time
to completion for scented and unscented) and the results are as follows.
Table 1: Test for normality
The Shapiro-Wilk test shows that all three variables come from a normally distributed
population (p-value > .05).
1. The descriptive summary of each variable is as illustrated below.
The frequency distribution of gender is summarized in Table 2.
Table 2: Gender distribution
Gender
Frequency Percent
Valid
Percent
Cumulative
Percent
Valid Female 10 47.6 47.6 47.6
male 11 52.4 52.4 100.0
Document Page
4
Total 21 100.0 100.0
The summary indicates that 47.6% of the participants were females and 52.4% were
males. This proportion is almost equal considering the sample is small.
The smoking habit frequency distribution among the participants is summarized
below.
Table 3: Smoking habit frequency
Smoker
Frequency Percent
Valid
Percent
Cumulative
Percent
Valid No 13 61.9 61.9 61.9
Yes 8 38.1 38.1 100.0
Total 21 100.0 100.0
The summary indicates that 61.9% of the participants were not smokers, whereas 38.1% were
smokers. This means that most of those that participated in the experiment were not smokers.
The proportion distribution of opinion is as illustrated below.
Table 4: Opinion distribution
Opinion
Frequency Percent
Valid
Percent
Cumulative
Percent
Valid Indifferent to
odour
4 19.1 19.0 19.0
Inherently
negative
7 33.3 33.3 52.4
Inherently
positive
10 47.6 47.6 100.0
Total 21 100.0 100.0
Table 4 shows that 19.0% of the participants were indifferent to odours, 33.3% were
inherently negative and 47.6% were inherently positive.
tabler-icon-diamond-filled.svg

Paraphrase This Document

Need a fresh take? Get an instant paraphrase of this document with our AI Paraphraser
Document Page
5
We carry out a collective descriptive analysis of the continuous variables and the results are
summarized below.
Table 5: Descriptive statistics summary
Statistics
Age
time to
completion
unscented-
trial1
time to
completion
scented-trial1
N Valid 21 21 21
Missing 0 0 0
Mean 36.57 53.924 55.533
Median 35.00 49.500 53.600
Std. Deviation 13.250 17.1458 14.3051
Variance 175.557 293.979 204.635
Skewness .761 .844 -.135
Std. Error of
Skewness
.501 .501 .501
Minimum 15 32.8 28.3
Maximum 65 93.8 77.5
On average, the participants were 36.57 years (SD = 13.250) (Keller, 2015, p. 96). The
minimum age was 15 years and the maximum age was 65 years, which implies that the range
was 50 years. On average the participants took 53.924 minutes (SD = 17.146 minutes). The
time to completion in the unscented trial ranged between 32.8 minutes to 93.8 minutes. On
the other hand, on average time to completion scented trial was 55.53 minutes (SD = 14.305
minutes). The time to completion, in this case, ranged between 28.3 minutes and 77.5
minutes.
2. An assessment was carried out to determine whether gender and smoking were
independent. This distribution is illustrated in the chart below.
Document Page
6
Figure 1: Smoking habit distribution by gender
The smoking habit distribution by gender chart indicates that there might be an association
between smoking and gender (Lowry, 2014). Hence, chi-square test for independence was
carried out and the results are as follows.
Table 6: Chi-square test for independence of smoking and gender
Chi-Square Tests
Value df
Asymptotic
Significance
(2-sided)
Exact Sig. (2-
sided)
Exact Sig. (1-
sided)
Pearson Chi-Square 3.884a 1 .049
Continuity Correctionb 2.313 1 .128
Likelihood Ratio 4.019 1 .045
Fisher's Exact Test .080 .063
Linear-by-Linear
Association
3.699 1 .054
N of Valid Cases 21
a. 2 cells (50.0%) have expected count less than 5. The minimum expected count is 3.81.
b. Computed only for a 2x2 table
The results show that there is enough evidence to warrant the rejection of the hypothesis that
gender and smoking are independent ( χ2(1) = 3.884, p-value = 0.049). Thus, one can
conclude that smoking and gender are related.
3. An assessment was carried out to determine whether there is a mean difference in
time to completion with and without the floral scent. The results are as tabulated
below.
Document Page
7
Table 7: paired t-test for the average time to completion with and without the floral scent
Paired Samples Test
Paired Differences t df Sig. (2-tailed)
Mean
Std.
Deviation
Std.
Error
Mean
95% Confidence Interval
of the Difference
Lower Upper
Pair 1 time to
completion
unscented-
trial1 - time
to completion
scented-trial1
-1.6095 13.7384 2.9980 -7.8632 4.6441 -.537 20 .597
The average difference is not statistically significant (t (20) = -.537, p-value > .05) (Keller,
2015, p. 473). Thus, there is evidence that the time to completion with and without the floral
scent is equal.
4. An independent t - test was carried out to assess whether the males and females have
the same completion time with the floral scent. The test results are as tabulated below.
Table 8: Independent t-test for gender completion with the floral scent
The Levene’s test results indicate that equality assumption holds (F (1, 19) = 0.092, p-
value = 0.765). The t-test for equality shows that there is inadequate evidence against
the null hypothesis that the male and female averages are equal (t (19) = 0.065, p-
value > .05) (Keller, 2015, p. 465). Therefore, we can infer that on average males and
females have the same completion time when subjected to floral scents.
5. An independent t - test was carried out to assess whether the males and females have
the same complete time when without floral scents. The results are as follows
tabler-icon-diamond-filled.svg

Paraphrase This Document

Need a fresh take? Get an instant paraphrase of this document with our AI Paraphraser
Document Page
8
Table 9: Independent t-test for gender completion without the floral scent
The equality of variance assumption holds (F (1, 19) = 0.092, p-value = 0.765) (Sullivan III,
2015). The average difference is not significant (t (19) = -0.100, p-value > .05). It can be
concluded that males and females have the same completion time without the floral scent.
6. An assessment was carried out to determine whether the opinion and gender are
independent. Cross-tabulation analysis, results are summarized below.
Figure 2: Opinion distribution by gender
The plot indicates that there might be independence of opinion by gender.
Table 10: Chi-square test for gender and opinion independence
Document Page
9
The test supports the hypothesis that opinion and gender are independent ( χ2(2) = 1.642, p-
value = 0.440). Therefore, the subject’s opinion of the scent is independent of gender.
7. An analysis was done to determine whether opinion and smoking status were
independent. The results are summarized below.
Table 11: Chi-square test for the smoker and opinion independence
The test suggests that there is insufficient evidence to reject the null hypothesis ( χ2(2) =
0.525, p-value = 0.769). This implies that opinion and smoking status are independent.
8. Correlational analysis was carried out to determine whether there is a linear
relationship between completion time with a floral scent and the completion time
without floral scent. First, a scatter plot was used to illustrate the relationship.
Document Page
10
Figure 3: scatter plot of time to completion of unscented and scented
The scatter plot shows that there is a positive relationship between the time to completion for
scented and unscented. We carry out the bivariate correlation to determine whether the
relationship is significant. The plot also indicates that there are no influential points that are
affecting the relationship.
Table 12: Correlation analysis
The results indicate that a significant positive association between the time to completion for
scented and unscented (r (20) = 0.632, p-value < .01). Therefore, if the student took less time
in the first trial, he/she is expected to take less time in the retest and vice versa.
Discussion
The results found a significant relationship between smoking and gender, time to completion
of unscented and time to completion of scented. However, gender and opinion, smoking
tabler-icon-diamond-filled.svg

Paraphrase This Document

Need a fresh take? Get an instant paraphrase of this document with our AI Paraphraser
Document Page
11
status and opinion were independent of each other. Also, the average time to completion for
both scented and unscented is not different by gender. Also, the average difference between
the time to completion for scented and unscented is not statistically different. However, the
generalization of these results may be in question for a small sample was used. Thus, the
inference should only be made for those in the sample. To get reliable results, the sample size
should be increased if further analysis is to be carried out.
Document Page
12
Bibliography
Anon., 2014. To create a happy reading at library. Quality and Quantity, 48(2), pp. 1143-
1147.
Keller, G., 2015. Statistics for Management and Economics, Abbreviated. s.l.:Cengage
Learning.
Lowry, R., 2014. Concepts and applications of inferential statistics. s.l.:s.n.
Sullivan III, M., 2015. Fundamentals of statistics. s.l.:Pearson.
chevron_up_icon
1 out of 12
circle_padding
hide_on_mobile
zoom_out_icon
[object Object]