BIO202H5S: Effect of PO2 and pH on Hemoglobin Oxygen Affinity
VerifiedAdded on 2023/04/08
|12
|2351
|102
Report
AI Summary
This lab report investigates the effect of varying partial pressures of oxygen (PO2) and pH levels on the oxygen saturation of hemoglobin in sheep blood, demonstrating the Bohr effect. The experiment involved measuring the percentage of transmittance using a spectrophotometer at different PO2 levels and two pH values (6.8 and 7.4) to construct oxygen dissociation curves. The results indicated that hemoglobin's oxygen affinity is higher at pH 7.4 compared to pH 6.8, illustrating how changes in pH can shift the oxygen dissociation curve. The report also discusses the physiological implications of these findings, particularly in the context of oxygen delivery to tissues during metabolism and at high altitudes. The study is relevant to understanding the complexities of oxygen transport in animals and the adaptive mechanisms that ensure adequate oxygen supply under varying environmental conditions. Desklib provides a platform to access this and many other solved assignments.
Lab report
Effect of changing PO2 on % oxygen saturation of Hemoglobin and
effect of the varying pH on Hemoglobin- oxygen affinity of
deoxygenating sheep blood
Abstract
The level of oxygen in arteries can be determined by taking a sample of blood gas and measuring
its partial pressure, PaO2 and percentage saturation Sao2 or indirectly by pulse oximetry.
The oxygen dissociation curve is a graph that plots the proportion of hemoglobin in its oxygen-
laden saturated form on the vertical axis against the partial pressure of oxygen on the horizontal
axis
This report addresses the between oxygen partial pressure and saturation and mathematical
calculation of the same.
The partial pressure of oxygen, also termed as oxygen tension entails the total pressure which is
the same of the contributions of constituent gases in a mixture of gases. The partial is the
pressure each individual gas would exert if the individual gas alone occupied the volume.
Background
Hemoglobin (HB) is the primary mean for transporting oxygen in the blood. Oxygen can also be
transported through the blood's plasma because it can be dissolved. Hemoglobin a pigment found
in red blood cells that binds and carries oxygen. In minimal times oxygen bound by hemoglobin
is released into the blood stream and absorbed into the tissues. It is estimated that each
hemoglobin binds up to four oxygen molecules. These oxygen molecules bind to the iron part of
Paraphrase This Document
Need a fresh take? Get an instant paraphrase of this document with our AI Paraphraser
the Hemegroup. As the hemoglobin binds the first oxygen molecule, its affinity to bind the
remaining three oxygen molecules increases.
Oxygen saturation, therefore, is the amount of oxygen filled in hemoglobin at any given time.
And the percentage oxygen saturation is defined as the ratio of the amount of oxygen bound to
the hemoglobin, to the maximum capacity of hemoglobin to carry oxygen.
Some of the factors that determine hemoglobin’s capacity to carry oxygen include types of
hemoglobin in the bloodstream. And in large part the amount of oxygen that can be found, at any
time, bound to the hemoglobin is dependent on partial pressure of oxygen in the bloodstream to
which hemoglobin is in. For instance, at the lungs, the partial pressure of oxygen is usually high
due to high concentration of oxygen in the alveoli sacs and therefore oxygen is bound readily to
the hemoglobin, and as blood continues its circulation to the parts of the rest of the body, the
partial pressure of oxygen reduces and thus the hemoglobin releases oxygen into the body tissues
as it cannot keep binding oxygen when partial pressure of oxygen reduces. (Lynn M. Taussig,
2008)
Introduction
Every living animal needs oxygen to survive and fast enough circulation of oxygen to sustain
bodily actions. In order to achieve fast enough oxygen supply, animals have developed dedicated
organs (such as lungs) for oxygen diffusion as oxygen diffusion does not remain effective if the
living tissues become more than 1 mm thick. Although, developing of organ is not enough, as it
also need blood pigment to successfully transport oxygen to the cells. Haemoglobin (HB) present
in the vertebrate’s red blood cells are act as the transportation molecule. This Hemoglobin (HB)
transfer oxygen to the tissues and cells after absorbing oxygen from lungs while returning
carbon-di-oxide from tissues and cells to lungs. (Thomas Briggs, 2012) (Richard A. Harvey (Ph.
D.), Biochemistry, 2011) The iron ion present in Hemoglobin (HB) is responsible for the
releasing and binding of carbon-di-oxide and oxygen. The relationship between oxygen and
hemoglobin can be expressed through Oxygen Disassociation Curve where percentage of oxygen
bound to hemoglobin is illustrated at various partial pressure (PO2). P50 is used as a traditional
measurement standard for the healthy individuals and can be defined as partial oxygen saturation
at 50 per cent saturation. This oxygen affinity of the hemoglobin varies due to various reason and
decrease and increase of pH is one of them. Low oxygen partial pressure and increment of
carbon-di-oxide is responsible for decrement in oxygen affinity and vice versa. This
phenomenon is known as Bohr Effect. (John W. Pelley, 2010) Many studies have investigated
the Bohr Effect in animal and reported that an inversely related Bohr Effect is present between
pH and oxygen affinity.
Therefore, the purpose of this experiment is to study the effect of changing PO2 on % oxygen
saturation of Hemoglobin and observe the varying pH’s effect on Hemoglobin- oxygen affinity
of deoxygenating sheep (Ovis aries) blood. In order to achieve this % transmittance will be
recorded using spectrophotometer at different variation of PO2. (Robert W. Wilmott, 2012)
Methods
The experiment was performed by forming two groups. One of the group performed tests on
haemolysate buffered at pH 7.4 and the other group tested the haemolysate buffered at pH 6.8.
Data was collected for both pH values
⊘ This is a preview!⊘
Do you want full access?
Subscribe today to unlock all pages.
Trusted by 1+ million students worldwide
The spectrophotometer was plugged in so that it had time to start up as we prepared the other
materials needed for the experiment. We set the spectrophotometer to measure % Transmittance
(% T) and set the wavelength to 625 nm.
We labelled 9 clean test tubes for reference blank and each vacuum pressure level that would be
used for testing. We made sure that the labels are placed near the top of the test tubes. Then, we
used 2.5 ml of the appropriate buffer (pH 7.4 or 6.8 depending on the pH of the haemolysate that
each group was testing) to blank the spectrophotometer.
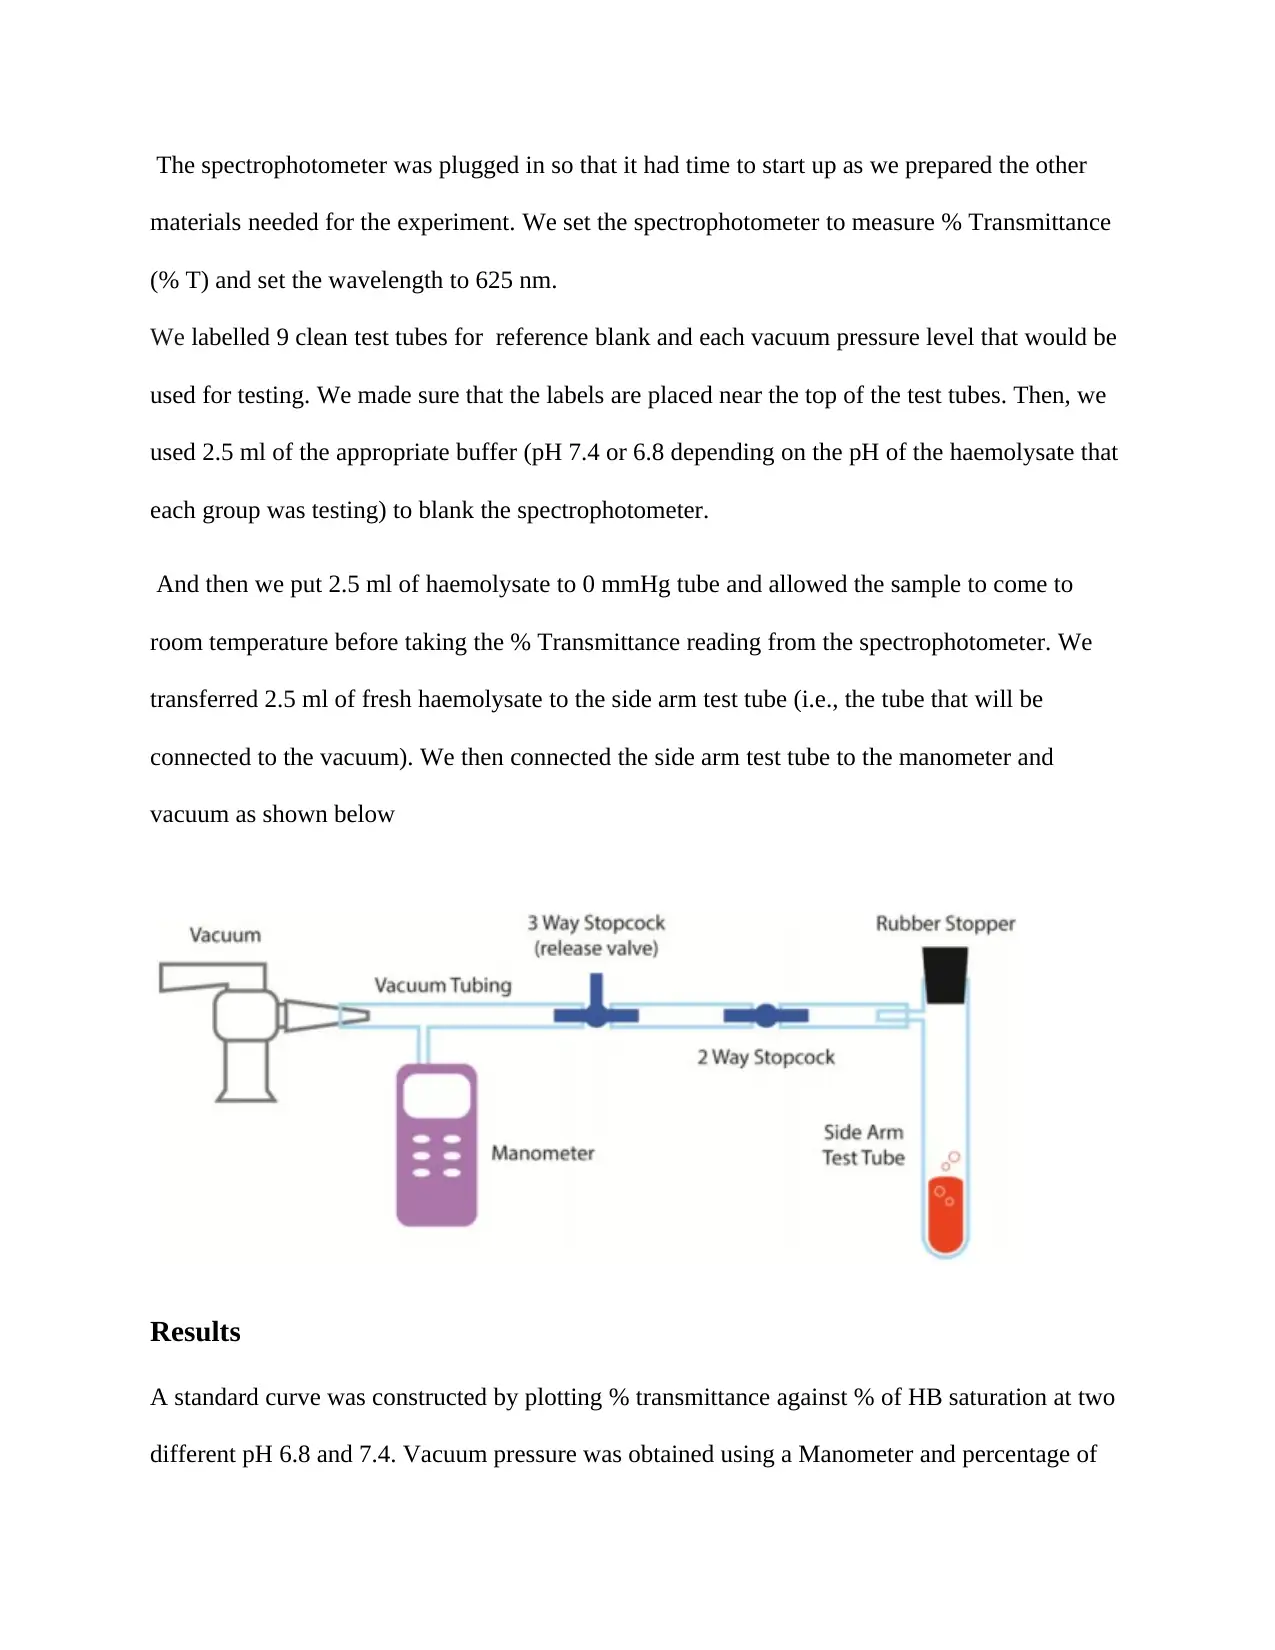
And then we put 2.5 ml of haemolysate to 0 mmHg tube and allowed the sample to come to
room temperature before taking the % Transmittance reading from the spectrophotometer. We
transferred 2.5 ml of fresh haemolysate to the side arm test tube (i.e., the tube that will be
connected to the vacuum). We then connected the side arm test tube to the manometer and
vacuum as shown below
Results
A standard curve was constructed by plotting % transmittance against % of HB saturation at two
different pH 6.8 and 7.4. Vacuum pressure was obtained using a Manometer and percentage of
materials needed for the experiment. We set the spectrophotometer to measure % Transmittance
(% T) and set the wavelength to 625 nm.
We labelled 9 clean test tubes for reference blank and each vacuum pressure level that would be
used for testing. We made sure that the labels are placed near the top of the test tubes. Then, we
used 2.5 ml of the appropriate buffer (pH 7.4 or 6.8 depending on the pH of the haemolysate that
each group was testing) to blank the spectrophotometer.
And then we put 2.5 ml of haemolysate to 0 mmHg tube and allowed the sample to come to
room temperature before taking the % Transmittance reading from the spectrophotometer. We
transferred 2.5 ml of fresh haemolysate to the side arm test tube (i.e., the tube that will be
connected to the vacuum). We then connected the side arm test tube to the manometer and
vacuum as shown below
Results
A standard curve was constructed by plotting % transmittance against % of HB saturation at two
different pH 6.8 and 7.4. Vacuum pressure was obtained using a Manometer and percentage of
Paraphrase This Document
Need a fresh take? Get an instant paraphrase of this document with our AI Paraphraser
transmittance was collected using spectrophotometer from deoxygenating sheep (Ovis aries)
blood. The constructed standard curve is presented below in the Figure 1.
From the graph in figure 1 shown in the appendix, two standard equations have been obtained for
each of the pH 6.8 and 7.4. These equations are mentioned below:
For pH 6.8, Y = 0.538X + 2.4
For pH 7.4, Y = 0.54X + 0.74 where X= % of HB saturation and Y= % transmittance.
The above equations were used to convert the % Transmittance to % of HB saturation.
Manometer readings were converted to Partial Pressure of Oxygen using the following equation:
Partial Pressure O2 (mmHg) = 0.21(D – W – M); where W = water vapour pressure in mmHg,
D= barometer pressure in mmHg and M = vacuum pressure in mmHg.
Discussion
When discussing the Bohr effect, we analyse the time taken by blood from arteries to traverse the
capillaries. It clearly shows that when oxygen is being released by the hemoglobin, PCO2 rises,
PH falls and the curve shifts to the right. Then the resultant p50 increase keeps the oxygen
diffusion pressure high enough to ensure oxygen availability. (Gabriel G. Haddad, 2002)
The figure below shows three oxyhemoglobin curves; one, normal curve of p50 of 26.7 mmHg,
left side curve containing p50 of 17 mmHg and right side curve containing p50 of 36 mmHg.
Some of the factors causing the shifting include PH, PCO2, temperature, organic phosphates and
HB structure.
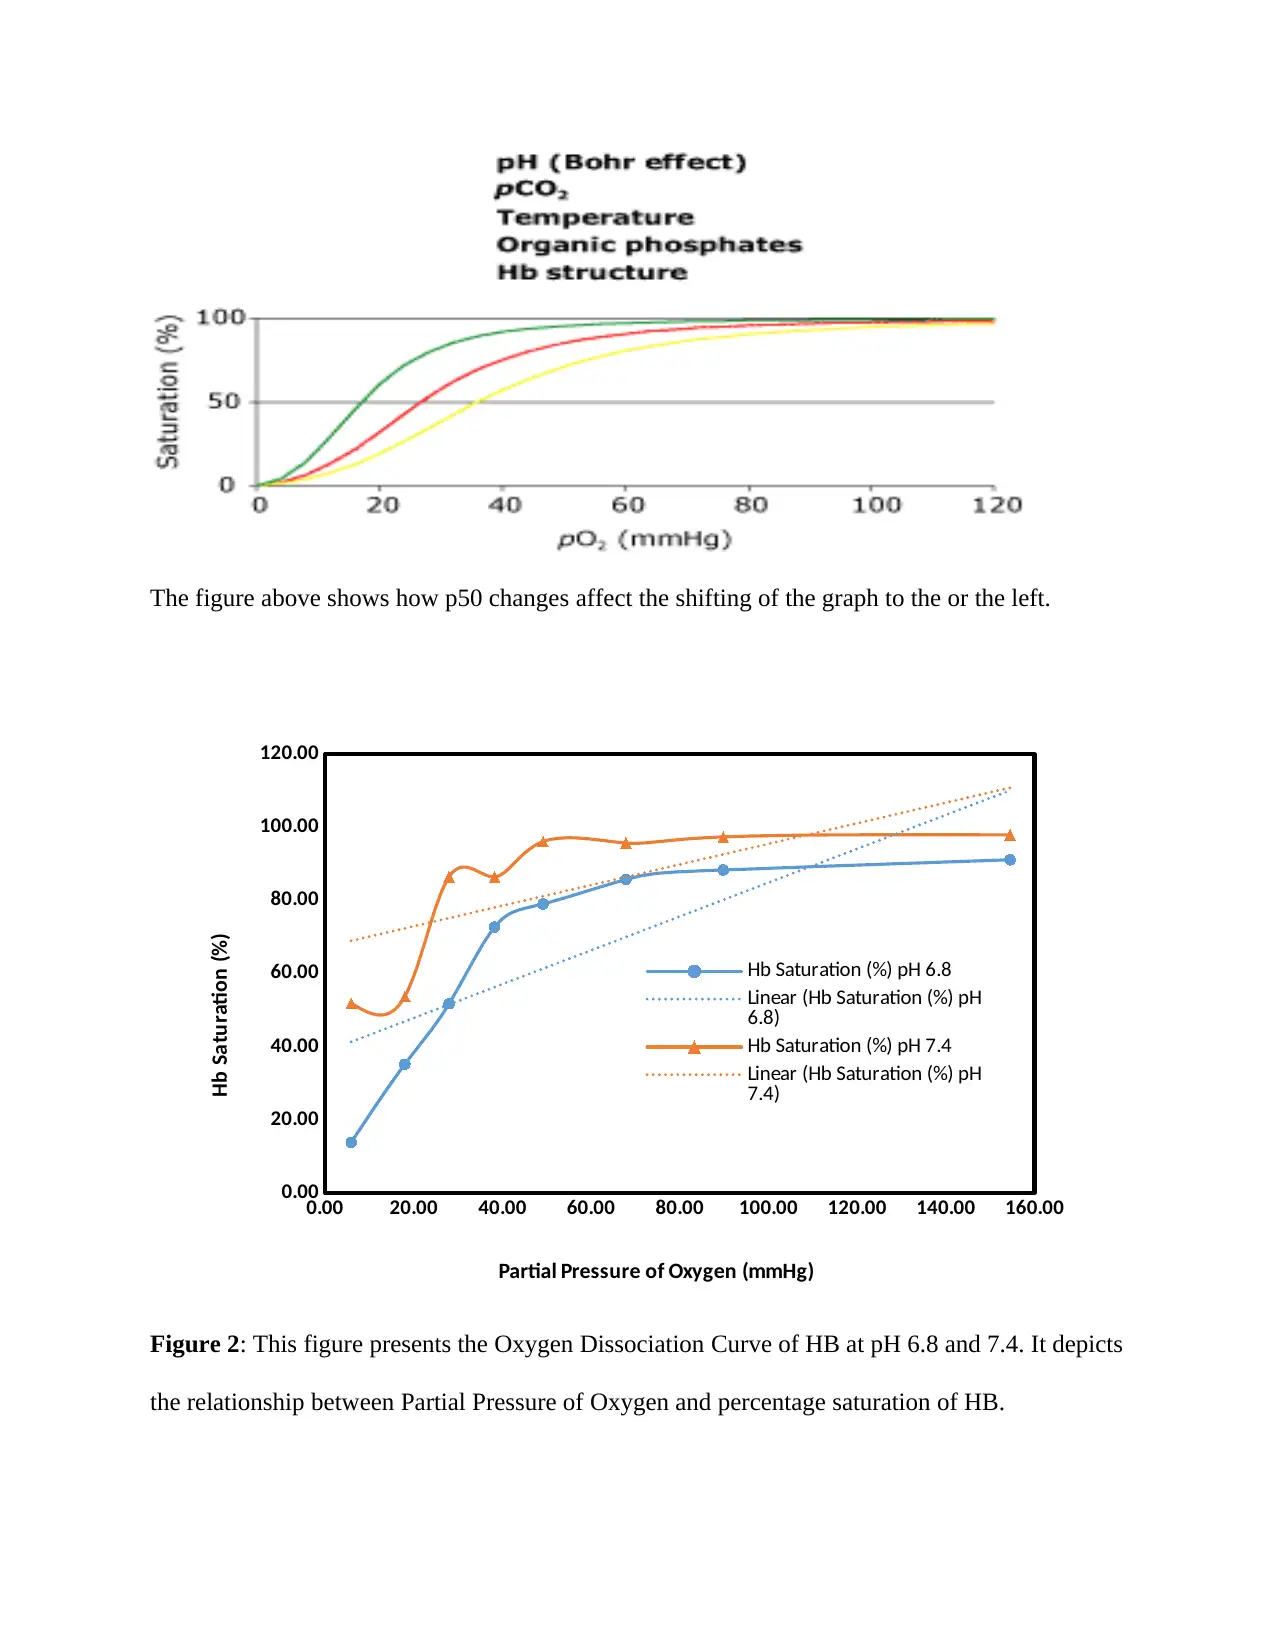
The figure above shows how p50 changes affect the shifting of the graph to the or the left.
0.00 20.00 40.00 60.00 80.00 100.00 120.00 140.00 160.00
0.00
20.00
40.00
60.00
80.00
100.00
120.00
Hb Saturation (%) pH 6.8
Linear (Hb Saturation (%) pH
6.8)
Hb Saturation (%) pH 7.4
Linear (Hb Saturation (%) pH
7.4)
Partial Pressure of Oxygen (mmHg)
Hb Saturation (%)
Figure 2: This figure presents the Oxygen Dissociation Curve of HB at pH 6.8 and 7.4. It depicts
the relationship between Partial Pressure of Oxygen and percentage saturation of HB.
⊘ This is a preview!⊘
Do you want full access?
Subscribe today to unlock all pages.
Trusted by 1+ million students worldwide
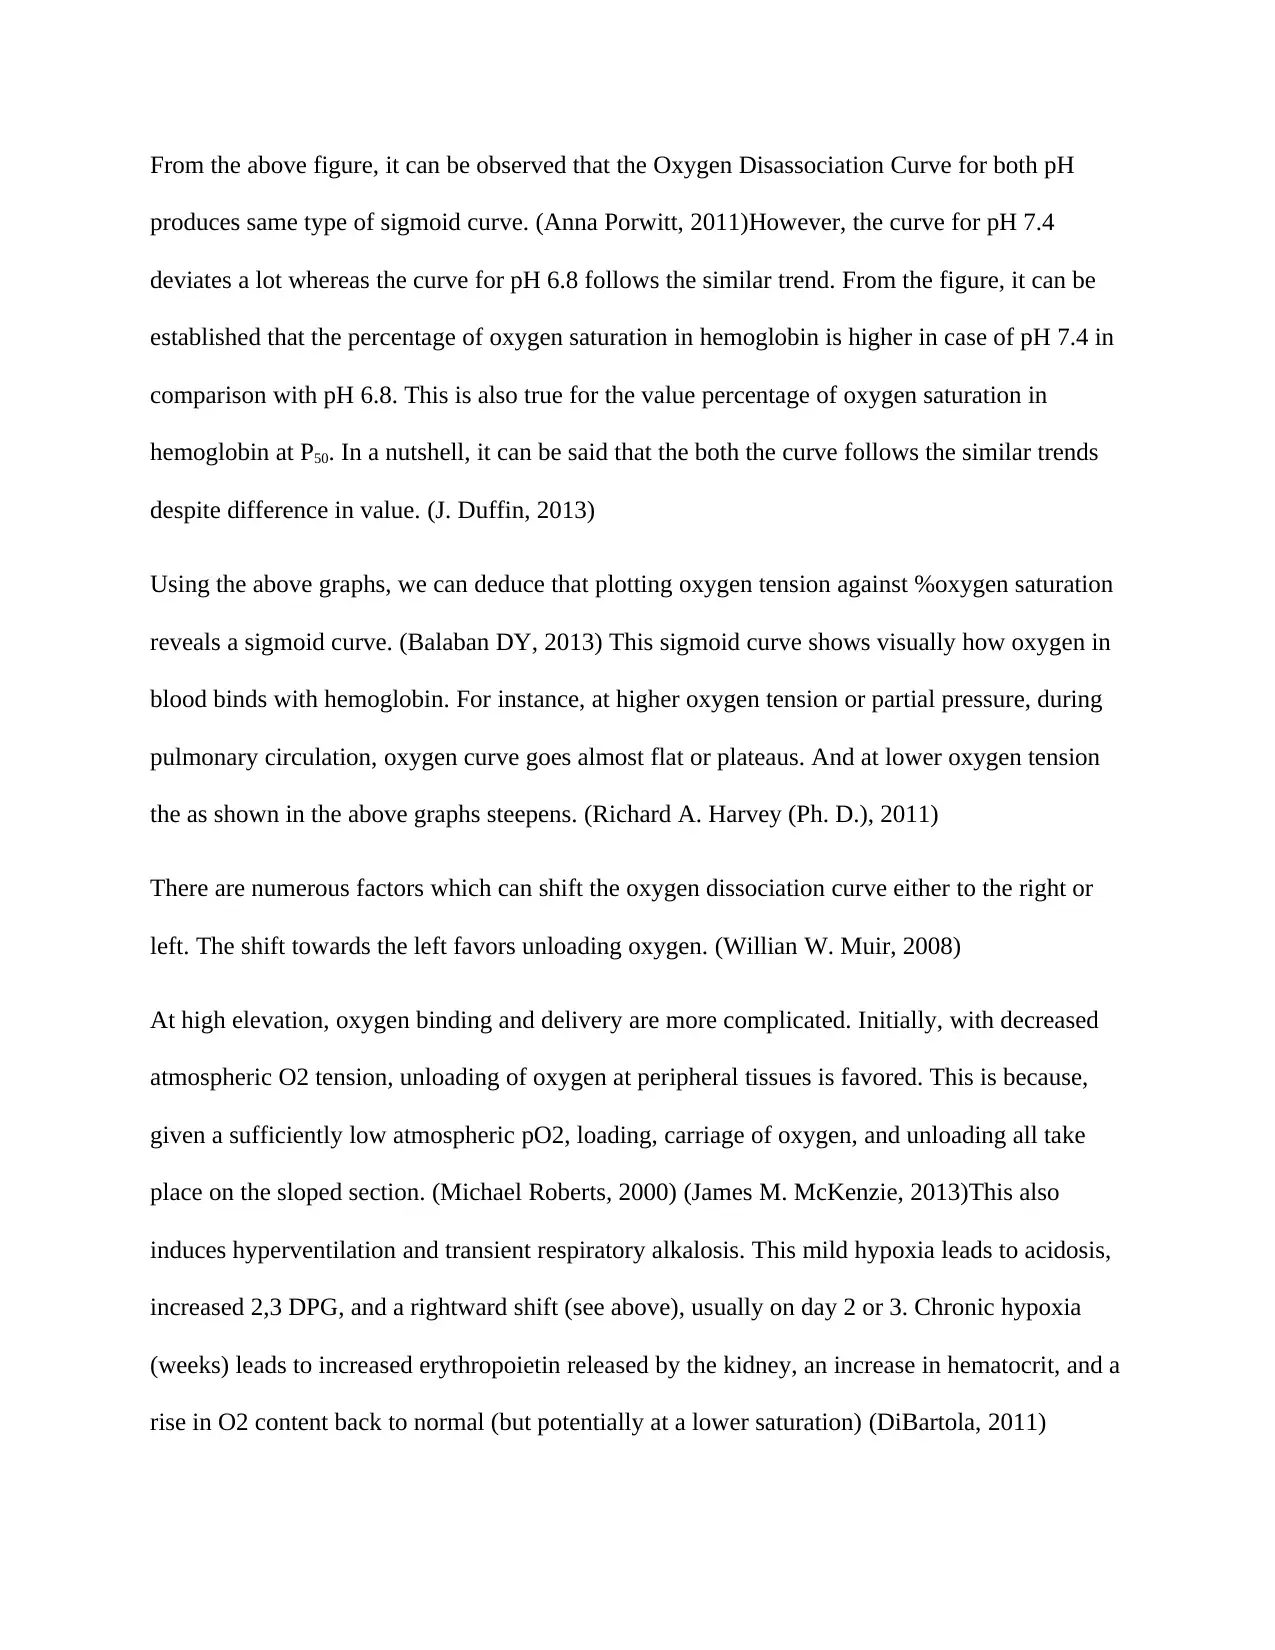
From the above figure, it can be observed that the Oxygen Disassociation Curve for both pH
produces same type of sigmoid curve. (Anna Porwitt, 2011)However, the curve for pH 7.4
deviates a lot whereas the curve for pH 6.8 follows the similar trend. From the figure, it can be
established that the percentage of oxygen saturation in hemoglobin is higher in case of pH 7.4 in
comparison with pH 6.8. This is also true for the value percentage of oxygen saturation in
hemoglobin at P50. In a nutshell, it can be said that the both the curve follows the similar trends
despite difference in value. (J. Duffin, 2013)
Using the above graphs, we can deduce that plotting oxygen tension against %oxygen saturation
reveals a sigmoid curve. (Balaban DY, 2013) This sigmoid curve shows visually how oxygen in
blood binds with hemoglobin. For instance, at higher oxygen tension or partial pressure, during
pulmonary circulation, oxygen curve goes almost flat or plateaus. And at lower oxygen tension
the as shown in the above graphs steepens. (Richard A. Harvey (Ph. D.), 2011)
There are numerous factors which can shift the oxygen dissociation curve either to the right or
left. The shift towards the left favors unloading oxygen. (Willian W. Muir, 2008)
At high elevation, oxygen binding and delivery are more complicated. Initially, with decreased
atmospheric O2 tension, unloading of oxygen at peripheral tissues is favored. This is because,
given a sufficiently low atmospheric pO2, loading, carriage of oxygen, and unloading all take
place on the sloped section. (Michael Roberts, 2000) (James M. McKenzie, 2013)This also
induces hyperventilation and transient respiratory alkalosis. This mild hypoxia leads to acidosis,
increased 2,3 DPG, and a rightward shift (see above), usually on day 2 or 3. Chronic hypoxia
(weeks) leads to increased erythropoietin released by the kidney, an increase in hematocrit, and a
rise in O2 content back to normal (but potentially at a lower saturation) (DiBartola, 2011)
Paraphrase This Document
Need a fresh take? Get an instant paraphrase of this document with our AI Paraphraser
Conclusion
In conclusion, it can be established that the factors that move the curves to the right, that is lower
PH, higher temperature and Pco2 are directly related to conditions that are tissues as they
undergo metabolism and as blood flows through capillaries the curves shift towards right
direction. (Richard A. Polin, 2011) This explains the reduced affinity of hemoglobin for oxygen
and this helps in getting oxygen being released from the hemoglobin. And when this happens,
the cycle continues where hemoglobin circulates back to oxygen rich blood where the curve
shifts left.
References
Anna Porwitt, J. M. (2011). Blood and Bone Marrow Pathology. London: Elsevier Health
Sciences.
Balaban DY, D. P. (2013, March 1). Thein-vivo oxyhaemoglobin dissociation curve at sea level
and high altitude. Respir Physiol Neurobiol, pp. 133: 45-52.
DiBartola, S. p. (2011). Fluid, Electrolyte, and Acid-Base Disorders in Small Animal Practice.
London: Elsevier Health Sciences.
Gabriel G. Haddad, S. H. (2002). Chernick-Mellins Basic Mechanisms of Pediatric Respiratory
Disease. Ontario: PMPH-USA.
George, R. B. (2005). Chest Medicine: Essentials of Pulmonary and Critical Care Medicine.
Philladelphia: Lippincott Williams & Wilkins.
J. Duffin, J. F. (2013, August 1). Unknown in VIVO factors influencing oxygen dissociation
curve. Respir Physiol Neurobiol, p. 207: 188.
James M. McKenzie, U. S. (2013). Changes in the Oxygen-hemoglobin Dissociation Curve and
Time of Useful Function at Hypobaric Pressures in Rats After Chronic Oral
Administration of Propranolo. New York: U.S. Department of Transportation, Federal
Aviation Administration, Office of Aviation Medicine, 1980.
John W. Pelley, P. E. (2010). Rapid Review Biochemistry: With STUDENT CONSULT Online
Access. Philadelphia: Elsevier Health Sciences.
Lynn M. Taussig, L. I. (2008). Pediatric Respiratory Medicine. Philadelphia: Elsevier Health
Sciences.
Michael Roberts, M. J. (2000). Advanced Biology. London: Nelson Thornes.
Richard A. Harvey (Ph. D.), R. A. (2011). Biochemistry. philadelphia: Lippincott Williams &
Wilkins.
Richard A. Polin, W. W. (2011). Fetal and Neonatal Physiology . Philadelphia: Elsevier Health
Sciences.
Robert W. Wilmott, T. F. (2012). Kendig and Chernick's Disorders of the Respiratory Tract in
Children . Philadelphia: Elsevier Health Sciences.
Thomas Briggs, A. M. (2012). Biochemistry. London: Springer Science & Business Media.
Willian W. Muir, J. A. (2008). Monitoring and Emergence Therapy. Chicago: Elsevier Health
Sciences.
⊘ This is a preview!⊘
Do you want full access?
Subscribe today to unlock all pages.
Trusted by 1+ million students worldwide
Appendix
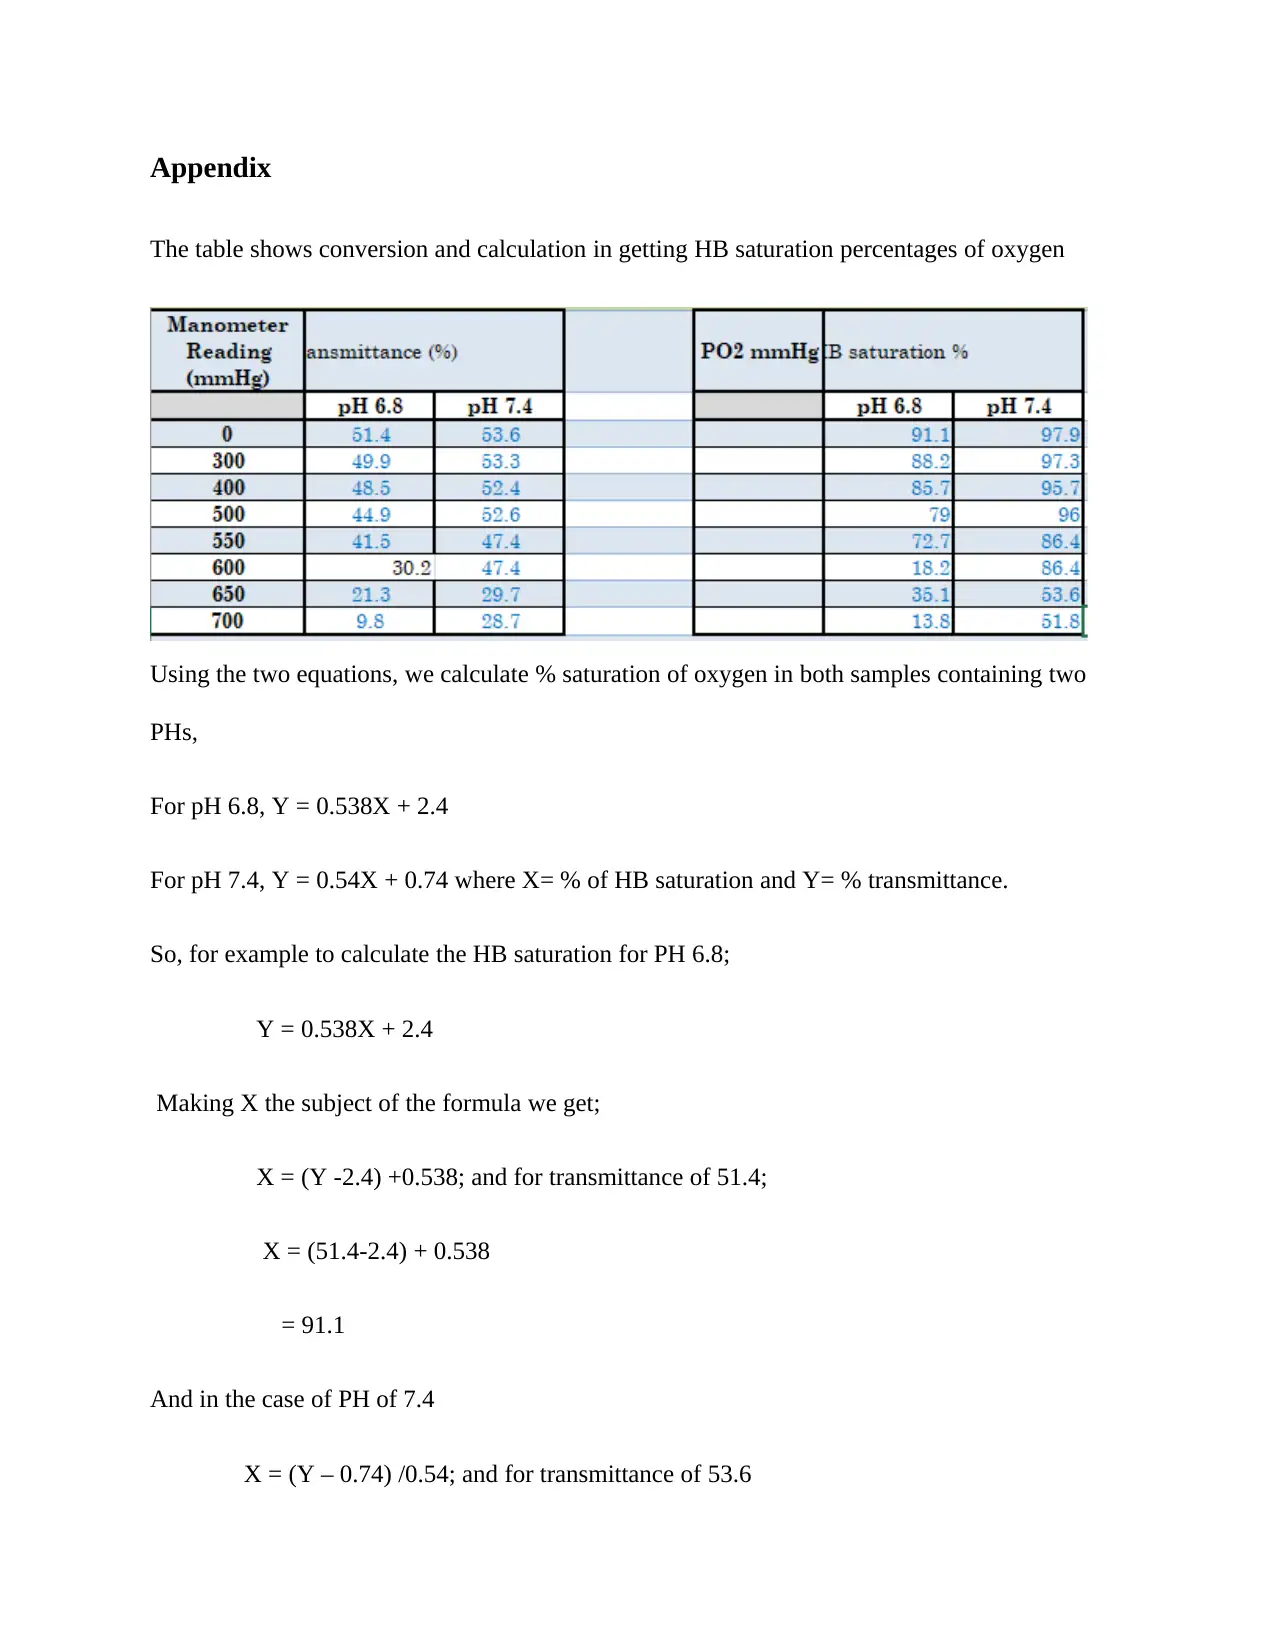
The table shows conversion and calculation in getting HB saturation percentages of oxygen
Using the two equations, we calculate % saturation of oxygen in both samples containing two
PHs,
For pH 6.8, Y = 0.538X + 2.4
For pH 7.4, Y = 0.54X + 0.74 where X= % of HB saturation and Y= % transmittance.
So, for example to calculate the HB saturation for PH 6.8;
Y = 0.538X + 2.4
Making X the subject of the formula we get;
X = (Y -2.4) +0.538; and for transmittance of 51.4;
X = (51.4-2.4) + 0.538
= 91.1
And in the case of PH of 7.4
X = (Y – 0.74) /0.54; and for transmittance of 53.6
Paraphrase This Document
Need a fresh take? Get an instant paraphrase of this document with our AI Paraphraser
= (53.6 -0.74) /0.54
= 97.9
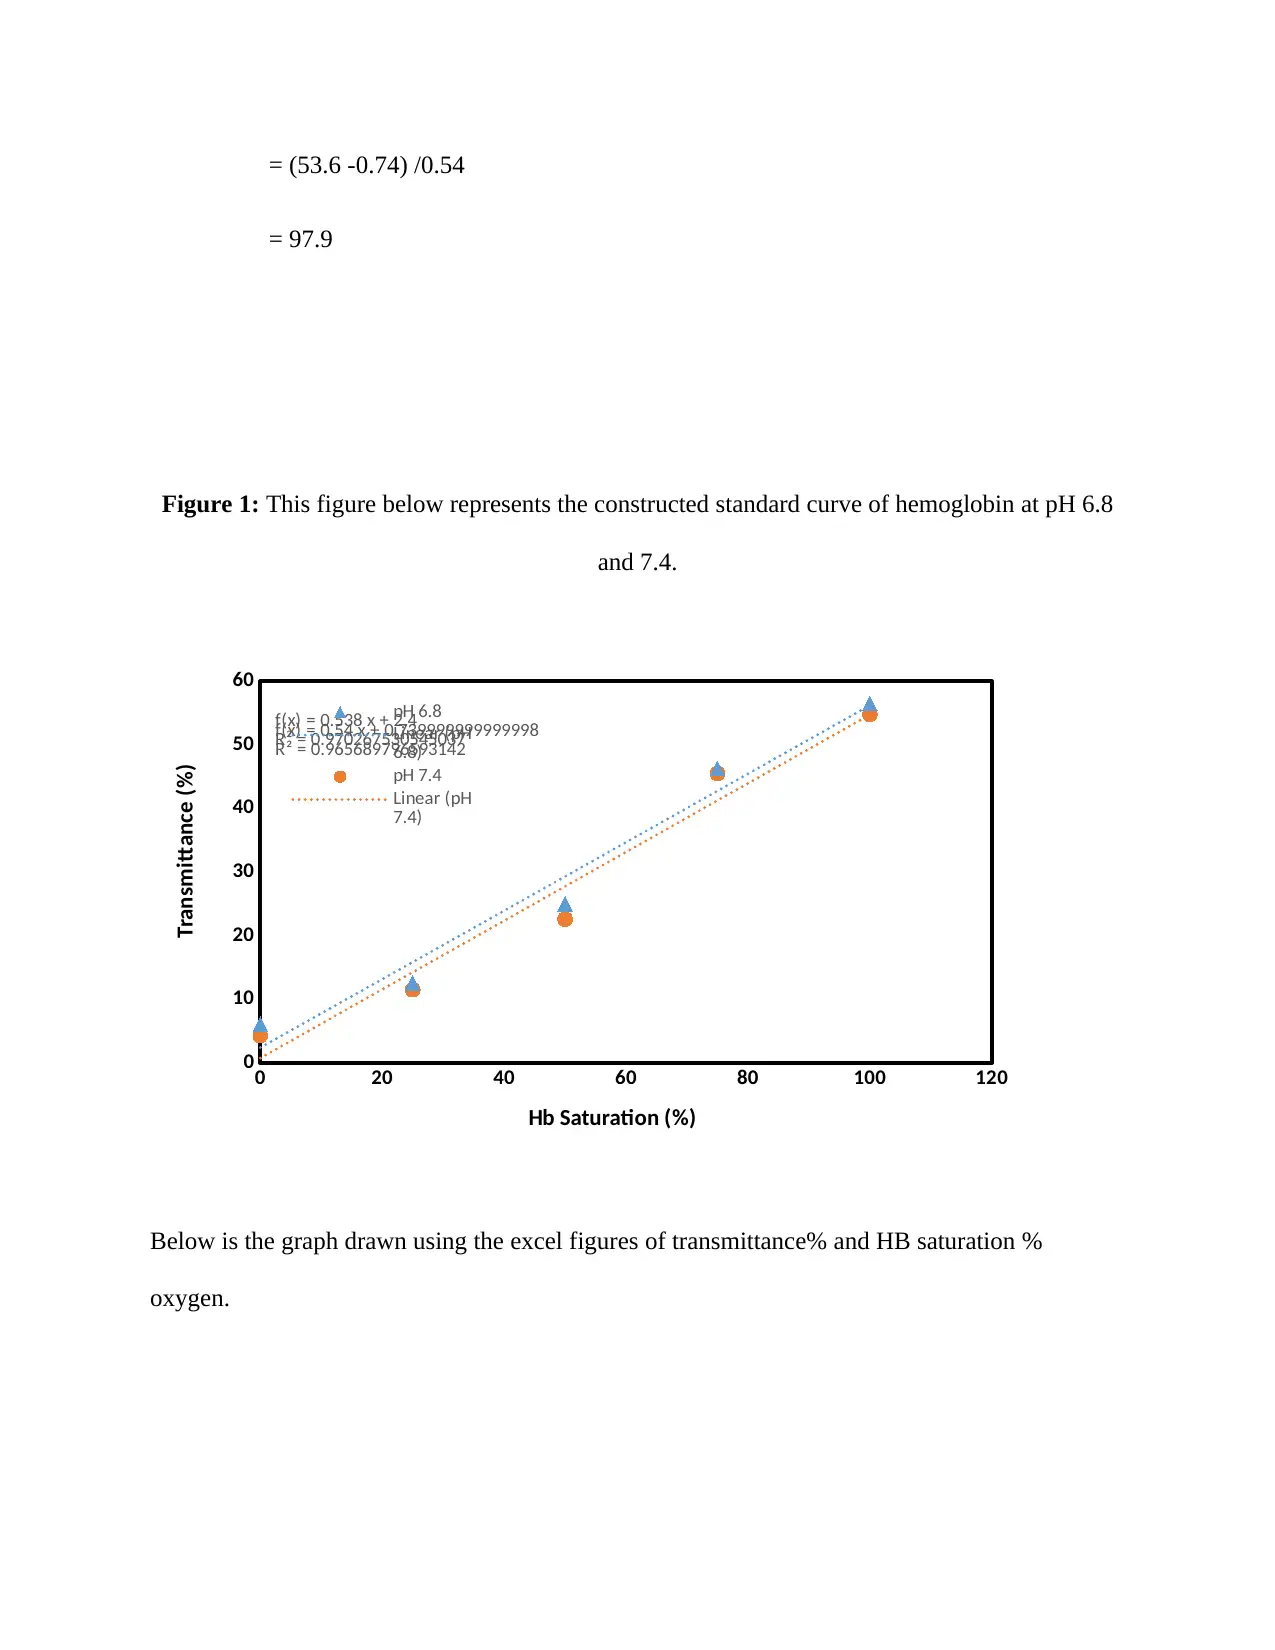
Figure 1: This figure below represents the constructed standard curve of hemoglobin at pH 6.8
and 7.4.
0 20 40 60 80 100 120
0
10
20
30
40
50
60
f(x) = 0.54 x + 0.739999999999998
R² = 0.965689796593142
f(x) = 0.538 x + 2.4
R² = 0.970267530545037
pH 6.8
Linear (pH
6.8)
pH 7.4
Linear (pH
7.4)
Hb Saturation (%)
Transmittance (%)
Below is the graph drawn using the excel figures of transmittance% and HB saturation %
oxygen.
= 97.9
Figure 1: This figure below represents the constructed standard curve of hemoglobin at pH 6.8
and 7.4.
0 20 40 60 80 100 120
0
10
20
30
40
50
60
f(x) = 0.54 x + 0.739999999999998
R² = 0.965689796593142
f(x) = 0.538 x + 2.4
R² = 0.970267530545037
pH 6.8
Linear (pH
6.8)
pH 7.4
Linear (pH
7.4)
Hb Saturation (%)
Transmittance (%)
Below is the graph drawn using the excel figures of transmittance% and HB saturation %
oxygen.
1 2 3 4 5 6 7 8
0
20
40
60
80
100
120
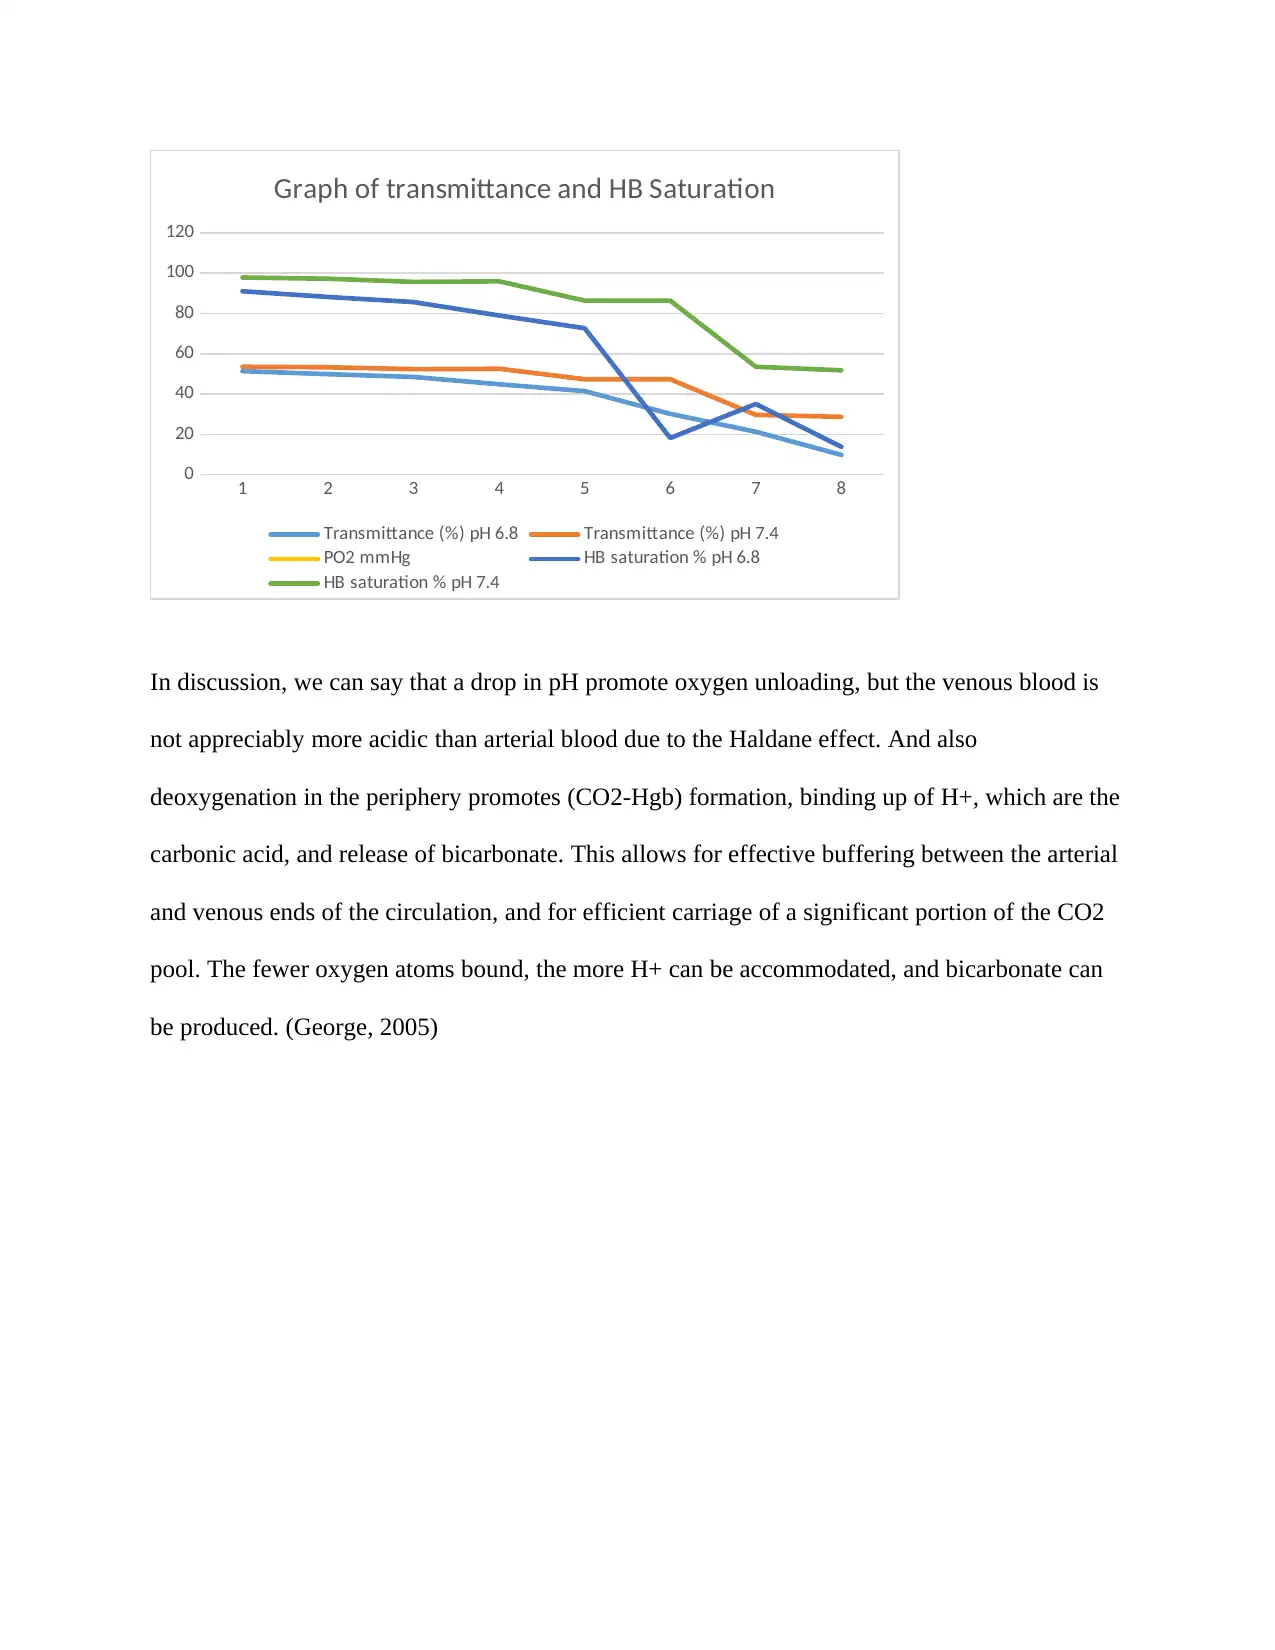
Graph of transmittance and HB Saturation
Transmittance (%) pH 6.8 Transmittance (%) pH 7.4
PO2 mmHg HB saturation % pH 6.8
HB saturation % pH 7.4
In discussion, we can say that a drop in pH promote oxygen unloading, but the venous blood is
not appreciably more acidic than arterial blood due to the Haldane effect. And also
deoxygenation in the periphery promotes (CO2-Hgb) formation, binding up of H+, which are the
carbonic acid, and release of bicarbonate. This allows for effective buffering between the arterial
and venous ends of the circulation, and for efficient carriage of a significant portion of the CO2
pool. The fewer oxygen atoms bound, the more H+ can be accommodated, and bicarbonate can
be produced. (George, 2005)
0
20
40
60
80
100
120
Graph of transmittance and HB Saturation
Transmittance (%) pH 6.8 Transmittance (%) pH 7.4
PO2 mmHg HB saturation % pH 6.8
HB saturation % pH 7.4
In discussion, we can say that a drop in pH promote oxygen unloading, but the venous blood is
not appreciably more acidic than arterial blood due to the Haldane effect. And also
deoxygenation in the periphery promotes (CO2-Hgb) formation, binding up of H+, which are the
carbonic acid, and release of bicarbonate. This allows for effective buffering between the arterial
and venous ends of the circulation, and for efficient carriage of a significant portion of the CO2
pool. The fewer oxygen atoms bound, the more H+ can be accommodated, and bicarbonate can
be produced. (George, 2005)
⊘ This is a preview!⊘
Do you want full access?
Subscribe today to unlock all pages.
Trusted by 1+ million students worldwide
1 out of 12
Related Documents


Your All-in-One AI-Powered Toolkit for Academic Success.
+13062052269
info@desklib.com
Available 24*7 on WhatsApp / Email
![[object Object]](/_next/static/media/star-bottom.7253800d.svg)
Unlock your academic potential
Copyright © 2020–2026 A2Z Services. All Rights Reserved. Developed and managed by ZUCOL.