BRICS Nations: Economic Performance, Global Contribution, and Analysis
VerifiedAdded on 2021/06/18
|17
|3859
|21
Report
AI Summary
This report provides an executive summary and detailed analysis of the economic performance of the BRICS nations: Brazil, Russia, India, China, and South Africa. It examines their GDP growth rates, with data visualizations illustrating trends over time, and discusses their contributions to the global economy. The report explores the reasons for including these countries within the BRICS group, highlighting their potential to influence the world market, and the establishment of the New Development Bank. The analysis covers each country's economic structure, key sectors, and historical performance, including periods of recession and recovery. The report concludes by emphasizing the combined economic potential of the BRICS nations and their increasing share in the global GDP, supported by statistical data and projections.
Running head: POLITICAL ECONOMY
Political Economy
Name of the university
Name of the student
Author Note
Political Economy
Name of the university
Name of the student
Author Note
Paraphrase This Document
Need a fresh take? Get an instant paraphrase of this document with our AI Paraphraser
1POLITICAL ECONOMY
Executive Summary:
This report has focused on the economical activity of each country under BRICS, which are,
Brazil, Russia, India, China and South Africa. To analyse economic performance of those
countries, this report has used GDP growth rate of each country. Moreover, share of those
countries on global economy has also mentioned to understand their impacts on world
economy. Based on those data and chief concepts of BRICS, this report has mentioned some
causes behind choosing those countries under BRICS.
2POLITICAL ECONOMY
Table of Contents
Introduction:...............................................................................................................................3
Economics performance of BRICS:...........................................................................................3
Economic performance of Brazil:..........................................................................................4
Economic performance of India:............................................................................................6
Economic performance of China:..........................................................................................7
Economic performance of South Africa:...............................................................................8
Reason for including within group:............................................................................................9
Facts for involving countries within BRICS:.........................................................................9
Economic contributions in the world market:......................................................................10
Conclusion:..............................................................................................................................13
References:...............................................................................................................................14
⊘ This is a preview!⊘
Do you want full access?
Subscribe today to unlock all pages.
Trusted by 1+ million students worldwide
3POLITICAL ECONOMY
Introduction:
BRICS is the acronym of five countries that are Brazil, Russia, India, China and
South Africa, which are expanding their economy rapidly. Each country has influenced their
regional affairs significantly and all of them are members of G20 (Cooper & Farooq, 2017).
South Africa is the last country, which is added in this group in 2011. Headquarter of BRICS
is in Shanghai, China (Armijo & Roberts, 2014). According to economists, those countries
are going to dominate the world economy by 2050. In 2015, those countries have possessed
more than 3.1 billion people, which is almost 41% of total population of the world.
Moreover, those countries together are going to capture 23.2% of the world’s total national
income in 2018 (Rodionova, Chernyaev & Korenevskaya, 2017). The chief difference
between BRICS and the European Union is that, countries of BRICS do not have political
alliance or formal trading association within them like the second one. Those countries,
especially China and India are economically potential to form a strong economic bloc. To
maintain their cooperation, each country attends summit on the regular basis. The main
motive of BRICS is to develop their countries together through providing financial support
and assisting various infrastructure and projects and so on. For this reason, countries of
BRICS have established New Development bank (NDB), which is also known as BRICS
Development Bank and based on agreement (Cooper & Farooq, 2015). This bank is going to
support private and public projects through providing loans, equity participation and
guarantees.
Economics performance of BRICS:
The chief characteristic of each BRICS country is its developing economic
performance, which can be derived by their respective growth rate of gross domestic product
(GDP). Hence, it is essential to describe economic condition of those countries precisely.
Paraphrase This Document
Need a fresh take? Get an instant paraphrase of this document with our AI Paraphraser

4POLITICAL ECONOMY
Economic performance of Brazil:
Based on nominal gross domestic product, the economy of Brazil has ranked as eighth
all over the world. The mixed economic structure of this country has focused on import
substitution for obtaining economic growth. Within 2000 and 2012, Brazil has expanded its
economy rapidly and consequently has surpassed the United Kingdom (Kamali et al., 2017).
As a result, this country has become sixth largest country worldwide, based on its economy in
2012. However, Brazil has also experienced recession period since 2014, though after 2017,
this specified country has recovered its economic condition again. The economic progress of
Brazil between 2003 and 2014 has helped 29 million people to lift out of poverty and
consequently, income inequality among people has also decreased gradually (Aytaç, 2018).
Figure 1: GDP growth rate of Brazil
Source: (tradingeconomics.com, 2018)
According to figure 1, the GDP growth rate of Brazil has decreased sharply in 2015.
However, after this year, this trend has increased gradually.
Economic performance of Russia:
Russia has possessed a mixed economy with upper-middle income along with state
ownership for some strategic areas. In 1990s, the country has privatised most of its
agricultural and industrial sectors along with defence and energy-related sectors. The country
5POLITICAL ECONOMY
has possessed almost 30% of the natural resources all over the world (Bykova & Lopez-
Iturriaga, 2018). Its economic growth chiefly depends on energy revenues obtained from oil,
precious metals and natural gas and consequently, the country exports those products by large
amount. As a result, Russia is considered as “energy superpower”. The economy of Russia
has remained sixth largest economy based on its PPP worldwide while based on exchange
rates, it has ranked twelfth in 2016. The standard of living of this country has increased
significantly between 2000 and 2012 through exporting energy products. This in turn has led
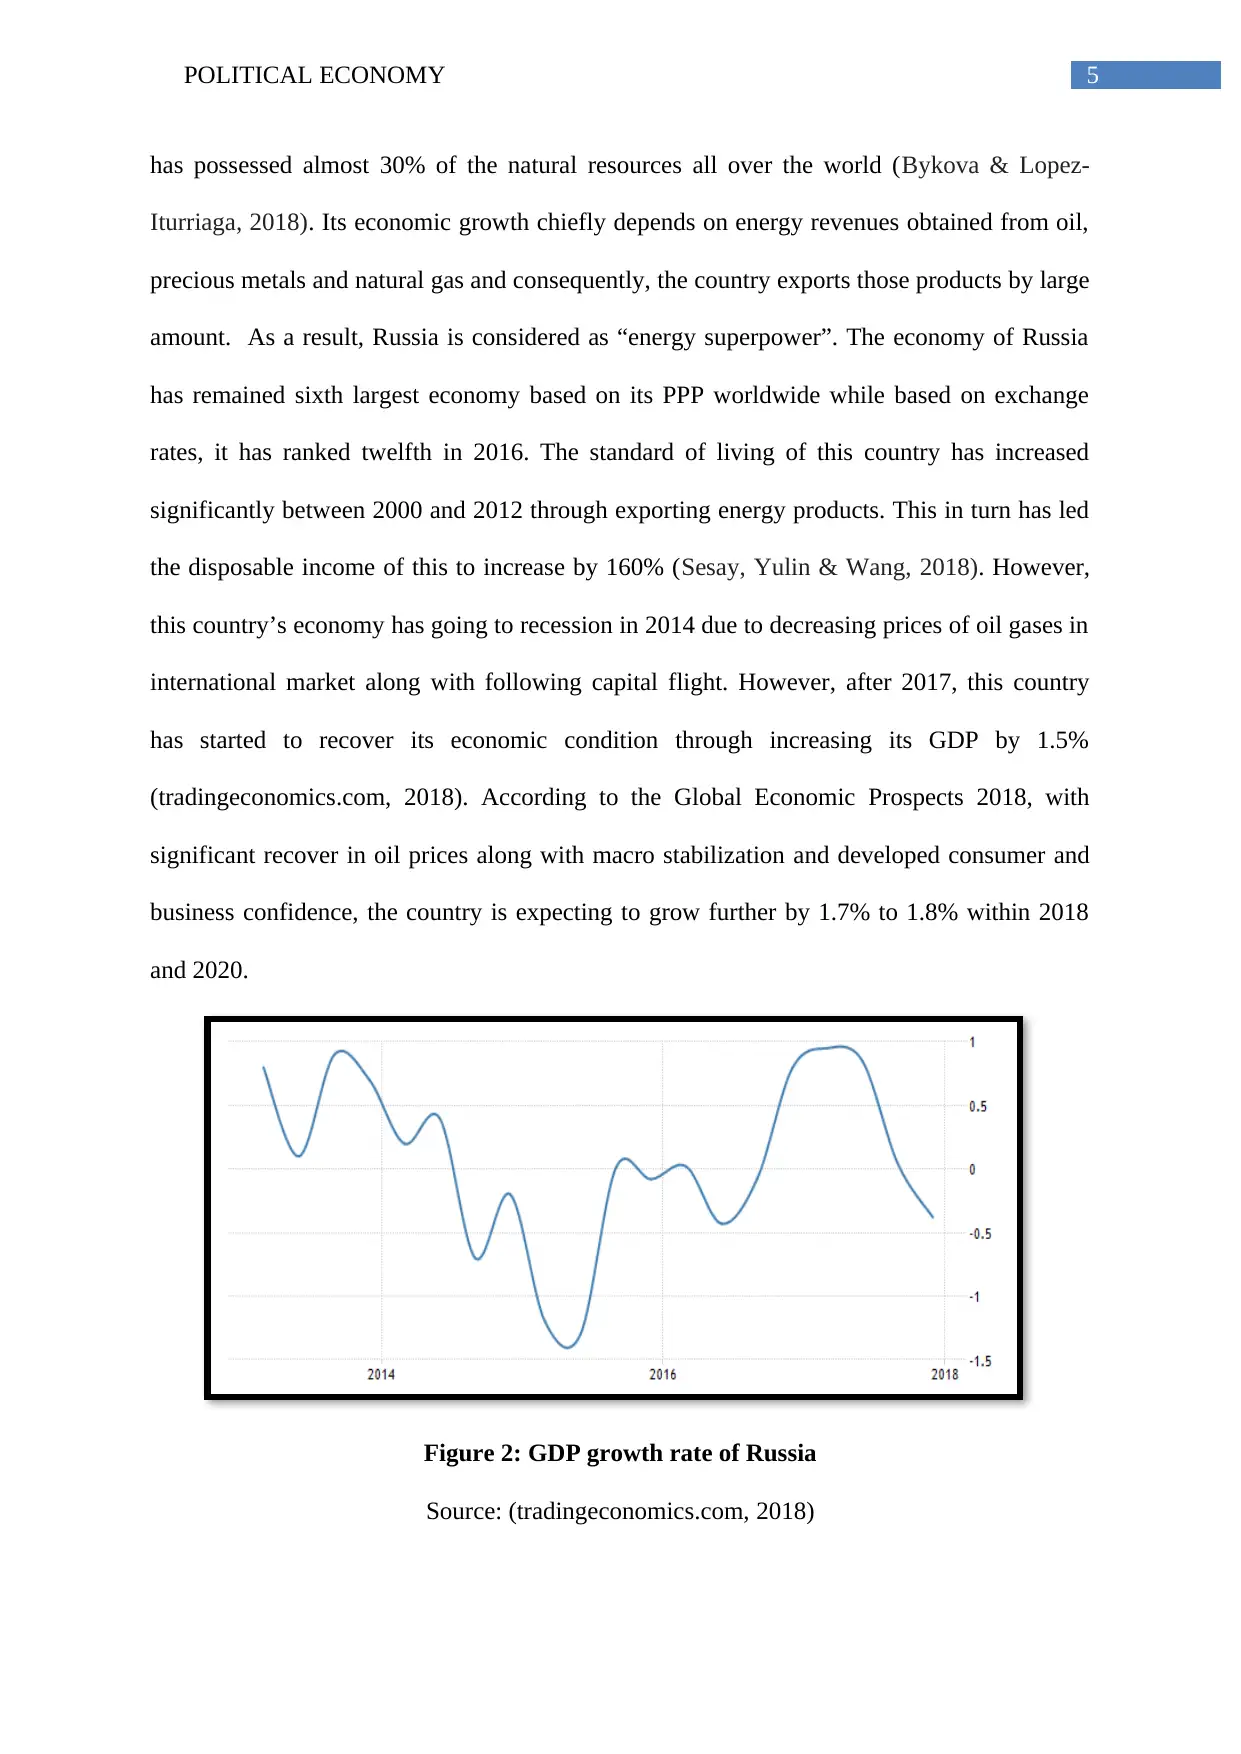
the disposable income of this to increase by 160% (Sesay, Yulin & Wang, 2018). However,
this country’s economy has going to recession in 2014 due to decreasing prices of oil gases in
international market along with following capital flight. However, after 2017, this country
has started to recover its economic condition through increasing its GDP by 1.5%
(tradingeconomics.com, 2018). According to the Global Economic Prospects 2018, with
significant recover in oil prices along with macro stabilization and developed consumer and
business confidence, the country is expecting to grow further by 1.7% to 1.8% within 2018
and 2020.
Figure 2: GDP growth rate of Russia
Source: (tradingeconomics.com, 2018)
has possessed almost 30% of the natural resources all over the world (Bykova & Lopez-
Iturriaga, 2018). Its economic growth chiefly depends on energy revenues obtained from oil,
precious metals and natural gas and consequently, the country exports those products by large
amount. As a result, Russia is considered as “energy superpower”. The economy of Russia
has remained sixth largest economy based on its PPP worldwide while based on exchange
rates, it has ranked twelfth in 2016. The standard of living of this country has increased
significantly between 2000 and 2012 through exporting energy products. This in turn has led
the disposable income of this to increase by 160% (Sesay, Yulin & Wang, 2018). However,
this country’s economy has going to recession in 2014 due to decreasing prices of oil gases in
international market along with following capital flight. However, after 2017, this country
has started to recover its economic condition through increasing its GDP by 1.5%
(tradingeconomics.com, 2018). According to the Global Economic Prospects 2018, with
significant recover in oil prices along with macro stabilization and developed consumer and
business confidence, the country is expecting to grow further by 1.7% to 1.8% within 2018
and 2020.
Figure 2: GDP growth rate of Russia
Source: (tradingeconomics.com, 2018)
⊘ This is a preview!⊘
Do you want full access?
Subscribe today to unlock all pages.
Trusted by 1+ million students worldwide
6POLITICAL ECONOMY
Based on figure 2, it is seen that the GDP growth rate of Russia has decreased after
since 2014 though after 2017, this trend has started to increase gradually.
Economic performance of India:
India has possessed a developing and mixed economy. Based on nominal GDP, the
country has possessed sixth largest economy. According to the per capita nominal GDP, the
country ranks 141 in 2018. After economic liberalisation in 1991, India’s GDP has increased
annually by 6% to 7% in almost every year (Khan, Yadav & Mathew, 2017). Moreover,
within financial year 2015 and 2018, the country’s economy has become the fastest growing
country all over the world. The chief factors behind rapid expansion of India’s economy are
young workforce, higher amount of savings and investment along with decreasing
dependency ratio and increasing integration in world economy. This specific country has
possessed world’s rapidly expanding service sectors, which has contributed 57% to the
country’s total GDP in 2012-13 (tradingeconomics.com, 2018). In this context, it can be
mentioned that India has become one of the major exporters of business process outsourcing
(BPO), IT services and software services and consequently has earned $154 billion revenue
in 2017 (Upadhyayula, Dhandapani & Karna, 2017). Moreover, between 2014 and 2015, this
country has possessed more than 3000 technology start-hubs and consequently has become
third-largest start-up hub worldwide. India’s economy is chiefly based on agricultural sector
as it has contributed largest portion to the country’s GDP.
Paraphrase This Document
Need a fresh take? Get an instant paraphrase of this document with our AI Paraphraser
7POLITICAL ECONOMY
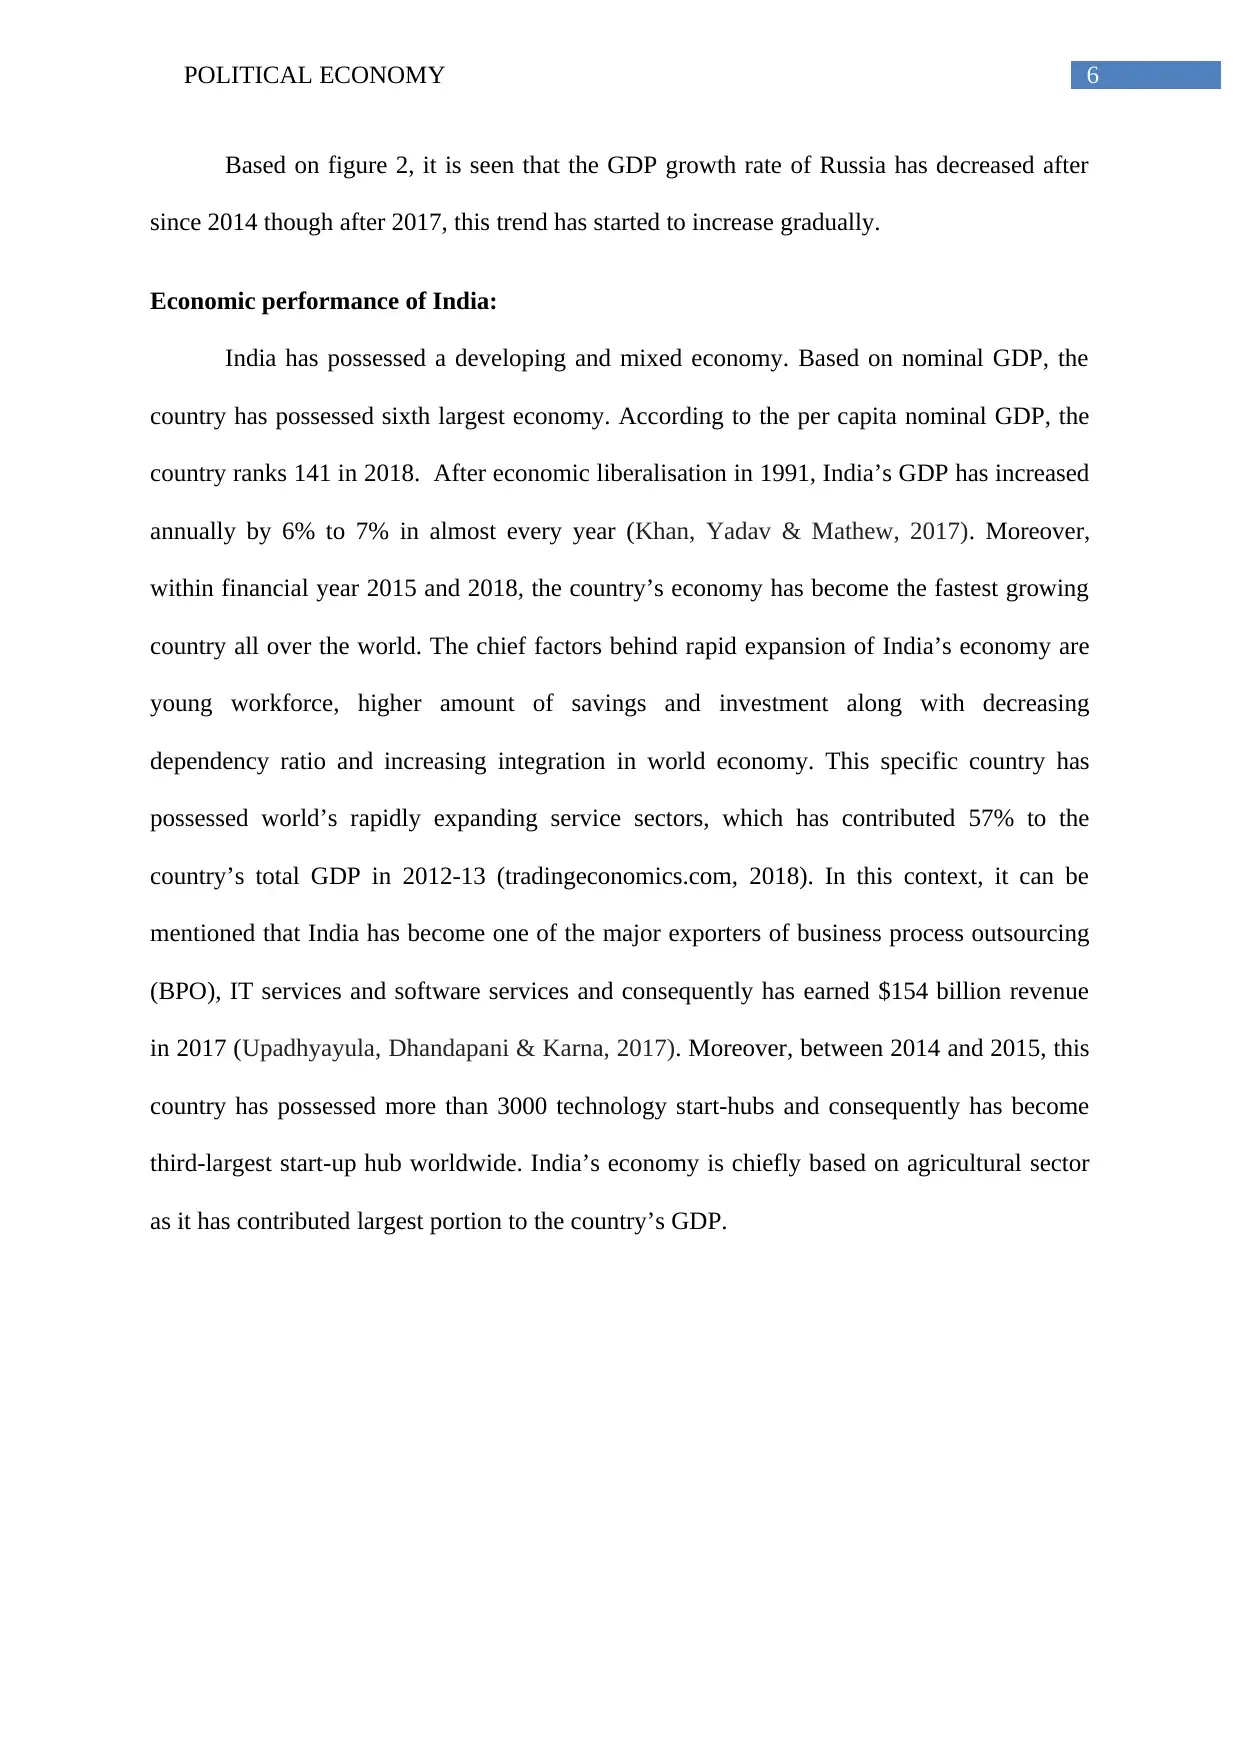
Figure 3: GDP growth rate of India
Source: (tradingeconomics.com, 2018)
Figure 3 has represented GDP growth rate of India since 2013. Based on this trend,
the GDP growth has decreased after 2016. However, after 2017, the country has recovered its
economic condition again.
Economic performance of China:
Based on nominal GDP, China has possessed the second largest economy, while
based on purchasing power parity it has become the largest economy all over the world. Until
2015, the economy of China has remained the fastest-growing one, with 10% average growth
rates over 30 years. Political and historical facts have played important role for developing its
economic condition and consequently, the public sector has contribute significant portion
compare to the private one, to China’s national income. In 2016, China has ranked 71
according to the nominal GDP on per capita income basis (Yang & Zhang, 2018). This
specified country is the largest manufacturing economy of the world and exports goods by
large amount as well. In addition to this, China is considered as the fastest growing consumer
market in world and second-largest importer of goods. Consequently, this country has
become the largest trader worldwide and has also played significant role in international
8POLITICAL ECONOMY
trade. Thus, China has increased its engagement with trading organisations in recent years
along with some treaties.
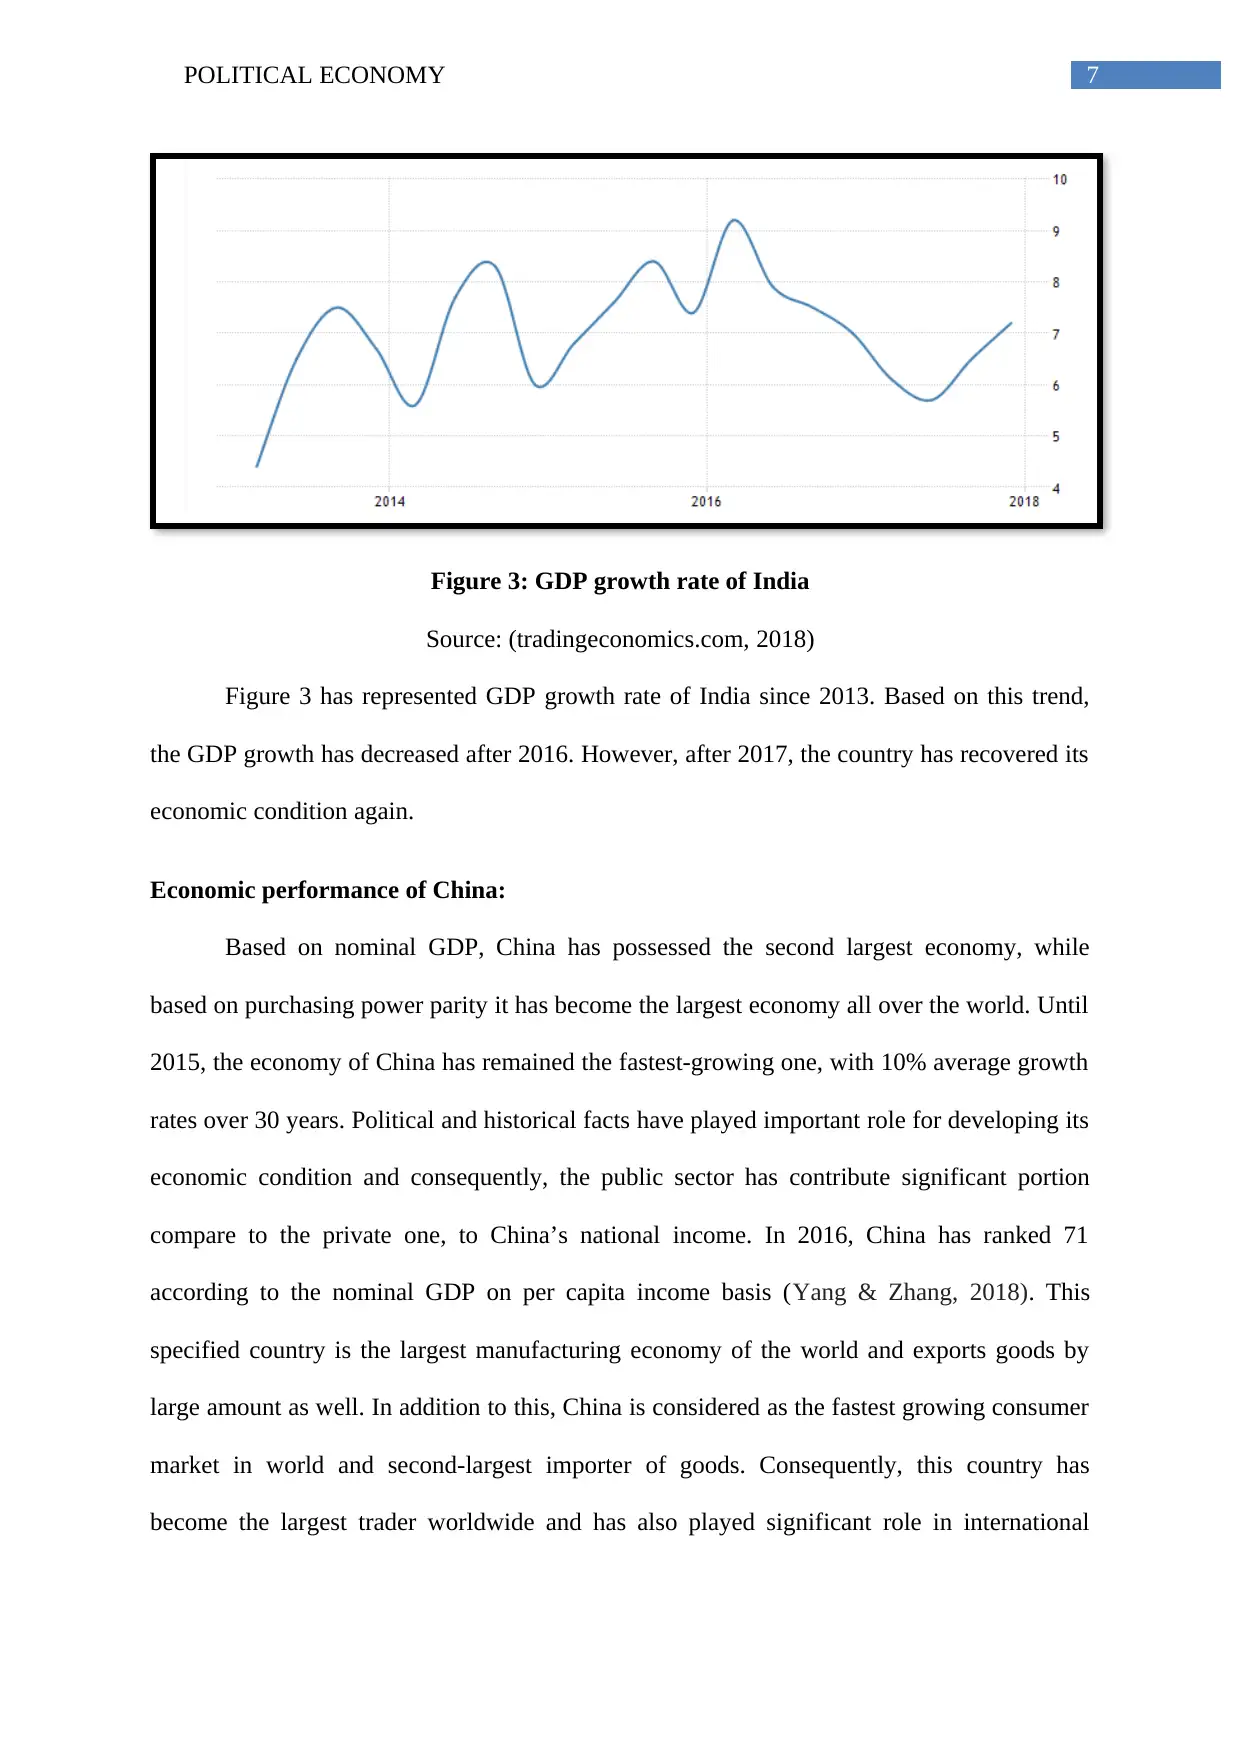
Figure 4: GDP growth rate of China
Source: (tradingeconomics.com, 2018)
According to figure 4, China’s GDP has decreased gradually after 2014. This happens
due to economic slowdown of this country as public sector has experienced structural
changes due to debt burden.
Economic performance of South Africa:
South Africa, which is the last country added in BRICS in 2011, has the third largest
economy after Nigeria and Egypt. According to the World Bank, this industrialised country
has possessed an upper-middle-income economy. This country has a comparative advantage
for producing mining, agriculture and manufacturing products (Numbi & Malinga, 2017).
However, the economic structure of this country is diversified with some key economic
sectors, which have primary sector along with secondary sectors including clothing, textiles,
energy, and telecommunication and so on.
trade. Thus, China has increased its engagement with trading organisations in recent years
along with some treaties.
Figure 4: GDP growth rate of China
Source: (tradingeconomics.com, 2018)
According to figure 4, China’s GDP has decreased gradually after 2014. This happens
due to economic slowdown of this country as public sector has experienced structural
changes due to debt burden.
Economic performance of South Africa:
South Africa, which is the last country added in BRICS in 2011, has the third largest
economy after Nigeria and Egypt. According to the World Bank, this industrialised country
has possessed an upper-middle-income economy. This country has a comparative advantage
for producing mining, agriculture and manufacturing products (Numbi & Malinga, 2017).
However, the economic structure of this country is diversified with some key economic
sectors, which have primary sector along with secondary sectors including clothing, textiles,
energy, and telecommunication and so on.
⊘ This is a preview!⊘
Do you want full access?
Subscribe today to unlock all pages.
Trusted by 1+ million students worldwide
9POLITICAL ECONOMY
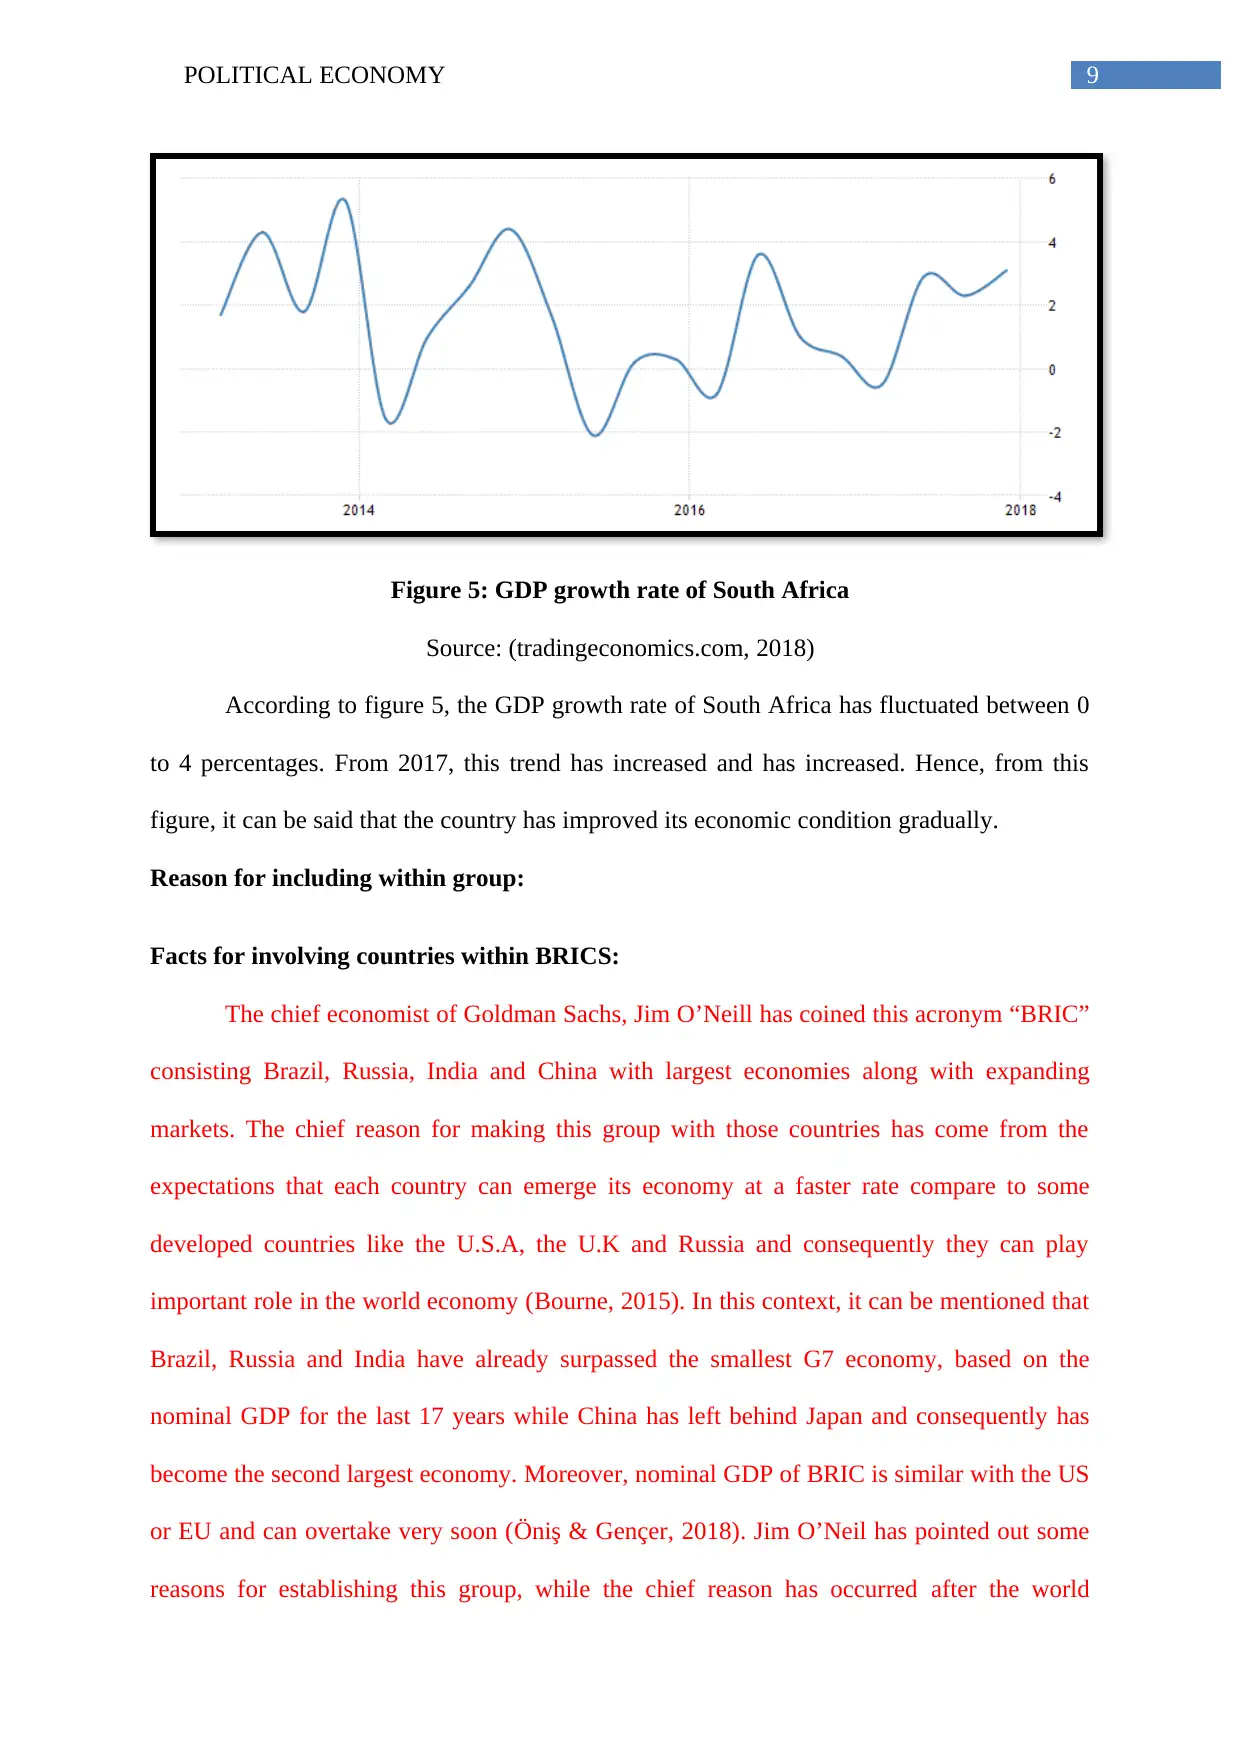
Figure 5: GDP growth rate of South Africa
Source: (tradingeconomics.com, 2018)
According to figure 5, the GDP growth rate of South Africa has fluctuated between 0
to 4 percentages. From 2017, this trend has increased and has increased. Hence, from this
figure, it can be said that the country has improved its economic condition gradually.
Reason for including within group:
Facts for involving countries within BRICS:
The chief economist of Goldman Sachs, Jim O’Neill has coined this acronym “BRIC”
consisting Brazil, Russia, India and China with largest economies along with expanding
markets. The chief reason for making this group with those countries has come from the
expectations that each country can emerge its economy at a faster rate compare to some
developed countries like the U.S.A, the U.K and Russia and consequently they can play
important role in the world economy (Bourne, 2015). In this context, it can be mentioned that
Brazil, Russia and India have already surpassed the smallest G7 economy, based on the
nominal GDP for the last 17 years while China has left behind Japan and consequently has
become the second largest economy. Moreover, nominal GDP of BRIC is similar with the US
or EU and can overtake very soon (Öniş & Gençer, 2018). Jim O’Neil has pointed out some
reasons for establishing this group, while the chief reason has occurred after the world
Paraphrase This Document
Need a fresh take? Get an instant paraphrase of this document with our AI Paraphraser
10POLITICAL ECONOMY
financial crisis, the world has experienced an imbalance, and western countries have played
major roles to control financial institution after this crisis.
Economic contributions in the world market:
After discussing economic performance of each country under BRICS, the chief
reason for including them within this group can be analysed. Every country of BRICS has
developed their economic condition through capturing significant market share in world
economy. As a result, they have possessed enough potential to defeat some economically
strong developed countries like the U.S.A by 2050 and this is the chief reason behind
including those countries within the group of BRICS (Ivanova, Saratovsky & Latyshov,
2018). Consequently, five countries may jointly form the largest entity in international market
due to their fastest growing and expanding markets. In this context, it can be mentioned that,
each member country of BRICS have enough opportunity to develop their economic
condition further through using their unused resources, increasing populations and expanding
infrastructure (Armijo & Roberts,2014). Moreover, the role of China and India can be
described with special emphasis, where these two countries have possessed significant share
in global economy while these share can increase further in coming years. Thus, those
countries have formed BRICS for helping each other regarding various economical issues.
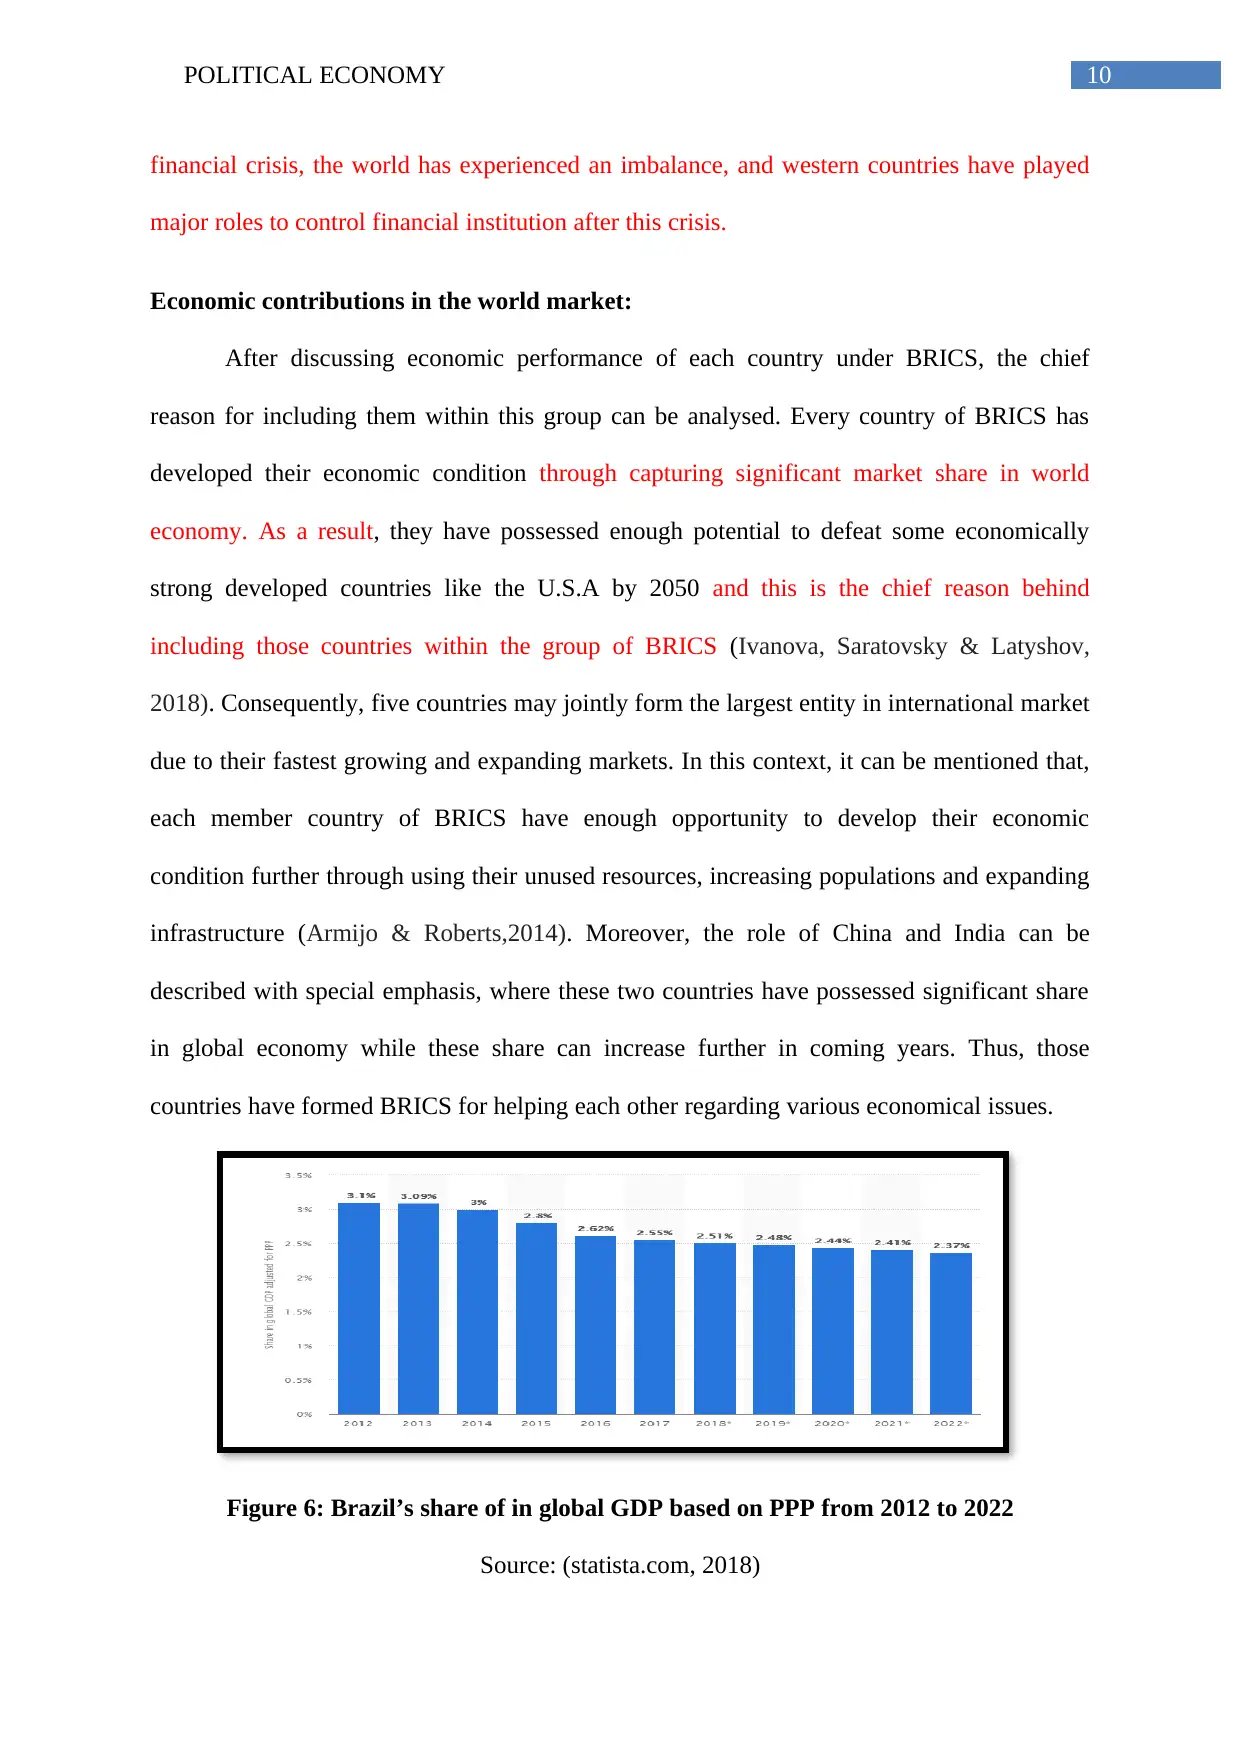
Figure 6: Brazil’s share of in global GDP based on PPP from 2012 to 2022
Source: (statista.com, 2018)
financial crisis, the world has experienced an imbalance, and western countries have played
major roles to control financial institution after this crisis.
Economic contributions in the world market:
After discussing economic performance of each country under BRICS, the chief
reason for including them within this group can be analysed. Every country of BRICS has
developed their economic condition through capturing significant market share in world
economy. As a result, they have possessed enough potential to defeat some economically
strong developed countries like the U.S.A by 2050 and this is the chief reason behind
including those countries within the group of BRICS (Ivanova, Saratovsky & Latyshov,
2018). Consequently, five countries may jointly form the largest entity in international market
due to their fastest growing and expanding markets. In this context, it can be mentioned that,
each member country of BRICS have enough opportunity to develop their economic
condition further through using their unused resources, increasing populations and expanding
infrastructure (Armijo & Roberts,2014). Moreover, the role of China and India can be
described with special emphasis, where these two countries have possessed significant share
in global economy while these share can increase further in coming years. Thus, those
countries have formed BRICS for helping each other regarding various economical issues.
Figure 6: Brazil’s share of in global GDP based on PPP from 2012 to 2022
Source: (statista.com, 2018)
11POLITICAL ECONOMY
The above figure has represented share of Brazil in global gross domestic product,
based on purchasing power parity (PPP) from 2012 to 2022. In 2017, the country has
contributed 2.55% to the world’s total income (statista.com, 2018). Based on this, it can be
predicted that this trend is going to fall in coming years though this rate is low.
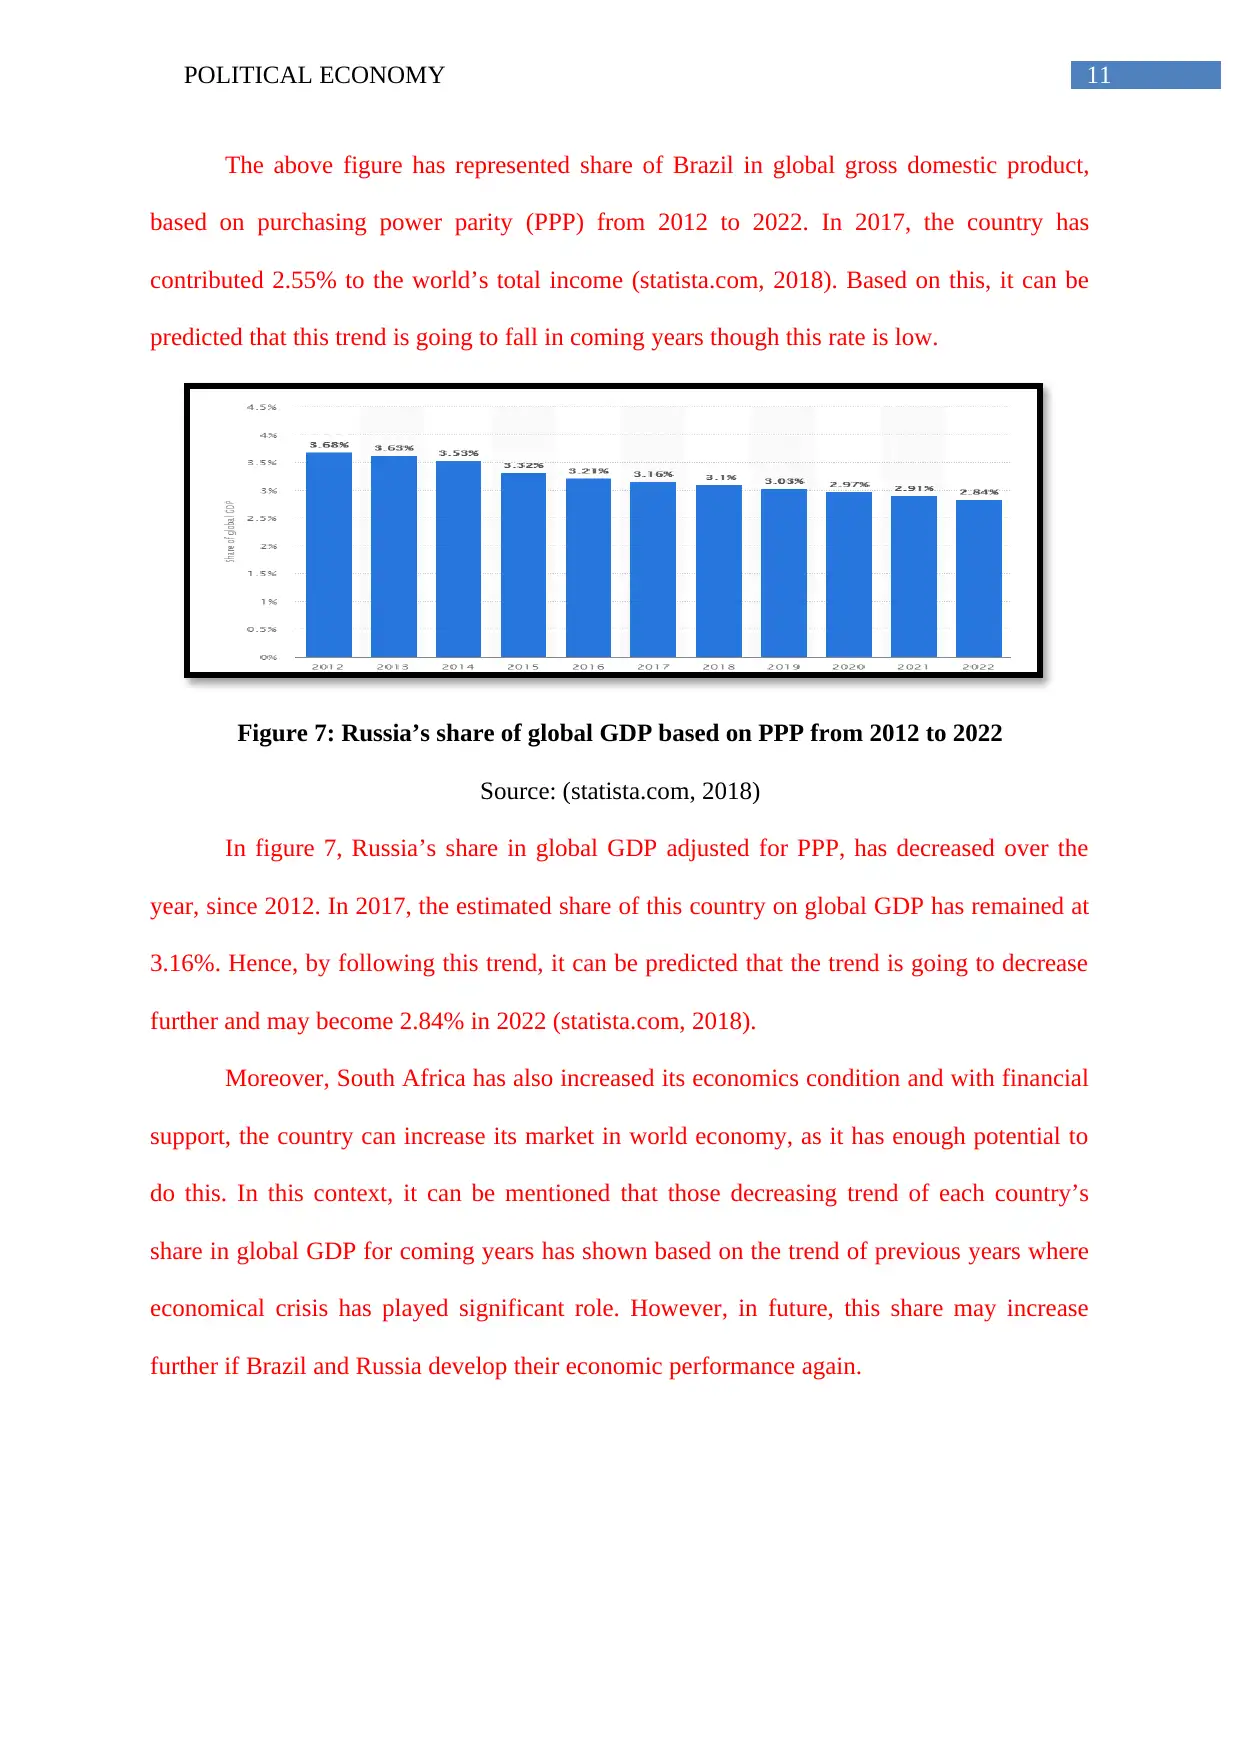
Figure 7: Russia’s share of global GDP based on PPP from 2012 to 2022
Source: (statista.com, 2018)
In figure 7, Russia’s share in global GDP adjusted for PPP, has decreased over the
year, since 2012. In 2017, the estimated share of this country on global GDP has remained at
3.16%. Hence, by following this trend, it can be predicted that the trend is going to decrease
further and may become 2.84% in 2022 (statista.com, 2018).
Moreover, South Africa has also increased its economics condition and with financial
support, the country can increase its market in world economy, as it has enough potential to
do this. In this context, it can be mentioned that those decreasing trend of each country’s
share in global GDP for coming years has shown based on the trend of previous years where
economical crisis has played significant role. However, in future, this share may increase
further if Brazil and Russia develop their economic performance again.
The above figure has represented share of Brazil in global gross domestic product,
based on purchasing power parity (PPP) from 2012 to 2022. In 2017, the country has
contributed 2.55% to the world’s total income (statista.com, 2018). Based on this, it can be
predicted that this trend is going to fall in coming years though this rate is low.
Figure 7: Russia’s share of global GDP based on PPP from 2012 to 2022
Source: (statista.com, 2018)
In figure 7, Russia’s share in global GDP adjusted for PPP, has decreased over the
year, since 2012. In 2017, the estimated share of this country on global GDP has remained at
3.16%. Hence, by following this trend, it can be predicted that the trend is going to decrease
further and may become 2.84% in 2022 (statista.com, 2018).
Moreover, South Africa has also increased its economics condition and with financial
support, the country can increase its market in world economy, as it has enough potential to
do this. In this context, it can be mentioned that those decreasing trend of each country’s
share in global GDP for coming years has shown based on the trend of previous years where
economical crisis has played significant role. However, in future, this share may increase
further if Brazil and Russia develop their economic performance again.
⊘ This is a preview!⊘
Do you want full access?
Subscribe today to unlock all pages.
Trusted by 1+ million students worldwide
1 out of 17
Related Documents


Your All-in-One AI-Powered Toolkit for Academic Success.
+13062052269
info@desklib.com
Available 24*7 on WhatsApp / Email
![[object Object]](/_next/static/media/star-bottom.7253800d.svg)
Unlock your academic potential
Copyright © 2020–2026 A2Z Services. All Rights Reserved. Developed and managed by ZUCOL.