Applied Research Methods: Political Survey Data Analysis Report

Verified

Added on  2023/06/10

|13
|2508
|363
Report
AI Summary
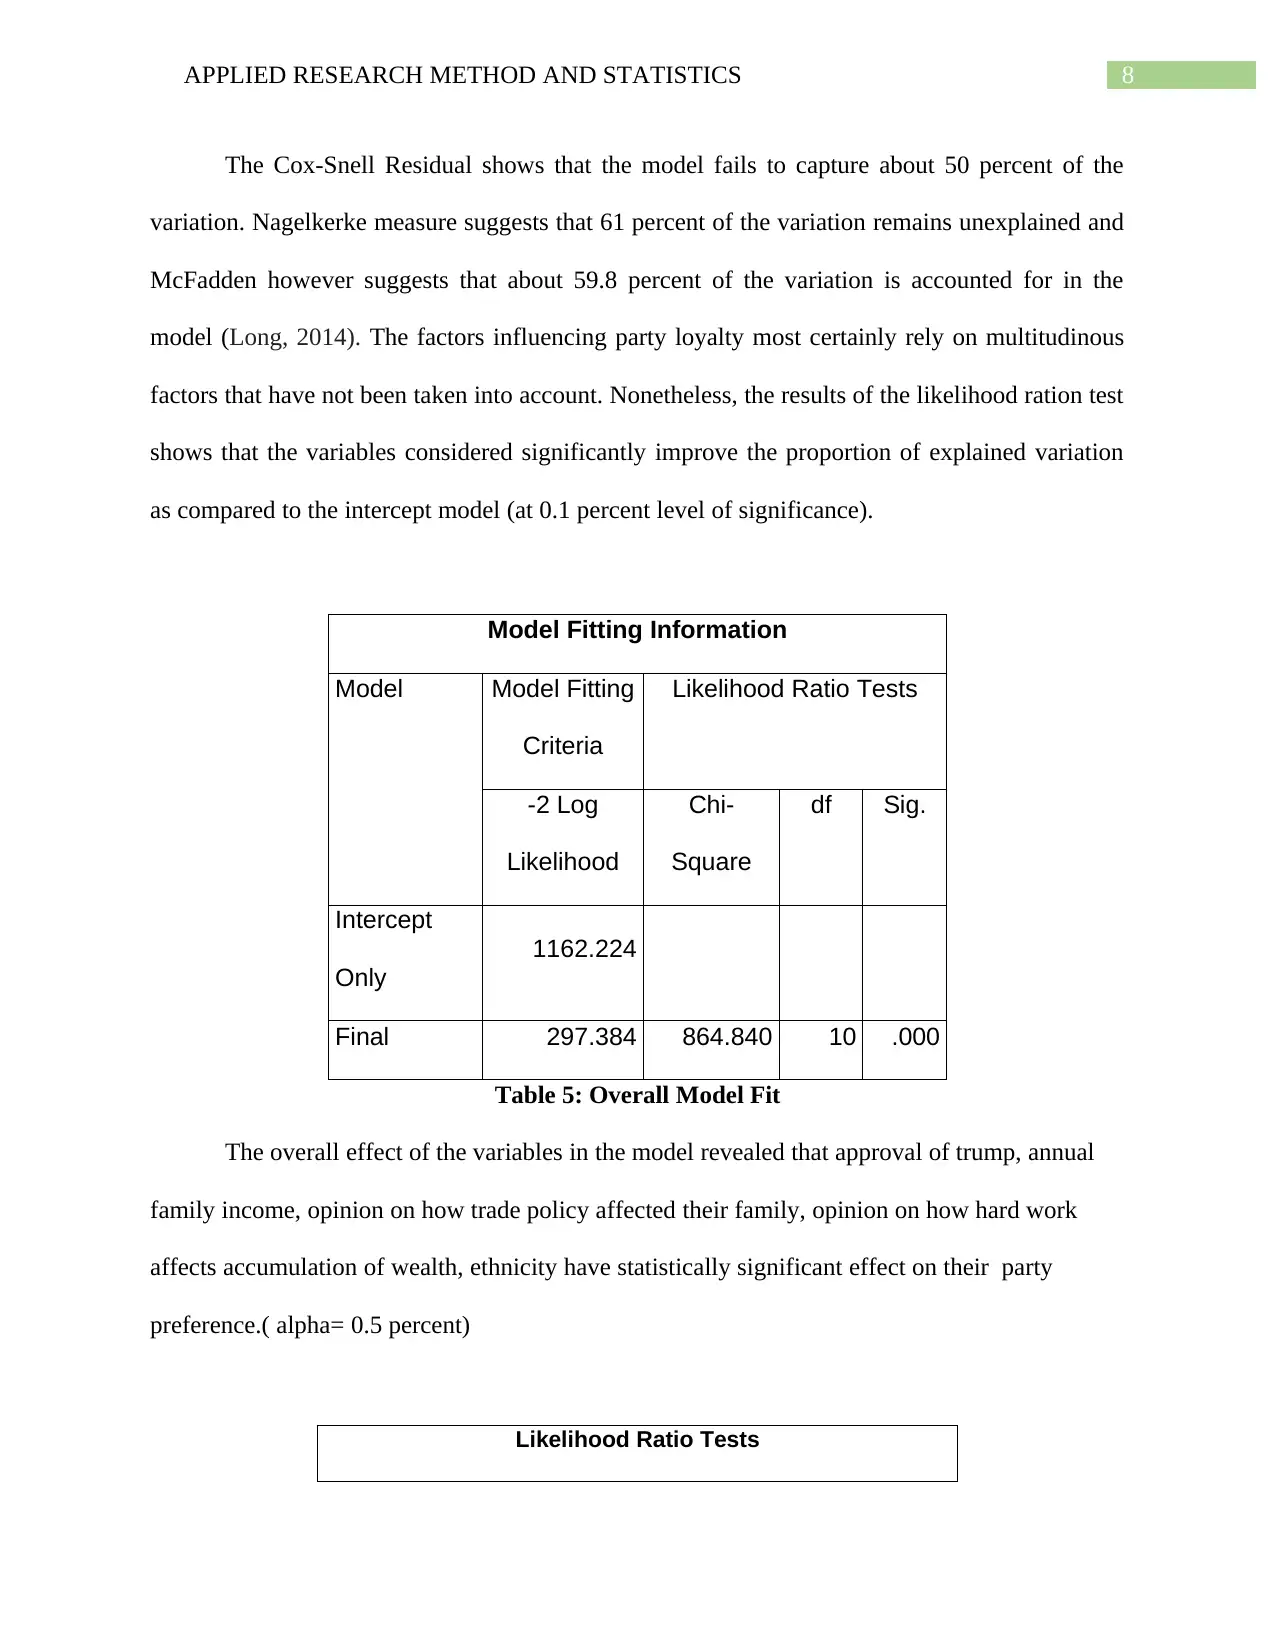
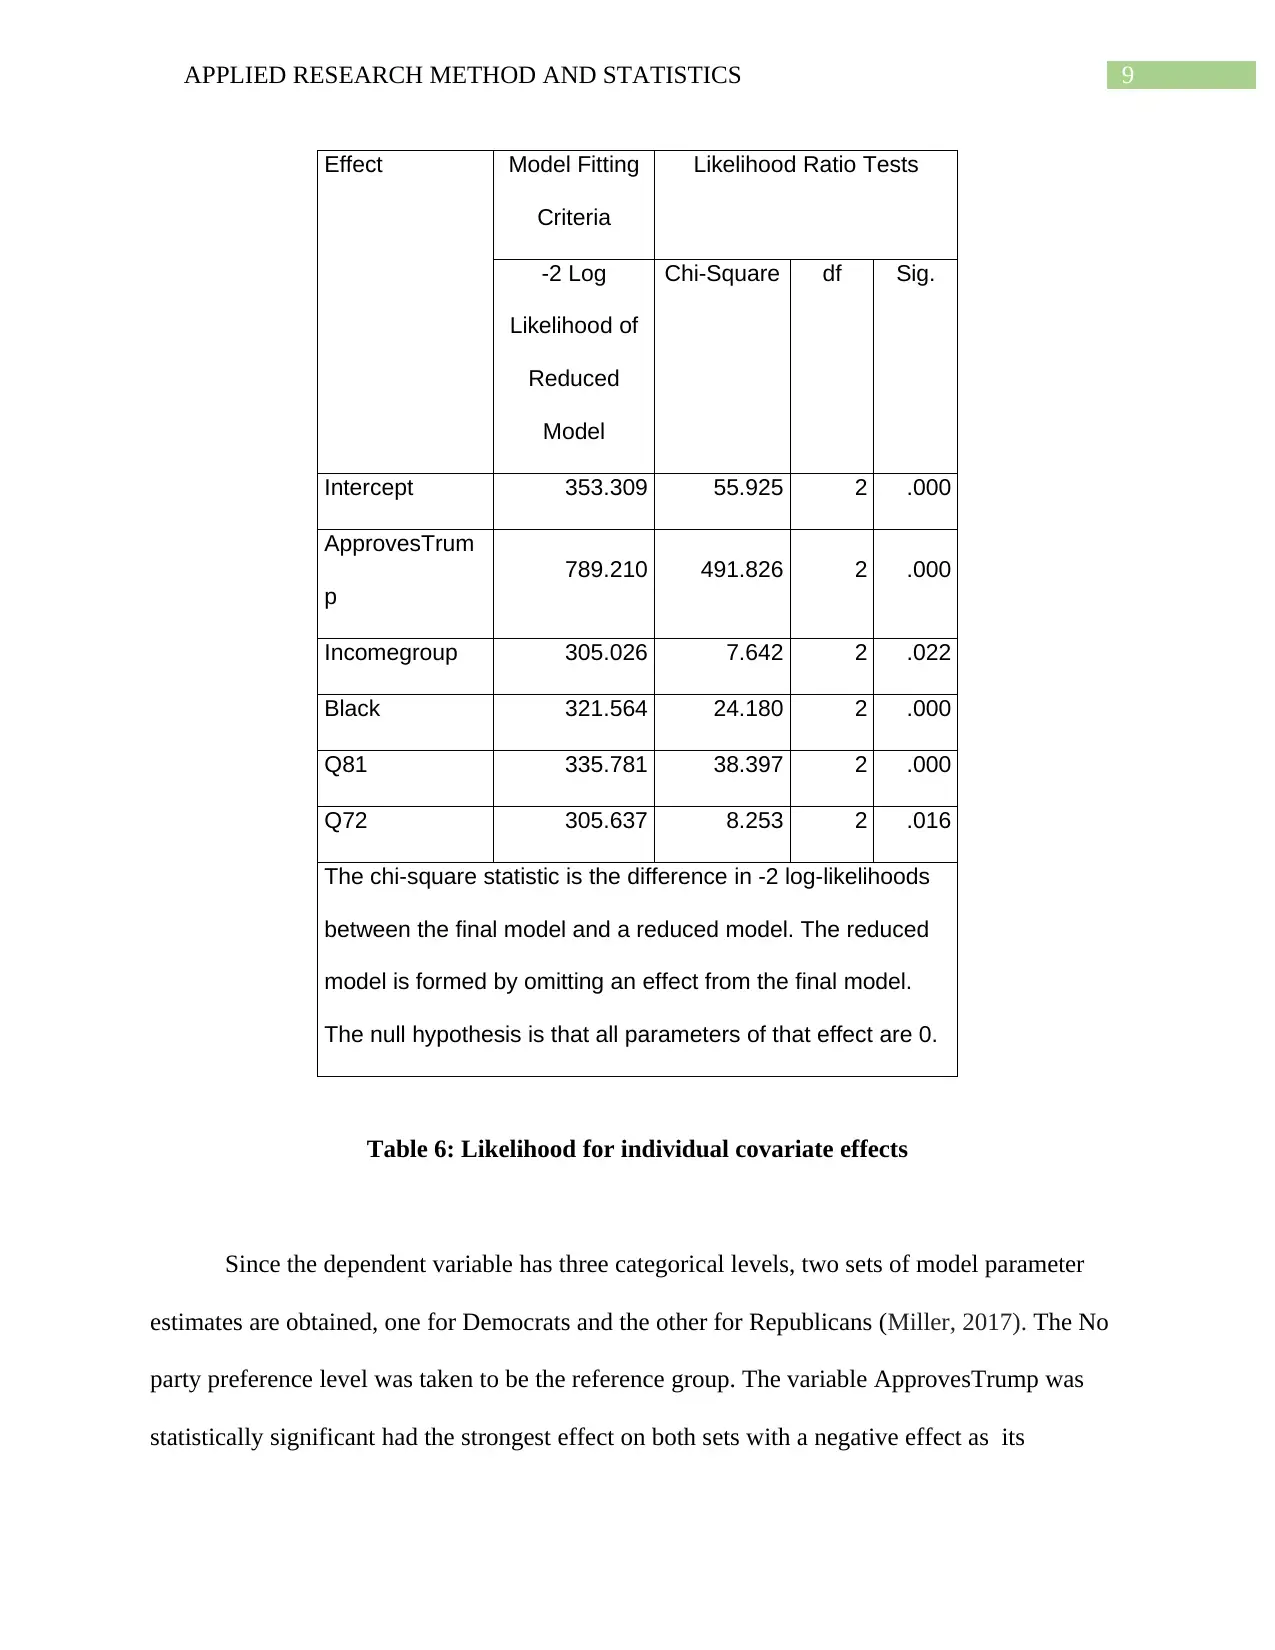
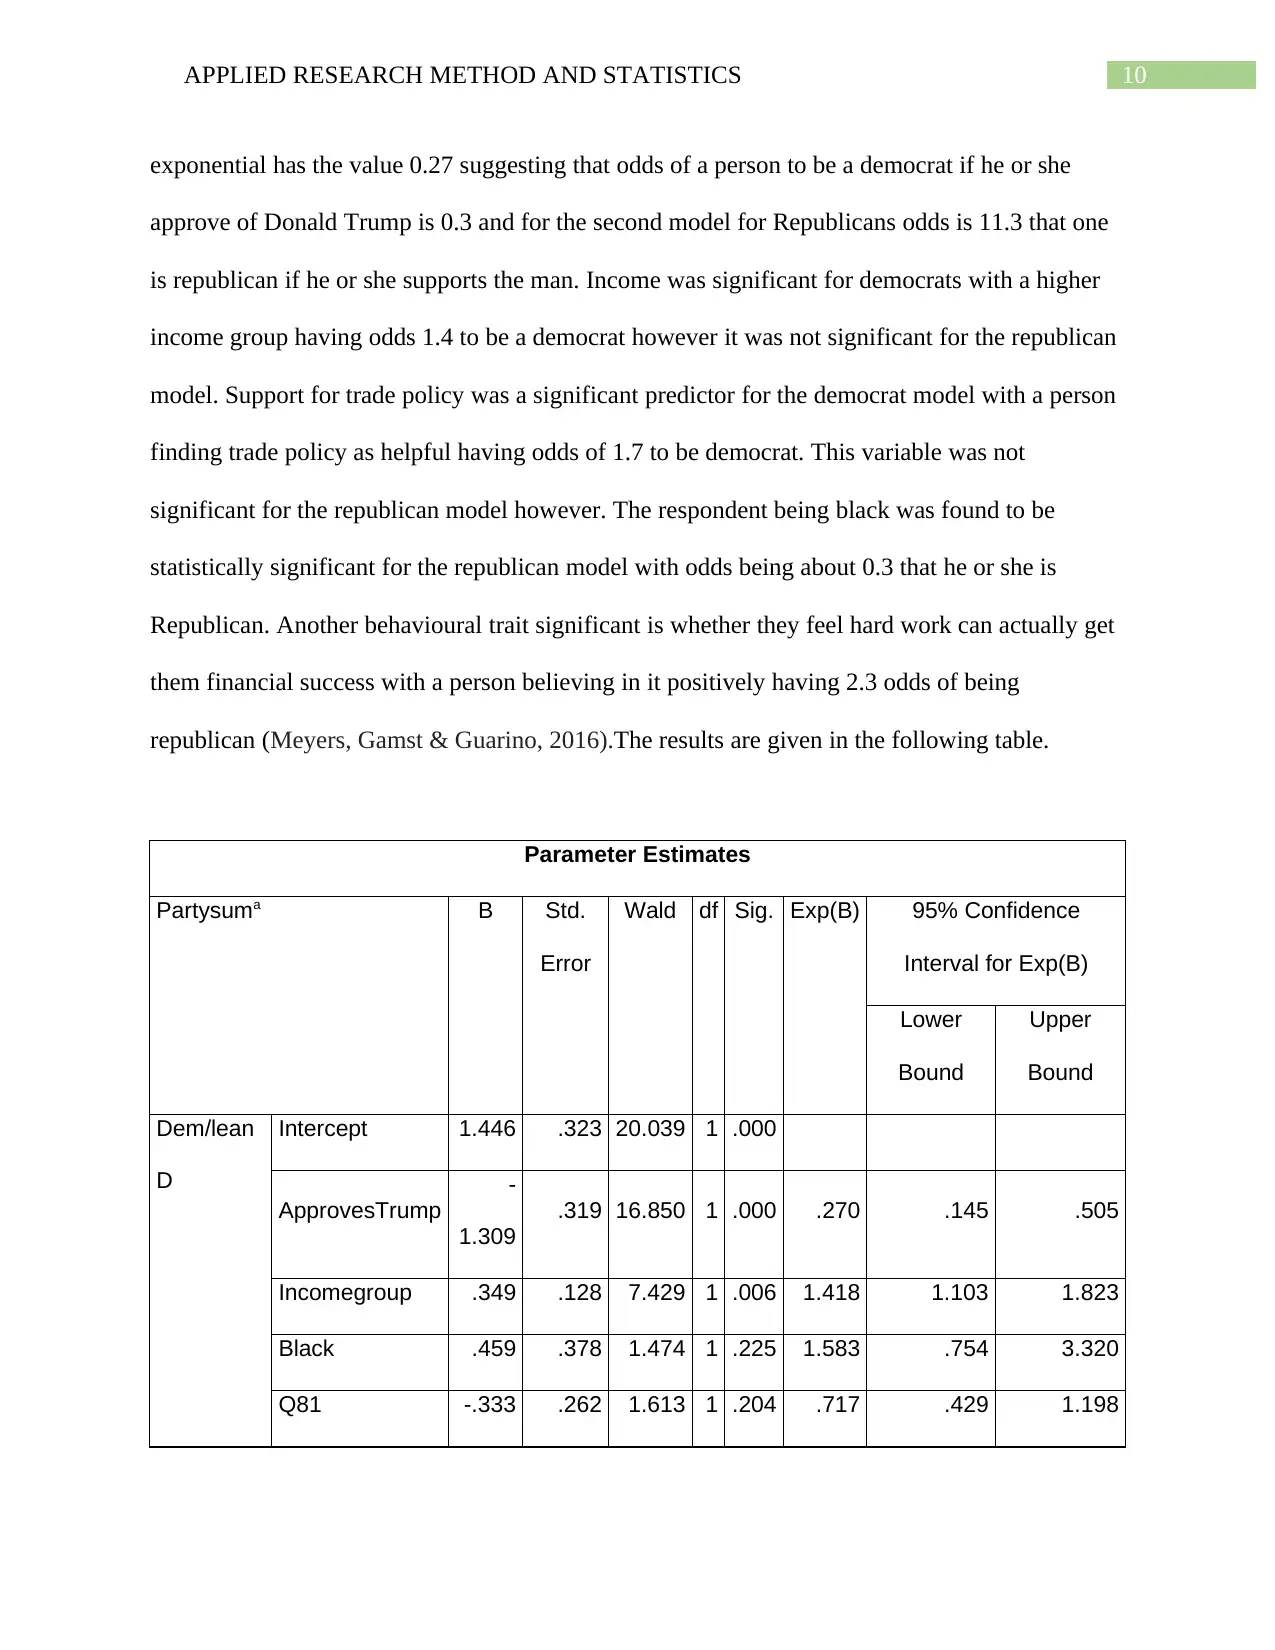
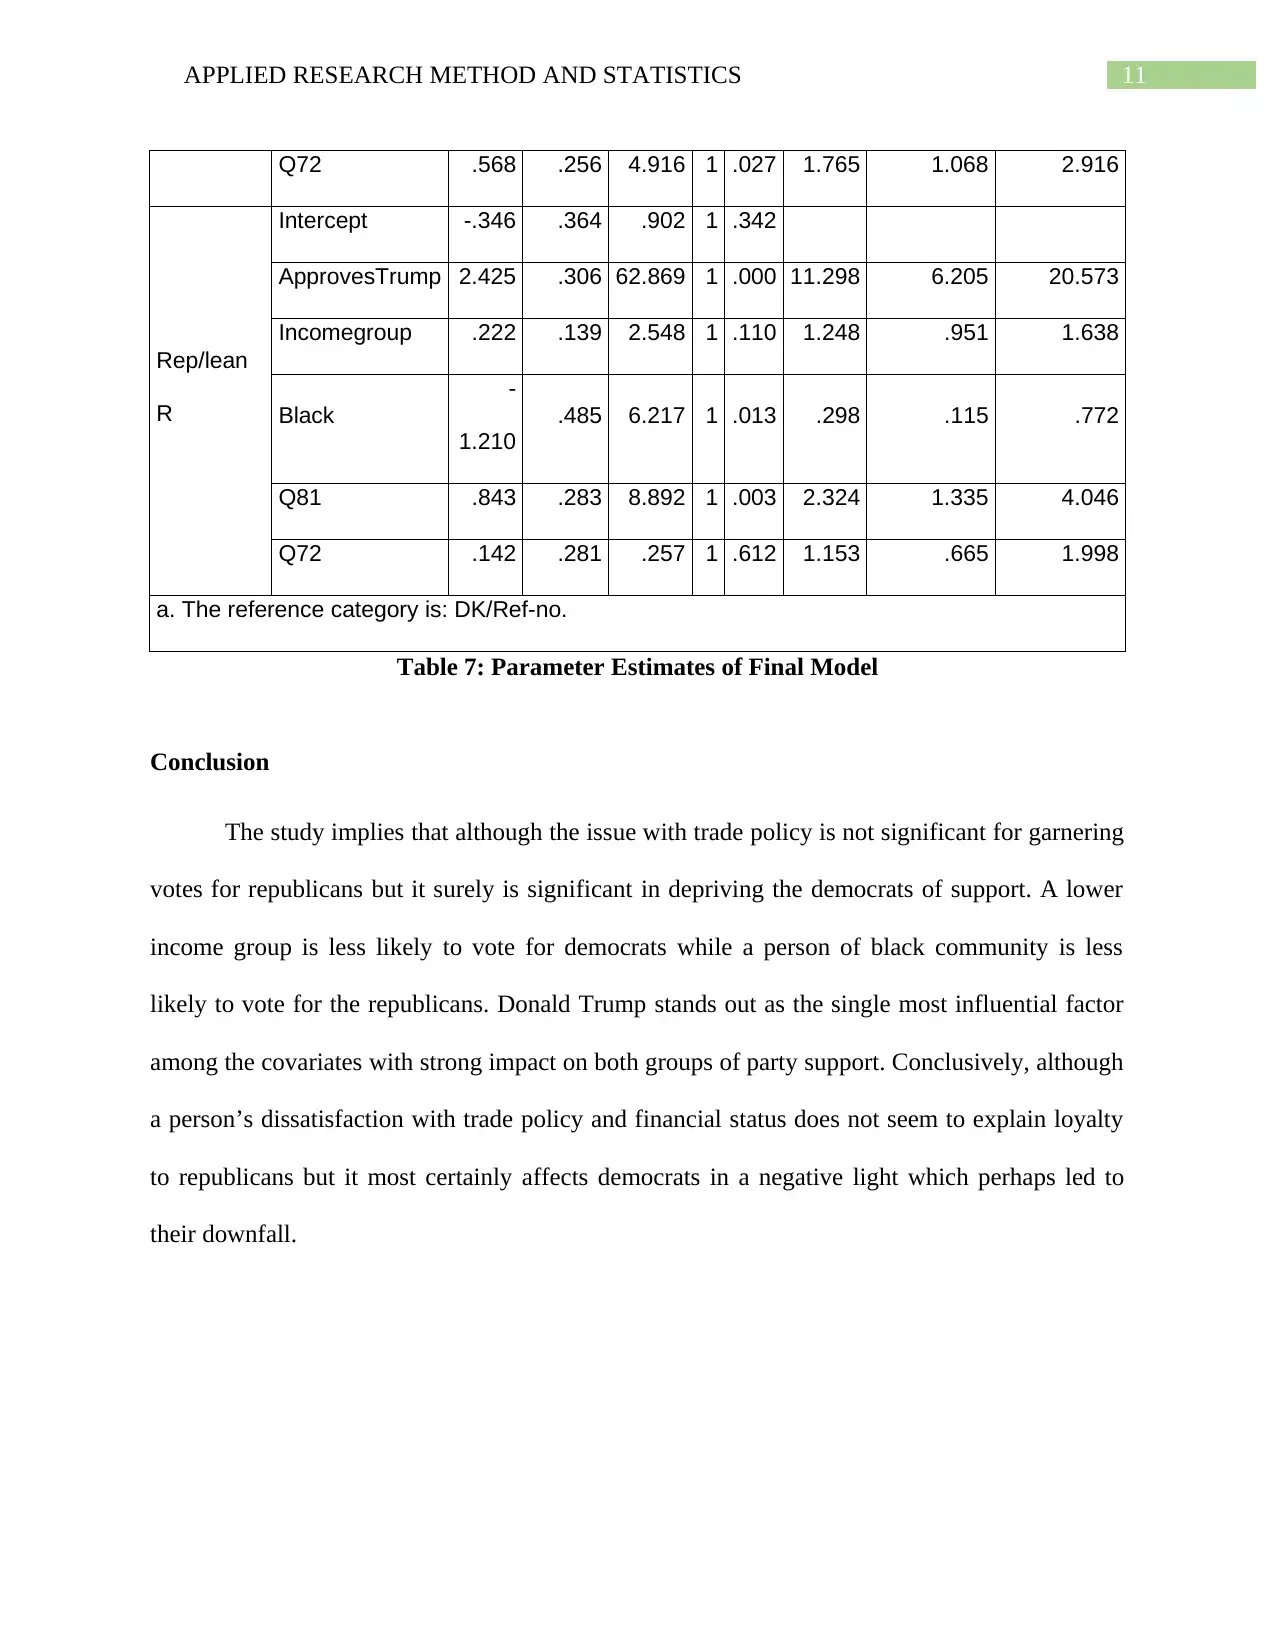
This report presents an analysis of political survey data, focusing on the 2017 US presidential election and employing applied research methods and statistical techniques. The study investigates the impact of various factors, including income, ethnicity, and opinions on trade policies, on voter behavior. The research utilizes a dataset from the Pew Research Center, employing multinomial logistic regression to analyze the relationships between independent and dependent variables. The findings reveal the influence of factors such as approval of Donald Trump, income levels, and opinions on trade on party preferences. The study examines the goodness of fit of the model and the significance of individual covariate effects, providing insights into the complex dynamics of political preferences. The results indicate that while trade policy may not be a significant factor in garnering votes for Republicans, it does impact the support for Democrats. Furthermore, the study highlights the significance of income and ethnicity in shaping political inclinations, with lower-income groups and the black community showing different voting patterns. This report aims to clarify the factors that influenced the election outcomes.
Document Page
Running head: APPLIED RESEARCH METHOD AND STATISTICS
APPLIED RESEARCH METHOD AND STATISTICS
Name of Student
Name of University
Author Note
tabler-icon-diamond-filled.svg

Secure Best Marks with AI Grader

Need help grading? Try our AI Grader for instant feedback on your assignments.
Document Page
1APPLIED RESEARCH METHOD AND STATISTICS
Table of Contents
Introduction......................................................................................................................................2
Discussion........................................................................................................................................2
Statement of Study.......................................................................................................................2
Data Description..........................................................................................................................2
Methodology................................................................................................................................4
Analysis and Results....................................................................................................................4
Conclusion.......................................................................................................................................9
Reference:......................................................................................................................................10
Document Page
2APPLIED RESEARCH METHOD AND STATISTICS
Introduction
The results of the 2017 presidential elections surprised many when the Republican
candidate Donald Trump was able to overtake his Democrat counterpart Hillary Clinton to win
the position of the Head of State. It was seen that the middle and lower income the main voters
base for republicans who were swayed towards the Republicans. One of the key reasons behind
this was hypothesized to be due to their lack of faith towards the Democrat party to solve their
economic woes which President Trump had promised to address. Trade policies are widely
identified to directly affect voter’s decisions especially among the lower income working group
who may feel the effect of increased overseas competition. This paper aims to verify from the
political survey poll whether trade policies truly played the role of a driving the vote in favor of
Trump. The study hypothesized that income and financial worry arising out of the international
trade policy of the United States had a significant effect in swaying political support towards
Republicans and away from Democrats.
Discussion
Statement of Study
It is hypothesized that the gain in support of the Republicans was an impact of the
concerns of the lower income groups and the perception that existing trade policies were working
to hamper their livelihood. The study aims to verify this notion and identify any other factors
such as faith in Trump and ethnicity also had any impact on the political atmosphere.
Data Description
The study used a political survey poll data, published by the Pew Research Center in
April 2017. It was obtained from the Roper Center. The data of participants who are above the
Document Page
3APPLIED RESEARCH METHOD AND STATISTICS
age of 18 were used. The dataset used consisted of a set of 1234 observations. The data variables
extracted from the dataset were as follows: “Partysum” which referred to the party towards
which the respondent was more inclined from the day of survey and henceforth. The variable had
three levels, namely, leaning towards Republican, leaning towards Democrats and no Response
or preference. This variable was taken as the dependent variable and the level representing no
preference was taken to be the reference level.
The variable is clearly nominal and it is assumed that it follows a multinomial
distribution with each level having a particular probability of occurrence which the study tries to
capture or determine.
The independent variable considered in the study that are considered from the larger
dataset were income level which initially had nine categories, with minimum being the interval
less than $10,000 and greatest being greater than $150,000 and an extra category where the
respondent refused to disclose. The income level variable was then redefined and re-coded into
four groups, with those with less than $30,000 income per year as the lower income groups,
those greater than $75,000 as higher income, those in between as middle income and the group
which refused to disclose.
The ethnicity variable had five levels, namely, “White, non Hispanic”, “Black, non
Hispanic”, “Hispanic”, “other” and “Refused to answer”. The variable was re-coded as Black or
non-black. This was because the black ethnicity is stated to be among the lowest income groups
and also to check whether there may be some racial politics at play or not.
The study then considers a series of opinion based items. First, in variable Q71, it takes
into account whether the respondents “In general, do you think that free trade agreements
between the U.S. and other countries have been a good thing or a bad thing for the United
tabler-icon-diamond-filled.svg

Secure Best Marks with AI Grader

Need help grading? Try our AI Grader for instant feedback on your assignments.
Document Page
4APPLIED RESEARCH METHOD AND STATISTICS
States?”, the study only took into account those respondents who could give a definitive answer
with “bad thing” as response was taken as “1” and “Good thing” as “0”. Secondly, the variable
Q72, takes into account the respondent’s response to the question, “Thinking about the financial
situation of you and your family, Do you think free trade agreements have definitely helped,
probably helped, probably hurt, or definitely hurt the financial situation of you and your
family?”, with again “0” signifying “Bad thing” and “1” as “good thing” . The variable Q81,
constitutes of response to the question “Q.81 In your opinion, which generally has more to do
with why a person is rich?” or rather it was re-coded as “0” if they felt that hard-work is less
important, “1” if they felt only hard work mattered and “2” if they said that both mattered.
Finally the variable “Trump” derived from the variable Q1 of the original dataset has two level,
namely, “1” if they said they had faith in President Donald Trump and “0” otherwise. The data
can be referenced from Pew Research Center (2017).
Methodology
The dependent variable is categorical or dummy level with three levels and is assumed to
have multinomial distribution (k=3). Therefore the multinomial logistic regression was used to
fit a regression model to the data and analysis the significance and effects of the independent
variables. The analysis was carried out using SPSS using NOMREG (Park, 2015). A dummy
variable was first used to run linear regression on the data to check for the VIF values which
signify the multi-collinearity. The data was found to have VIF below 1.5 as shown in Results
section (Table 1) below. The data had no significant outliers or missing values.
Analysis and Results
The following table shows the variance inflation factor for independent variables taken
together in one model.
Document Page
5APPLIED RESEARCH METHOD AND STATISTICS
Coefficientsa
Model Collinearity
Statistics
Toleranc
e
VIF
1
ApprovesTrump .707 1.414
Incomegroup .988 1.012
Black .957 1.045
Q.81 In your opinion,
which generally has
more to do with why a
person is rich [READ
AND RANDOMIZE]?
.787 1.271
Q72 .682 1.467
Q.71 In general, do
you think that free
trade agreements
between the U.S. and
other countries have
been a good thing or a
bad thing for the United
States?
.634 1.577
a. Dependent Variable: Dummy
Table 1: Variance Inflation Factors
Document Page
6APPLIED RESEARCH METHOD AND STATISTICS
The variable Q71 or what the respondents think about impact of US trade policy in
general was found to have VIF greater than 1.5 and was thus discarded from consideration. Then
the remaining variables taken together all showed VIF well within the assumed threshold of 1.5
(Osborne, 2017). These were then used to run the logistic model.
Coefficientsa
Model Collinearity
Statistics
Toleranc
e
VIF
1
ApprovesTrump .744 1.344
Incomegroup .989 1.011
Black .958 1.043
Q.81 In your opinion,
which generally has
more to do with why a
person is rich [READ
AND RANDOMIZE]?
.787 1.271
Q72 .950 1.053
a. Dependent Variable: Dummy
Table 2: VIF of variables in final model
tabler-icon-diamond-filled.svg

Paraphrase This Document

Need a fresh take? Get an instant paraphrase of this document with our AI Paraphraser
Document Page
7APPLIED RESEARCH METHOD AND STATISTICS
The respondents were 51.5% Democrat leaning, 42.5% as Republican leaning and 5.9%
refused to answer or said they had no preference.
Case Processing Summary
N Marginal Percentage
Partysum
Dem/lean D 636 51.5%
DK/Ref-no 73 5.9%
Rep/lean R 525 42.5%
Valid 1234 100.0%
Missing 0
Total 1234
Subpopulation 95a
Table 3: Case Summaries of Party leanings (Dependent Variable)
The goodness of fit statistics of the model using the dependent and independent variables
as discussed in the data section are given in the following table (George & Mallery, 2016):
Pseudo R-Square
Cox and Snell .504
Nagelkerke .610
McFadden .402
Table 4: Goodness of Fit of the Model
Document Page
8APPLIED RESEARCH METHOD AND STATISTICS
The Cox-Snell Residual shows that the model fails to capture about 50 percent of the
variation. Nagelkerke measure suggests that 61 percent of the variation remains unexplained and
McFadden however suggests that about 59.8 percent of the variation is accounted for in the
model (Long, 2014). The factors influencing party loyalty most certainly rely on multitudinous
factors that have not been taken into account. Nonetheless, the results of the likelihood ration test
shows that the variables considered significantly improve the proportion of explained variation
as compared to the intercept model (at 0.1 percent level of significance).
Model Fitting Information
Model Model Fitting
Criteria
Likelihood Ratio Tests
-2 Log
Likelihood
Chi-
Square
df Sig.
Intercept
Only
1162.224
Final 297.384 864.840 10 .000
Table 5: Overall Model Fit
The overall effect of the variables in the model revealed that approval of trump, annual
family income, opinion on how trade policy affected their family, opinion on how hard work
affects accumulation of wealth, ethnicity have statistically significant effect on their party
preference.( alpha= 0.5 percent)
Likelihood Ratio Tests
Document Page
9APPLIED RESEARCH METHOD AND STATISTICS
Effect Model Fitting
Criteria
Likelihood Ratio Tests
-2 Log
Likelihood of
Reduced
Model
Chi-Square df Sig.
Intercept 353.309 55.925 2 .000
ApprovesTrum
p
789.210 491.826 2 .000
Incomegroup 305.026 7.642 2 .022
Black 321.564 24.180 2 .000
Q81 335.781 38.397 2 .000
Q72 305.637 8.253 2 .016
The chi-square statistic is the difference in -2 log-likelihoods
between the final model and a reduced model. The reduced
model is formed by omitting an effect from the final model.
The null hypothesis is that all parameters of that effect are 0.
Table 6: Likelihood for individual covariate effects
Since the dependent variable has three categorical levels, two sets of model parameter
estimates are obtained, one for Democrats and the other for Republicans (Miller, 2017). The No
party preference level was taken to be the reference group. The variable ApprovesTrump was
statistically significant had the strongest effect on both sets with a negative effect as its
tabler-icon-diamond-filled.svg

Secure Best Marks with AI Grader

Need help grading? Try our AI Grader for instant feedback on your assignments.
Document Page
10APPLIED RESEARCH METHOD AND STATISTICS
exponential has the value 0.27 suggesting that odds of a person to be a democrat if he or she
approve of Donald Trump is 0.3 and for the second model for Republicans odds is 11.3 that one
is republican if he or she supports the man. Income was significant for democrats with a higher
income group having odds 1.4 to be a democrat however it was not significant for the republican
model. Support for trade policy was a significant predictor for the democrat model with a person
finding trade policy as helpful having odds of 1.7 to be democrat. This variable was not
significant for the republican model however. The respondent being black was found to be
statistically significant for the republican model with odds being about 0.3 that he or she is
Republican. Another behavioural trait significant is whether they feel hard work can actually get
them financial success with a person believing in it positively having 2.3 odds of being
republican (Meyers, Gamst & Guarino, 2016).The results are given in the following table.
Parameter Estimates
Partysuma B Std.
Error
Wald df Sig. Exp(B) 95% Confidence
Interval for Exp(B)
Lower
Bound
Upper
Bound
Dem/lean
D
Intercept 1.446 .323 20.039 1 .000
ApprovesTrump
-
1.309
.319 16.850 1 .000 .270 .145 .505
Incomegroup .349 .128 7.429 1 .006 1.418 1.103 1.823
Black .459 .378 1.474 1 .225 1.583 .754 3.320
Q81 -.333 .262 1.613 1 .204 .717 .429 1.198
Document Page
11APPLIED RESEARCH METHOD AND STATISTICS
Q72 .568 .256 4.916 1 .027 1.765 1.068 2.916
Rep/lean
R
Intercept -.346 .364 .902 1 .342
ApprovesTrump 2.425 .306 62.869 1 .000 11.298 6.205 20.573
Incomegroup .222 .139 2.548 1 .110 1.248 .951 1.638
Black
-
1.210
.485 6.217 1 .013 .298 .115 .772
Q81 .843 .283 8.892 1 .003 2.324 1.335 4.046
Q72 .142 .281 .257 1 .612 1.153 .665 1.998
a. The reference category is: DK/Ref-no.
Table 7: Parameter Estimates of Final Model
Conclusion
The study implies that although the issue with trade policy is not significant for garnering
votes for republicans but it surely is significant in depriving the democrats of support. A lower
income group is less likely to vote for democrats while a person of black community is less
likely to vote for the republicans. Donald Trump stands out as the single most influential factor
among the covariates with strong impact on both groups of party support. Conclusively, although
a person’s dissatisfaction with trade policy and financial status does not seem to explain loyalty
to republicans but it most certainly affects democrats in a negative light which perhaps led to
their downfall.
Document Page
12APPLIED RESEARCH METHOD AND STATISTICS
Reference:
George, D., & Mallery, P. (2016). IBM SPSS statistics 23 step by step: A simple guide and
reference. Routledge.
Long, J. S. (2014). Regression models for nominal and ordinal outcomes. The SAGE handbook of
regression analysis and causal inference, 173-204.
Meyers, L. S., Gamst, G., & Guarino, A. J. (2016). Applied multivariate research: Design and
interpretation. Sage publications.
Miller, R. L. (2017). SPSS for social scientists. Macmillan International Higher Education.
Osborne, J. W. (2017). Regression & Linear Modeling.
Park, H. M. (2015). Regression models for ordinal and nominal dependent variables using SAS,
Stata, LIMDEP, and SPSS.
Pew Research Center (2017). Pew Research Center: April 2017 Political Survey, Apr, 2017
[dataset]. 31114967, Version 2. Princeton Survey Research Associates International
[producer]. Cornell University, Ithaca, NY: Roper Center for Public Opinion Research,
Roper Express [distributor], accessed Jul-13-2018.
chevron_up_icon
1 out of 13
circle_padding
hide_on_mobile
zoom_out_icon
logo.png

Your All-in-One AI-Powered Toolkit for Academic Success.

Available 24*7 on WhatsApp / Email

[object Object]