Economics for Business: An Analysis of Polo Mint's Market Dynamics
VerifiedAdded on 2020/10/22
|11
|3129
|413
Report
AI Summary
This report analyzes the business economics of Polo Mint, a peppermint product manufacturer based in the UK. It delves into the application of microeconomic principles, particularly supply and demand, to understand market operations and pricing strategies. The report examines how the law of demand and supply influence pricing decisions, considering factors such as consumer behavior, cost of production, and market equilibrium. It discusses the impact of various economic factors, including price of substitute goods and consumer preferences, on the demand and supply curves. The analysis includes graphical representations of equilibrium points and the interplay between supply and demand, emphasizing how these concepts help businesses determine resource allocation and maximize profitability. The report highlights the importance of understanding market dynamics for setting prices and achieving business goals, particularly for companies like Polo Mint.

Economics For Business
Paraphrase This Document
Need a fresh take? Get an instant paraphrase of this document with our AI Paraphraser
Table of Contents
INTRODUCTION...........................................................................................................................1
MAIN BODY...................................................................................................................................1
CONCLUSION ...............................................................................................................................8
REFERENCE ..................................................................................................................................9
INTRODUCTION
In business term, the economic of business is also know as managerial economic that
ease the process of decision making of choosing the best alternatives from the available option
that further help to increase the level of profitability (Assous, Bruno and Legrand, 2014). In
general, it is a stream of applied economic that focuses on the organisational, financial,
environmental problems that are mainly faced by corporations. In this project to better
understand the theories of economic for a business polo mint has been selected. Respective
company use to manufacture peppermint product for Breath Mint and has it headquarter in
London, UK.
In this project report, analysis of supply and demand to determine and understand the
operation of market, identify of various important factors that help company to set the price of
different product has been discussed.
MAIN BODY
In today's business environment, economic is the entire examine of manufacture,
distribution and consumption of useful product and services as per the consideration of people
living in that particular economy. Further it can be separated into two major category of study
that is microeconomics that deals with decision making and market of a business firm or
customer and macroeconomics which shows the aggregate quantity of a particular economy such
as national income and overall national production. Thus it is the responsibility of the managerial
of a firm to better determine the changes in economy that make meaningful decision.
Comparative statics help large and small companies to determine the various sort of economy
and the sudden changes that are happen at a specific period of time. This statics support to
compare equilibrium of demand and supply on the dependence of a valid figures and structure as
it will deliver more authentic and appropriate result for the actual changes in overall supply and
demand of Polo Mint. Demand & supply of product are mainly depended upon types of market
company operate and nature of business. There are mainly two type of market such as factor
market that is related to the purchase and sales of commodity produced by a company and good
market that is linked with complete production of particular commodity (Azevedo and Leshno,
2016).
1
⊘ This is a preview!⊘
Do you want full access?
Subscribe today to unlock all pages.
Trusted by 1+ million students worldwide
In economic term demand is the actual will of an individual and their ability to buy a
particular amount of good or services in order to fulfil their needs and desire at a specific price.
On the other side supply is the desire of seller to provide a specific quantity of product and
services to a wide range of customer on an agreed price in order to maintain a sufficient profit. It
has been observed that with the support of demand and supply model exact price and quantity
listed are ascertained and the exterior influences impact the values of those variables. The
demand curve capture the consumer behaviour in the demand function which displays the
highest price customer are desired to pay for every quantity. This curve also shows the highest
quantity of particular product customer is willing to buy at every price. Similarly the supply
curve is used to capture the merchant behaviour within supply function that shows the lowest
price distributor are desired to accept for all product and the maximum quantity which a seller
are willing to offer different customer at all prices (Bohi, 2013). For illustration, demand for
Mint product in a specific market is 70 pcs and overall supply are equal a particular time frame.
In case, if price product is £5 and actual quantity for demand increased by 10 pcs and supply
remain unchanged. Due to this change the price Mint product will increased by £1 and changes
to £6. Basically the comparability between the two situation price is commonly known as
relation economics statics. That relate the comparative analysis of fresh equilibrium element with
the primary one and it will occur because of few variable changes in the enterprise working
situations.
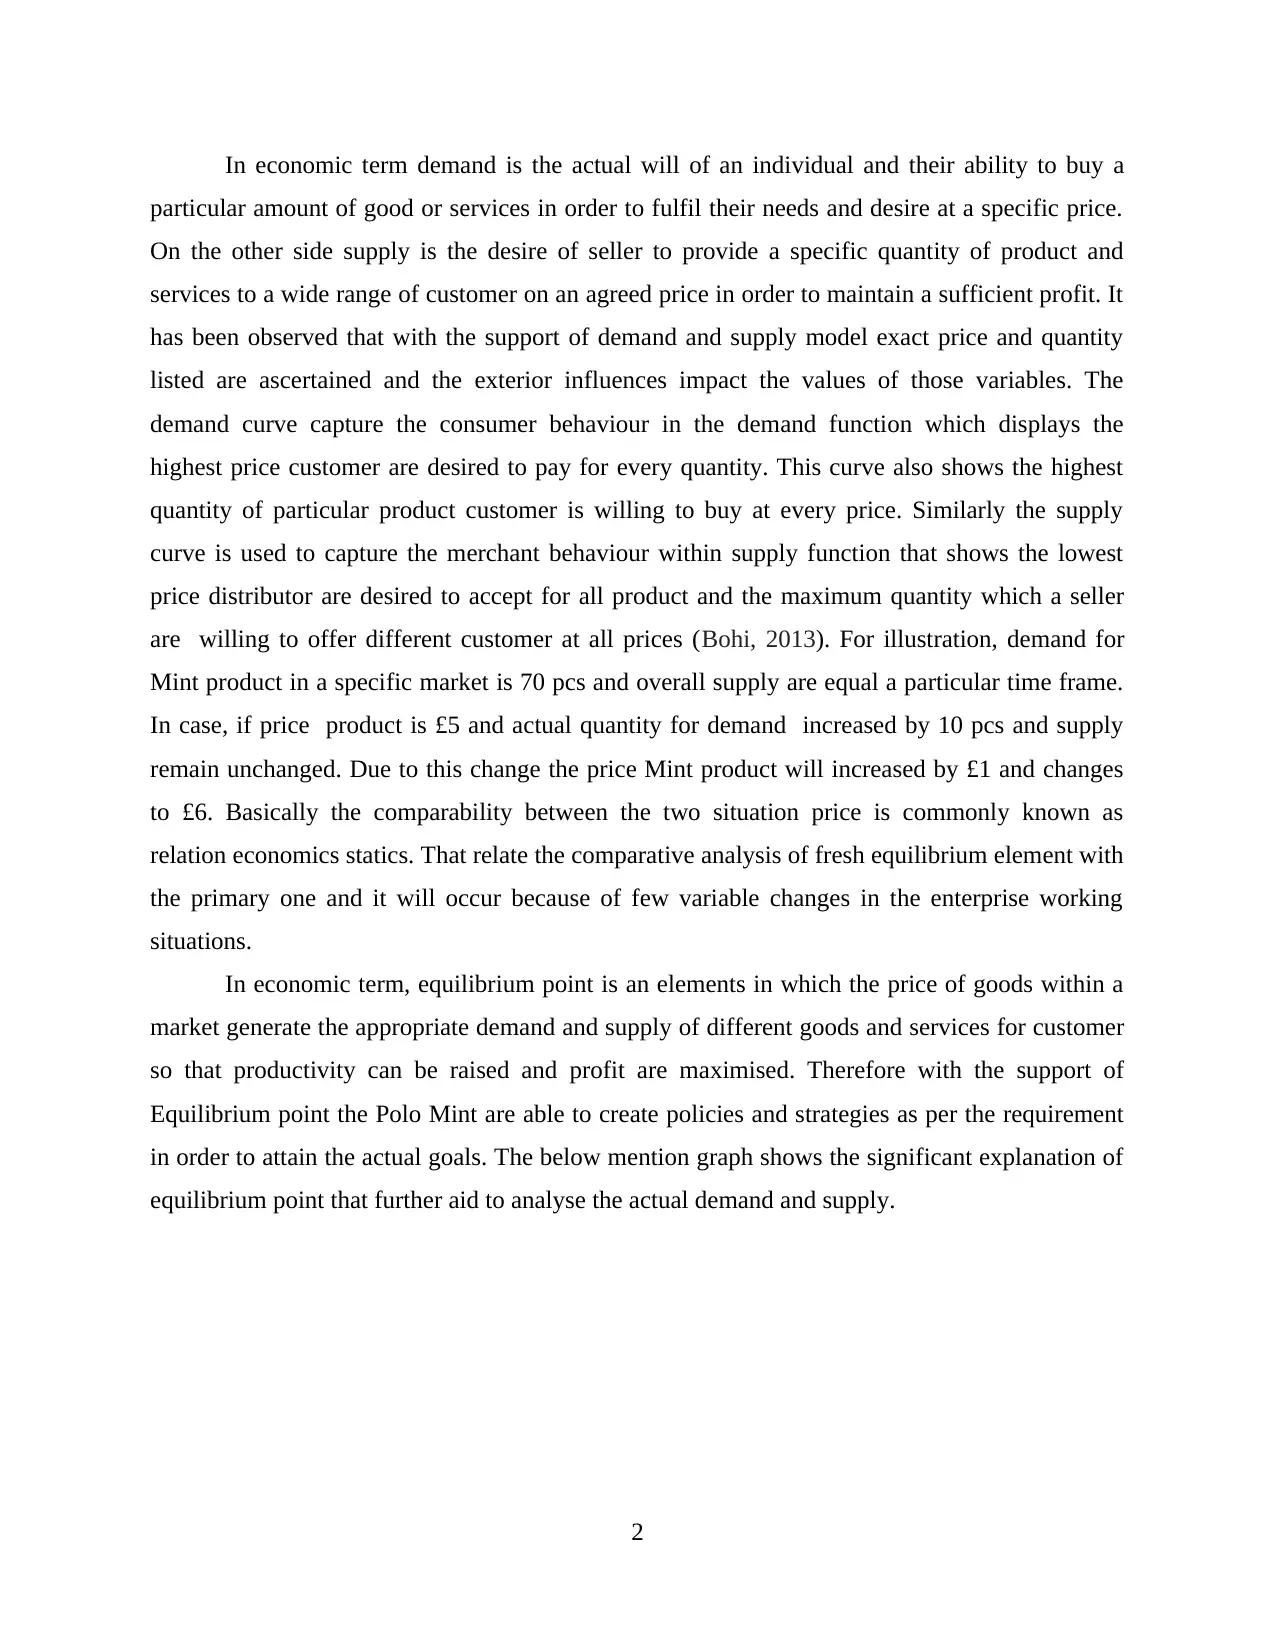
In economic term, equilibrium point is an elements in which the price of goods within a
market generate the appropriate demand and supply of different goods and services for customer
so that productivity can be raised and profit are maximised. Therefore with the support of
Equilibrium point the Polo Mint are able to create policies and strategies as per the requirement
in order to attain the actual goals. The below mention graph shows the significant explanation of
equilibrium point that further aid to analyse the actual demand and supply.
2
particular amount of good or services in order to fulfil their needs and desire at a specific price.
On the other side supply is the desire of seller to provide a specific quantity of product and
services to a wide range of customer on an agreed price in order to maintain a sufficient profit. It
has been observed that with the support of demand and supply model exact price and quantity
listed are ascertained and the exterior influences impact the values of those variables. The
demand curve capture the consumer behaviour in the demand function which displays the
highest price customer are desired to pay for every quantity. This curve also shows the highest
quantity of particular product customer is willing to buy at every price. Similarly the supply
curve is used to capture the merchant behaviour within supply function that shows the lowest
price distributor are desired to accept for all product and the maximum quantity which a seller
are willing to offer different customer at all prices (Bohi, 2013). For illustration, demand for
Mint product in a specific market is 70 pcs and overall supply are equal a particular time frame.
In case, if price product is £5 and actual quantity for demand increased by 10 pcs and supply
remain unchanged. Due to this change the price Mint product will increased by £1 and changes
to £6. Basically the comparability between the two situation price is commonly known as
relation economics statics. That relate the comparative analysis of fresh equilibrium element with
the primary one and it will occur because of few variable changes in the enterprise working
situations.
In economic term, equilibrium point is an elements in which the price of goods within a
market generate the appropriate demand and supply of different goods and services for customer
so that productivity can be raised and profit are maximised. Therefore with the support of
Equilibrium point the Polo Mint are able to create policies and strategies as per the requirement
in order to attain the actual goals. The below mention graph shows the significant explanation of
equilibrium point that further aid to analyse the actual demand and supply.
2
Paraphrase This Document
Need a fresh take? Get an instant paraphrase of this document with our AI Paraphraser
From the above graph it can be clearly sheen that there is a shift equilibrium point for E
to E1 and this is because the sudden changes in the quantity demand by 10 pcs. The figure shows
demand curve shift in the right direction form D to D1 because of increase in demand due to this
equilibrium point also shows fluctuation and it will impact the price of product. Thus it can be
stated that application of Law of demand and Law of supply within Polo Mint support to
determine the resources available for production. It is very common that supply & demand of
company product by a single person will defiantly impact the overall business. Apart these
variable there are some other factors also which could impact the profitability and performance
of company in market. It mainly involves cost of production, taste and preference of customer
that will shift the complete demand curve from one point to right-side (Heakal, 2015). One of the
biggest ground of modification in supply curve as well as demand curve is complete price of
product, aggregate income, future demand, preference, complementary and substitute product.
These element will impact the demand of product in Polo Mint and it will further shift the curve.
Demand and supply are the most essential concept of economic that are consider to be the basic
ground which support company to ascertain the actual quantity demand by customer and total
supply in relevant market. Thus it is observed that demand prices of product manufacture by
respective company will be fix as per the customer demand and their willingness to pay for that
product. Supply will actually represent the goods that are offered in a subsequent market to
supplier at a specific time frame. So supply and demand theories are helpful in distributing
resources and make them use in most significant and suitable manner for the betterment of total
productivity. In order to gain the suitable prices of goods law of demand and supply are
discussed.
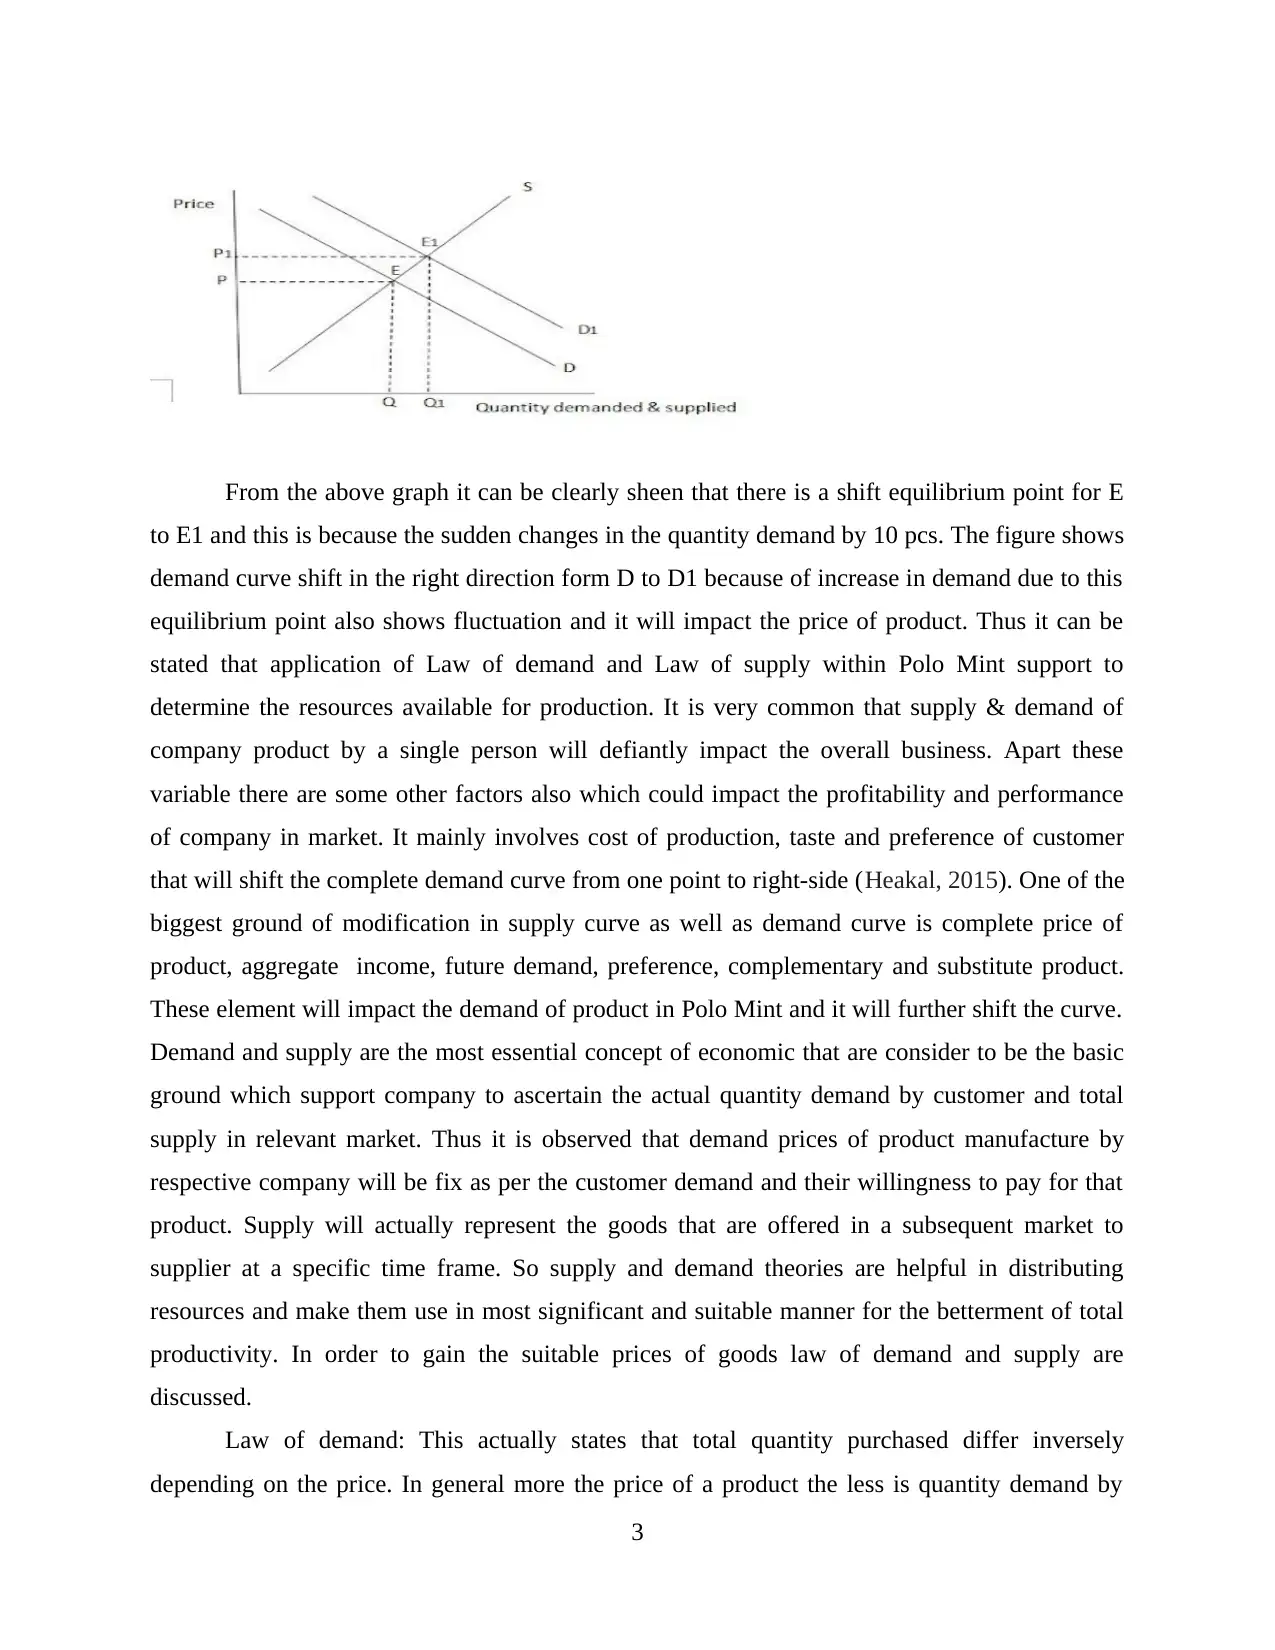
Law of demand: This actually states that total quantity purchased differ inversely
depending on the price. In general more the price of a product the less is quantity demand by
3
to E1 and this is because the sudden changes in the quantity demand by 10 pcs. The figure shows
demand curve shift in the right direction form D to D1 because of increase in demand due to this
equilibrium point also shows fluctuation and it will impact the price of product. Thus it can be
stated that application of Law of demand and Law of supply within Polo Mint support to
determine the resources available for production. It is very common that supply & demand of
company product by a single person will defiantly impact the overall business. Apart these
variable there are some other factors also which could impact the profitability and performance
of company in market. It mainly involves cost of production, taste and preference of customer
that will shift the complete demand curve from one point to right-side (Heakal, 2015). One of the
biggest ground of modification in supply curve as well as demand curve is complete price of
product, aggregate income, future demand, preference, complementary and substitute product.
These element will impact the demand of product in Polo Mint and it will further shift the curve.
Demand and supply are the most essential concept of economic that are consider to be the basic
ground which support company to ascertain the actual quantity demand by customer and total
supply in relevant market. Thus it is observed that demand prices of product manufacture by
respective company will be fix as per the customer demand and their willingness to pay for that
product. Supply will actually represent the goods that are offered in a subsequent market to
supplier at a specific time frame. So supply and demand theories are helpful in distributing
resources and make them use in most significant and suitable manner for the betterment of total
productivity. In order to gain the suitable prices of goods law of demand and supply are
discussed.
Law of demand: This actually states that total quantity purchased differ inversely
depending on the price. In general more the price of a product the less is quantity demand by
3
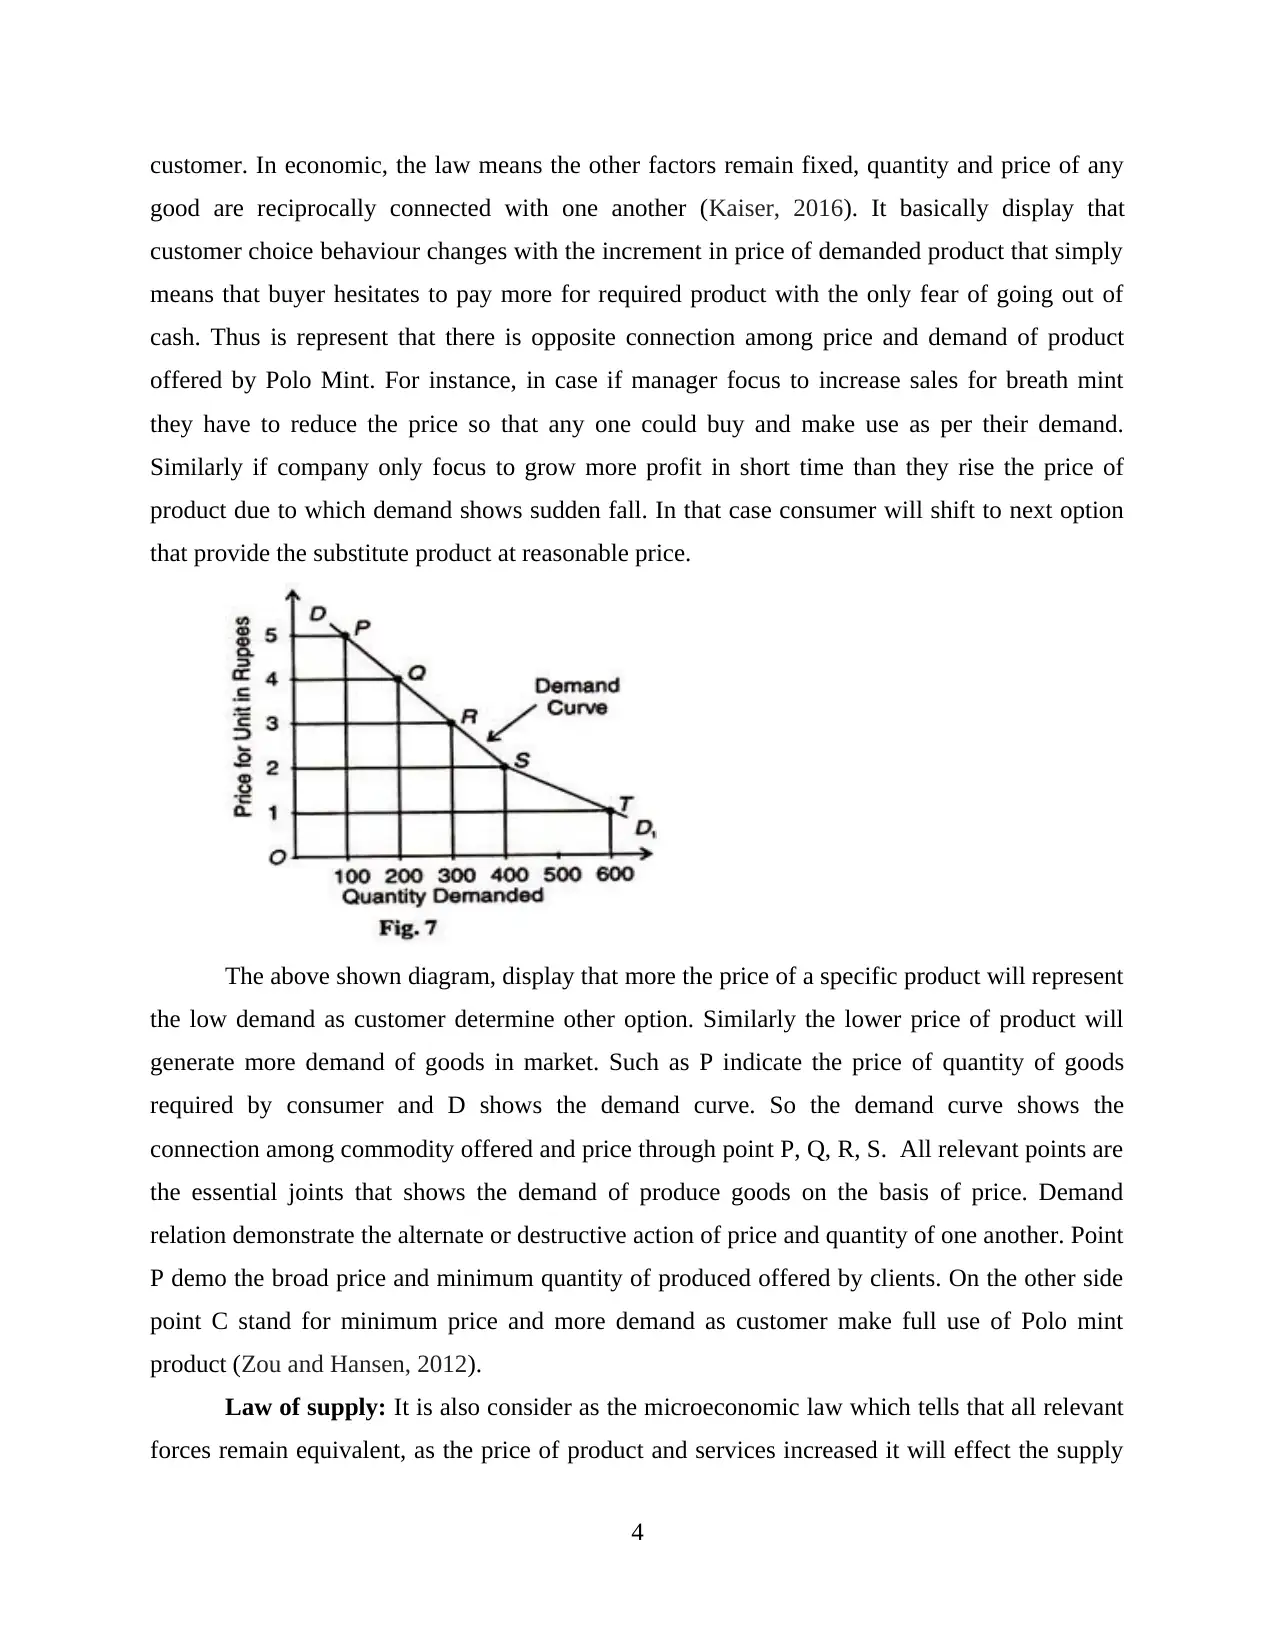
customer. In economic, the law means the other factors remain fixed, quantity and price of any
good are reciprocally connected with one another (Kaiser, 2016). It basically display that
customer choice behaviour changes with the increment in price of demanded product that simply
means that buyer hesitates to pay more for required product with the only fear of going out of
cash. Thus is represent that there is opposite connection among price and demand of product
offered by Polo Mint. For instance, in case if manager focus to increase sales for breath mint
they have to reduce the price so that any one could buy and make use as per their demand.
Similarly if company only focus to grow more profit in short time than they rise the price of
product due to which demand shows sudden fall. In that case consumer will shift to next option
that provide the substitute product at reasonable price.
The above shown diagram, display that more the price of a specific product will represent
the low demand as customer determine other option. Similarly the lower price of product will
generate more demand of goods in market. Such as P indicate the price of quantity of goods
required by consumer and D shows the demand curve. So the demand curve shows the
connection among commodity offered and price through point P, Q, R, S. All relevant points are
the essential joints that shows the demand of produce goods on the basis of price. Demand
relation demonstrate the alternate or destructive action of price and quantity of one another. Point
P demo the broad price and minimum quantity of produced offered by clients. On the other side
point C stand for minimum price and more demand as customer make full use of Polo mint
product (Zou and Hansen, 2012).
Law of supply: It is also consider as the microeconomic law which tells that all relevant
forces remain equivalent, as the price of product and services increased it will effect the supply
4
⊘ This is a preview!⊘
Do you want full access?
Subscribe today to unlock all pages.
Trusted by 1+ million students worldwide
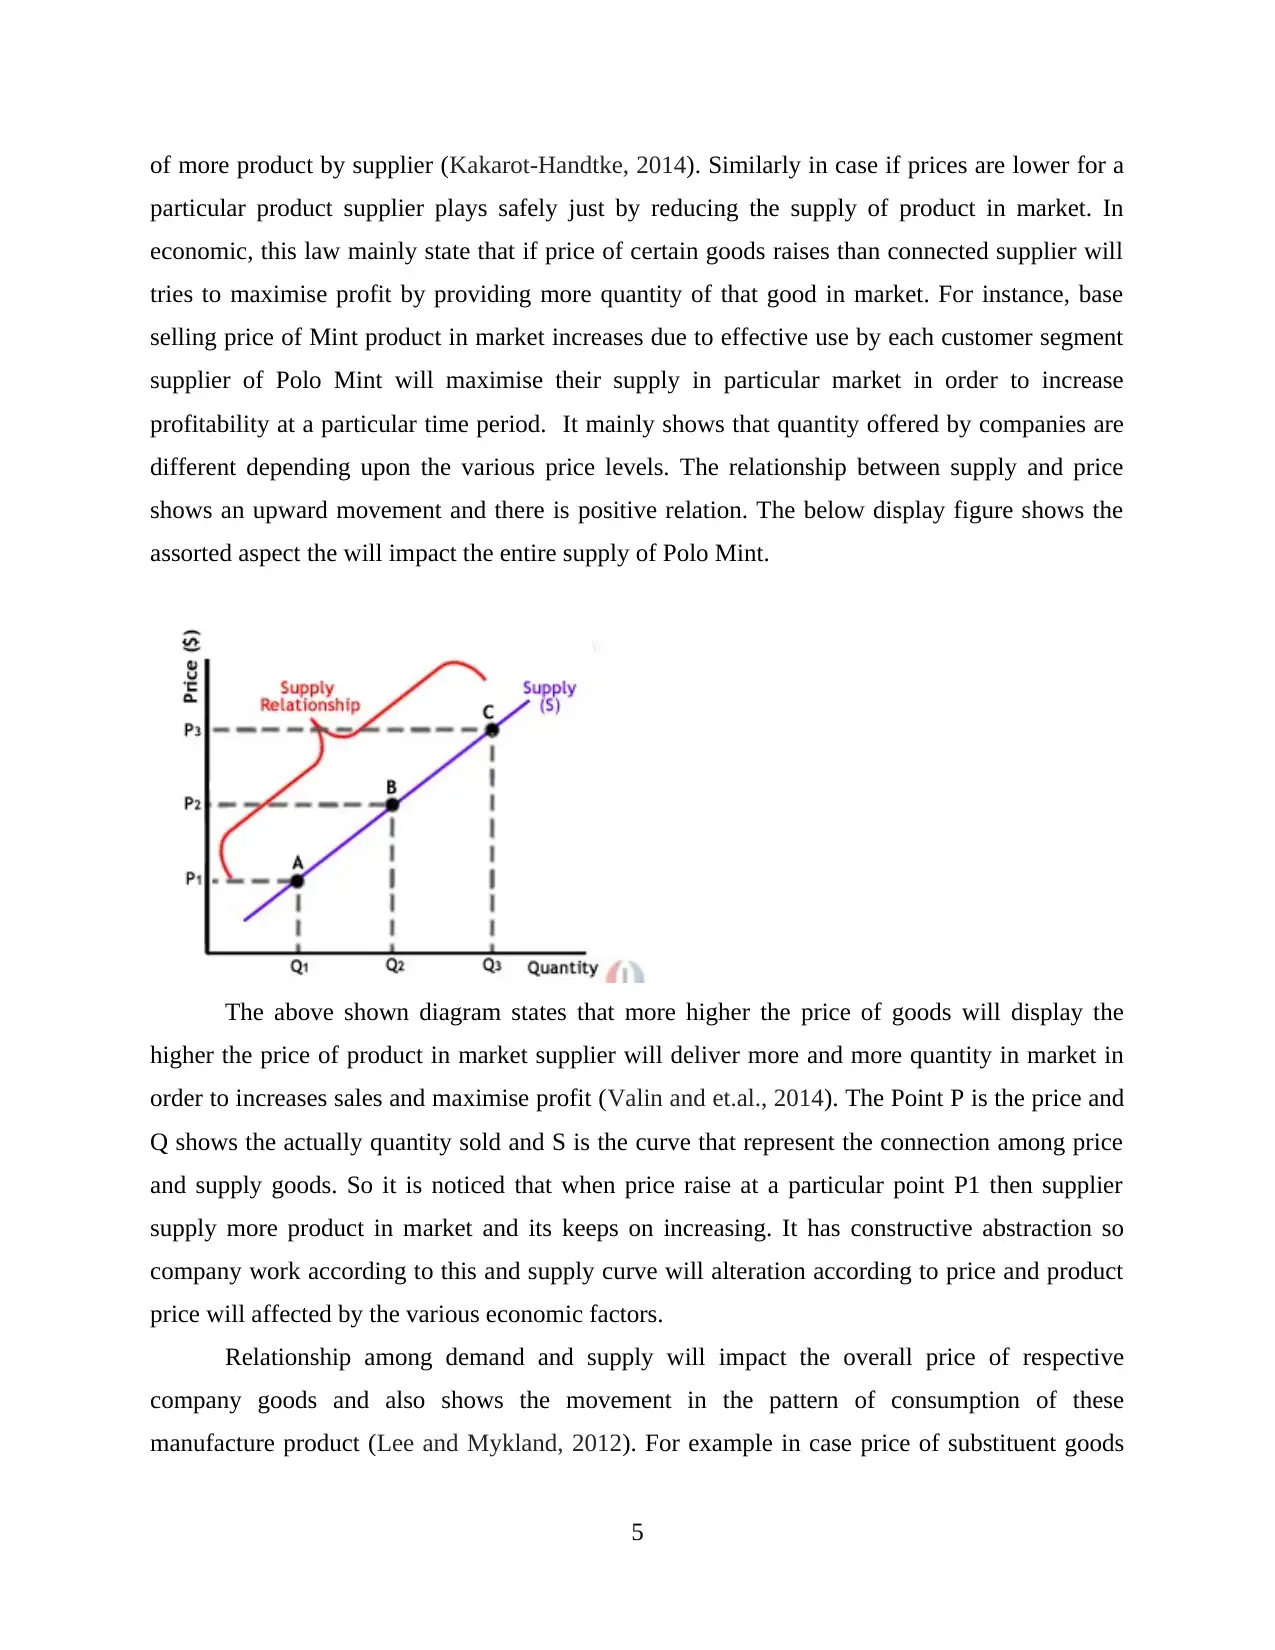
of more product by supplier (Kakarot-Handtke, 2014). Similarly in case if prices are lower for a
particular product supplier plays safely just by reducing the supply of product in market. In
economic, this law mainly state that if price of certain goods raises than connected supplier will
tries to maximise profit by providing more quantity of that good in market. For instance, base
selling price of Mint product in market increases due to effective use by each customer segment
supplier of Polo Mint will maximise their supply in particular market in order to increase
profitability at a particular time period. It mainly shows that quantity offered by companies are
different depending upon the various price levels. The relationship between supply and price
shows an upward movement and there is positive relation. The below display figure shows the
assorted aspect the will impact the entire supply of Polo Mint.
The above shown diagram states that more higher the price of goods will display the
higher the price of product in market supplier will deliver more and more quantity in market in
order to increases sales and maximise profit (Valin and et.al., 2014). The Point P is the price and
Q shows the actually quantity sold and S is the curve that represent the connection among price
and supply goods. So it is noticed that when price raise at a particular point P1 then supplier
supply more product in market and its keeps on increasing. It has constructive abstraction so
company work according to this and supply curve will alteration according to price and product
price will affected by the various economic factors.
Relationship among demand and supply will impact the overall price of respective
company goods and also shows the movement in the pattern of consumption of these
manufacture product (Lee and Mykland, 2012). For example in case price of substituent goods
5
Paraphrase This Document
Need a fresh take? Get an instant paraphrase of this document with our AI Paraphraser
rise that overall demand for Mint product produced by Polo Mint will automatically increased.
Thus it is stated that price of goods of company will impact the entire demand and help to
increase sales and make as much as profit in a specific time frame. It will also shows that with
the increase in price of product supplier will supply more and more product in market.
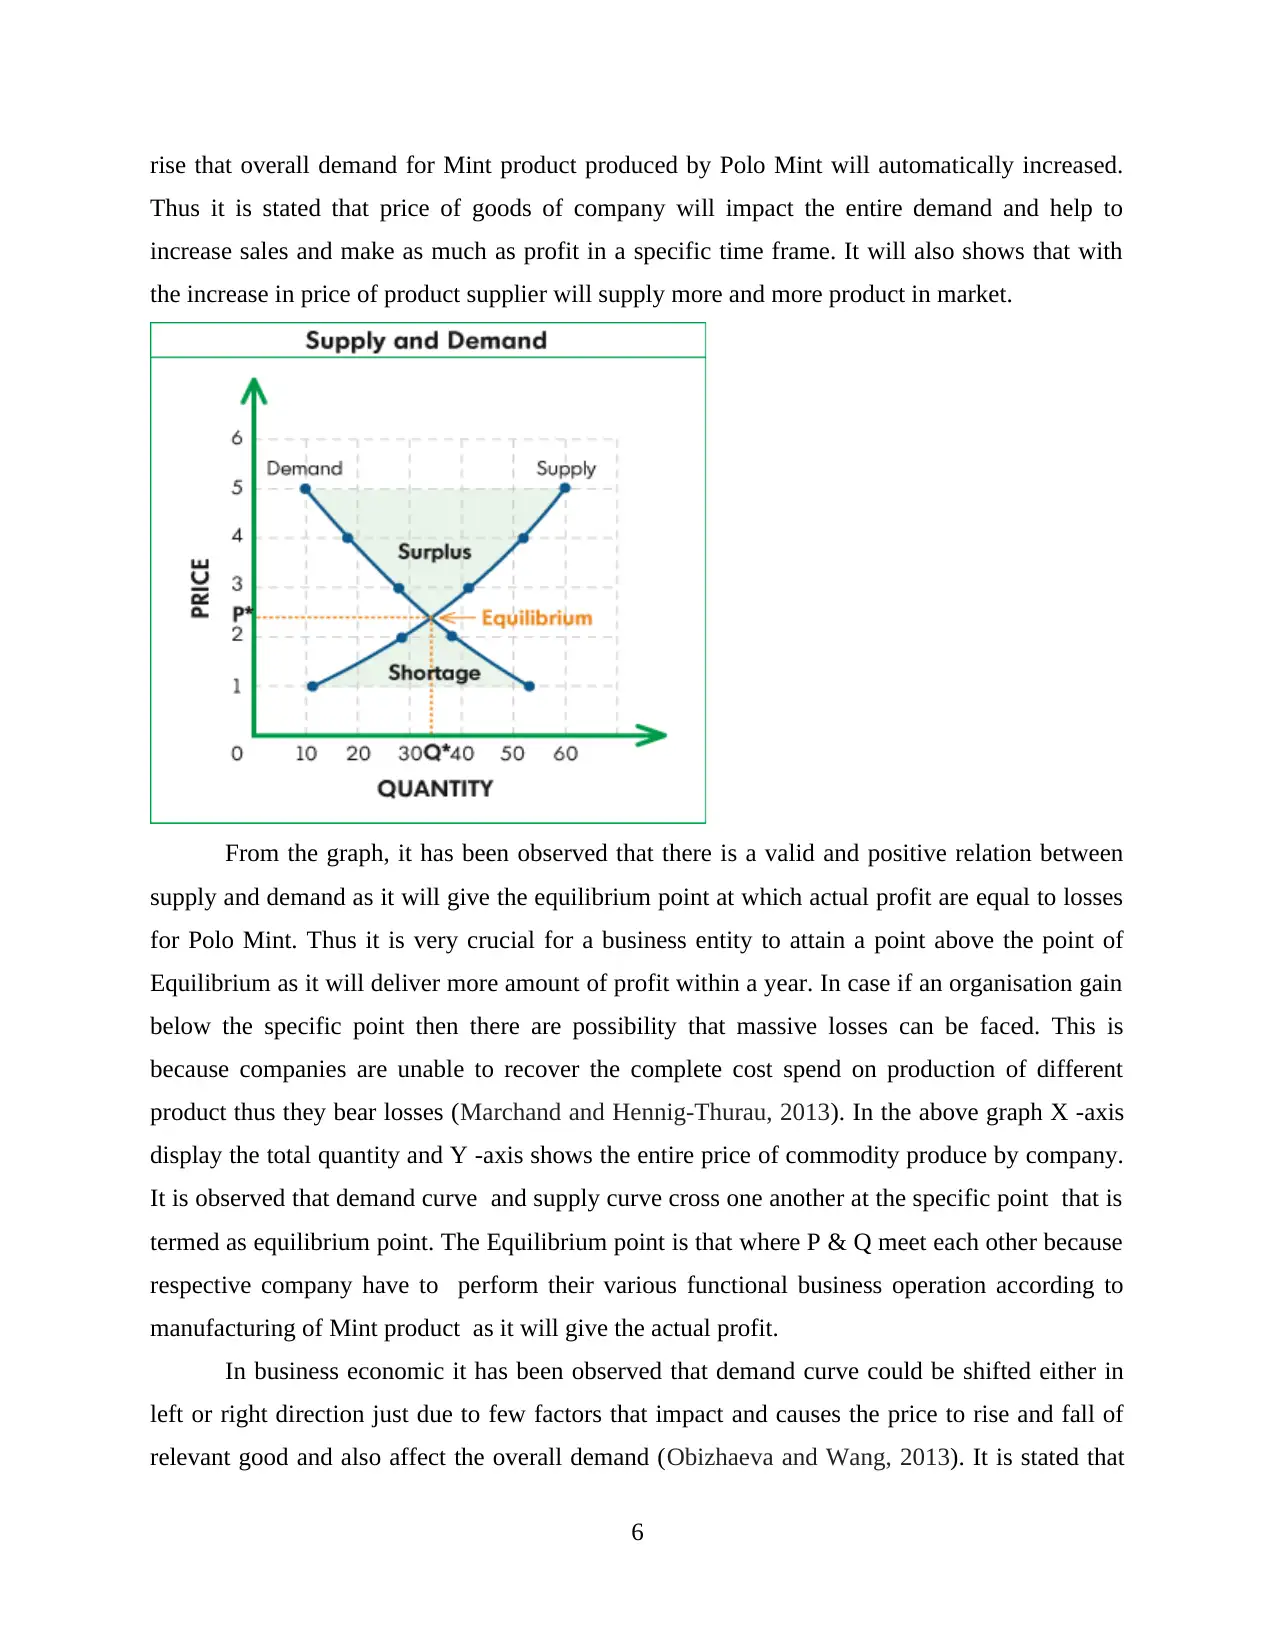
From the graph, it has been observed that there is a valid and positive relation between
supply and demand as it will give the equilibrium point at which actual profit are equal to losses
for Polo Mint. Thus it is very crucial for a business entity to attain a point above the point of
Equilibrium as it will deliver more amount of profit within a year. In case if an organisation gain
below the specific point then there are possibility that massive losses can be faced. This is
because companies are unable to recover the complete cost spend on production of different
product thus they bear losses (Marchand and Hennig-Thurau, 2013). In the above graph X -axis
display the total quantity and Y -axis shows the entire price of commodity produce by company.
It is observed that demand curve and supply curve cross one another at the specific point that is
termed as equilibrium point. The Equilibrium point is that where P & Q meet each other because
respective company have to perform their various functional business operation according to
manufacturing of Mint product as it will give the actual profit.
In business economic it has been observed that demand curve could be shifted either in
left or right direction just due to few factors that impact and causes the price to rise and fall of
relevant good and also affect the overall demand (Obizhaeva and Wang, 2013). It is stated that
6
Thus it is stated that price of goods of company will impact the entire demand and help to
increase sales and make as much as profit in a specific time frame. It will also shows that with
the increase in price of product supplier will supply more and more product in market.
From the graph, it has been observed that there is a valid and positive relation between
supply and demand as it will give the equilibrium point at which actual profit are equal to losses
for Polo Mint. Thus it is very crucial for a business entity to attain a point above the point of
Equilibrium as it will deliver more amount of profit within a year. In case if an organisation gain
below the specific point then there are possibility that massive losses can be faced. This is
because companies are unable to recover the complete cost spend on production of different
product thus they bear losses (Marchand and Hennig-Thurau, 2013). In the above graph X -axis
display the total quantity and Y -axis shows the entire price of commodity produce by company.
It is observed that demand curve and supply curve cross one another at the specific point that is
termed as equilibrium point. The Equilibrium point is that where P & Q meet each other because
respective company have to perform their various functional business operation according to
manufacturing of Mint product as it will give the actual profit.
In business economic it has been observed that demand curve could be shifted either in
left or right direction just due to few factors that impact and causes the price to rise and fall of
relevant good and also affect the overall demand (Obizhaeva and Wang, 2013). It is stated that
6
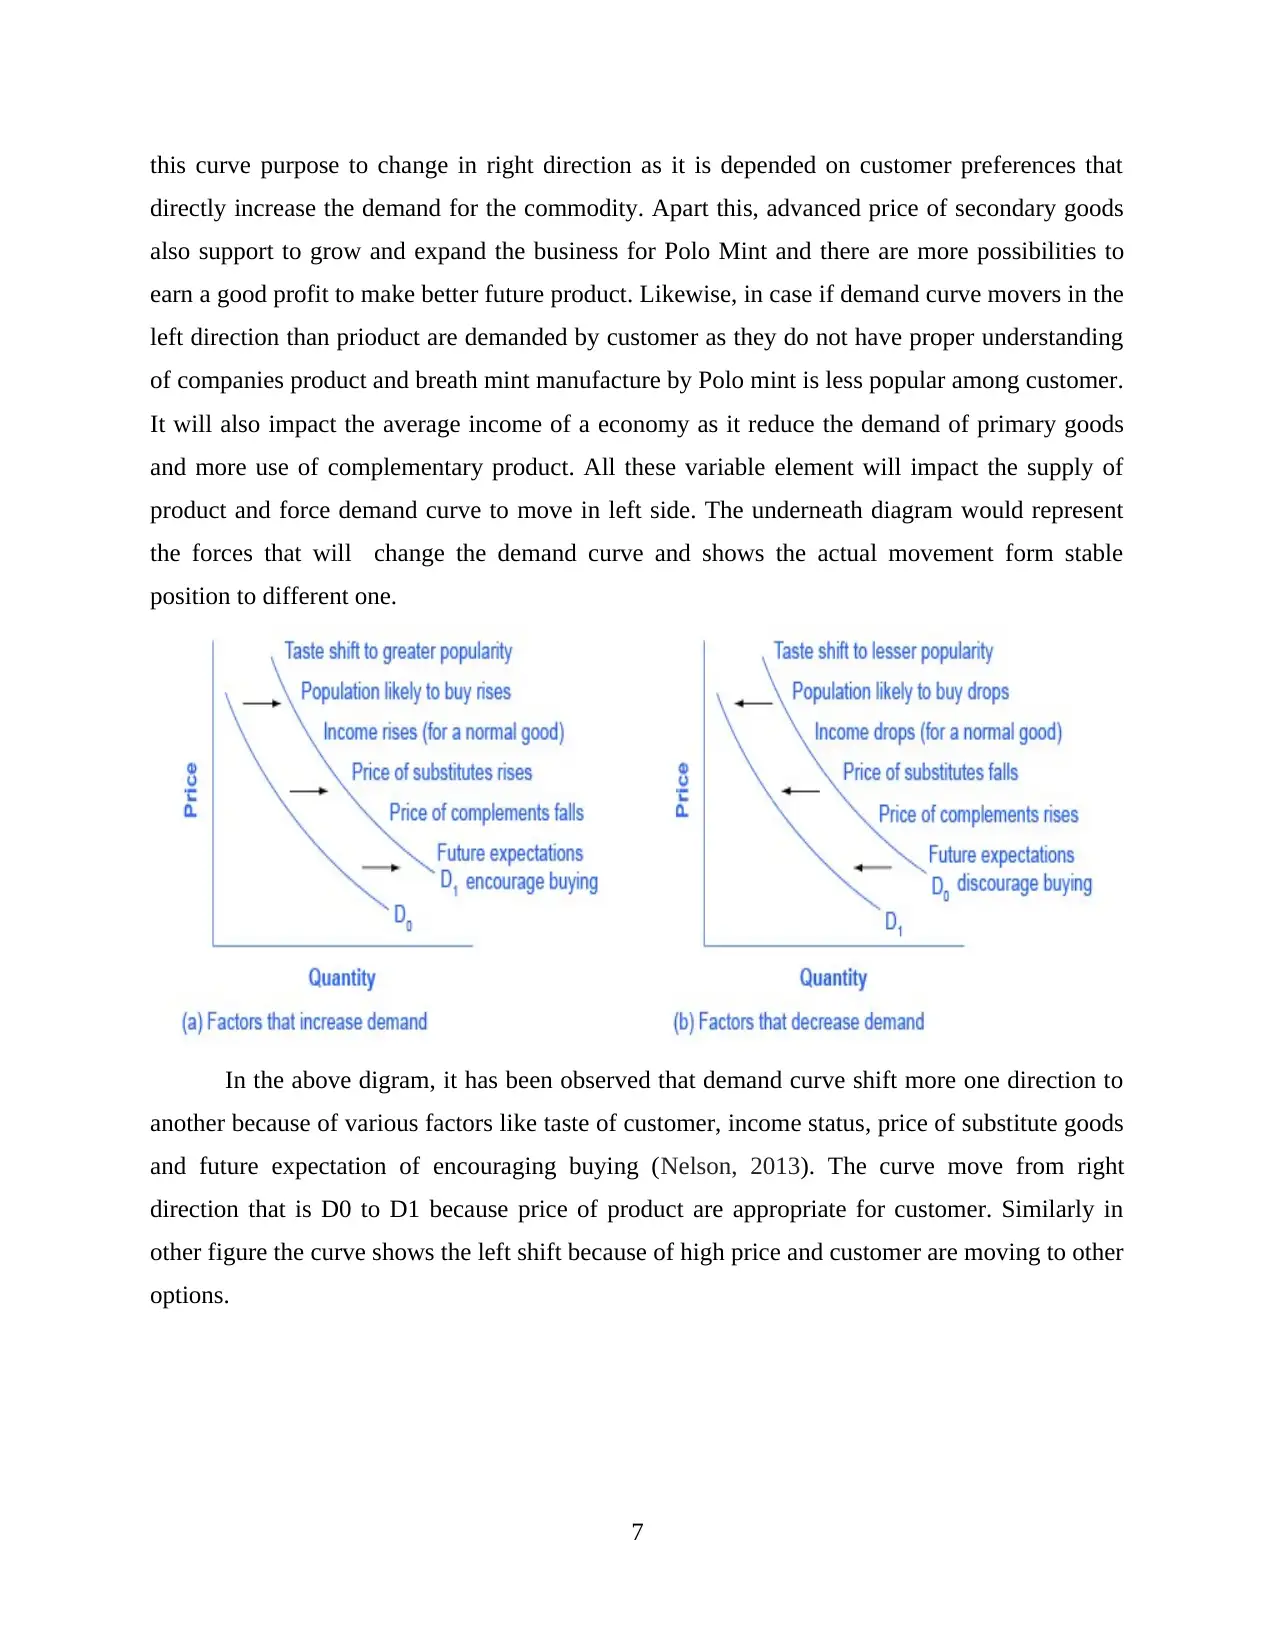
this curve purpose to change in right direction as it is depended on customer preferences that
directly increase the demand for the commodity. Apart this, advanced price of secondary goods
also support to grow and expand the business for Polo Mint and there are more possibilities to
earn a good profit to make better future product. Likewise, in case if demand curve movers in the
left direction than prioduct are demanded by customer as they do not have proper understanding
of companies product and breath mint manufacture by Polo mint is less popular among customer.
It will also impact the average income of a economy as it reduce the demand of primary goods
and more use of complementary product. All these variable element will impact the supply of
product and force demand curve to move in left side. The underneath diagram would represent
the forces that will change the demand curve and shows the actual movement form stable
position to different one.
In the above digram, it has been observed that demand curve shift more one direction to
another because of various factors like taste of customer, income status, price of substitute goods
and future expectation of encouraging buying (Nelson, 2013). The curve move from right
direction that is D0 to D1 because price of product are appropriate for customer. Similarly in
other figure the curve shows the left shift because of high price and customer are moving to other
options.
7
⊘ This is a preview!⊘
Do you want full access?
Subscribe today to unlock all pages.
Trusted by 1+ million students worldwide
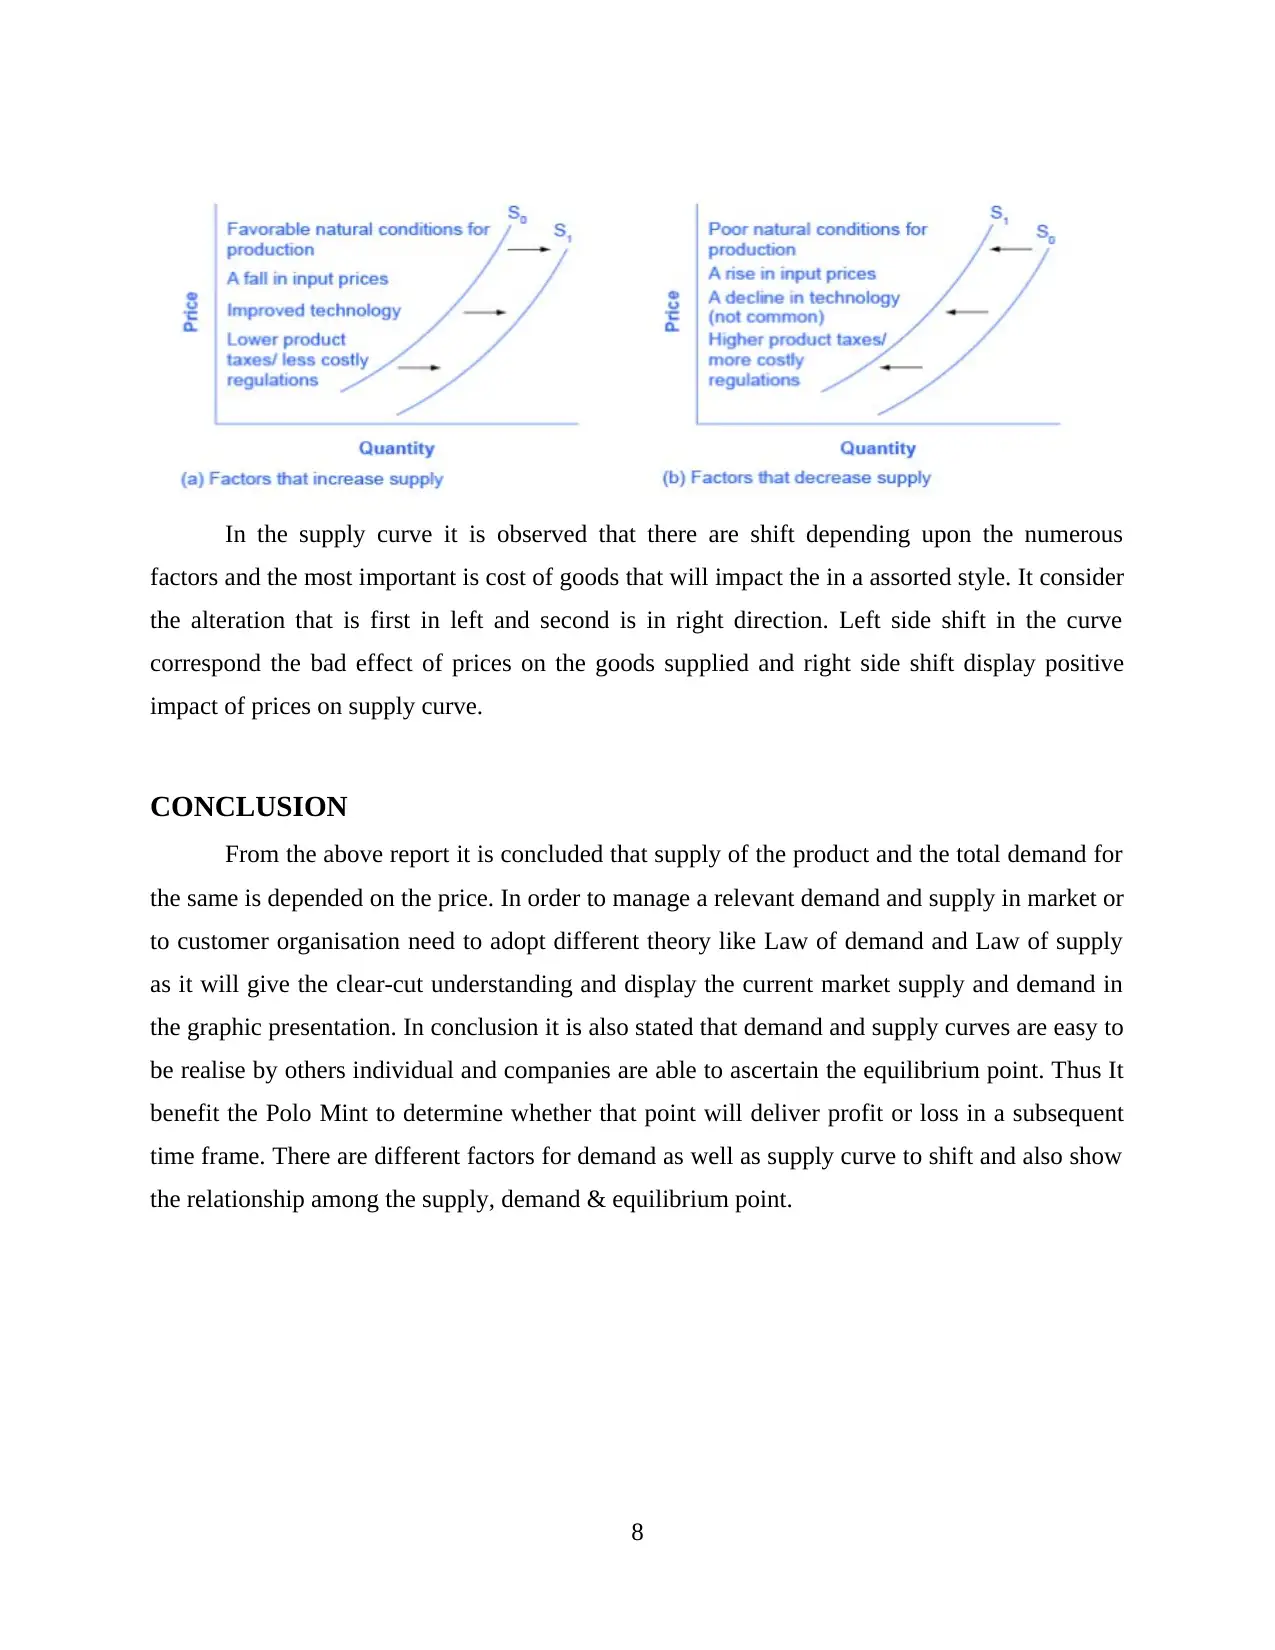
In the supply curve it is observed that there are shift depending upon the numerous
factors and the most important is cost of goods that will impact the in a assorted style. It consider
the alteration that is first in left and second is in right direction. Left side shift in the curve
correspond the bad effect of prices on the goods supplied and right side shift display positive
impact of prices on supply curve.
CONCLUSION
From the above report it is concluded that supply of the product and the total demand for
the same is depended on the price. In order to manage a relevant demand and supply in market or
to customer organisation need to adopt different theory like Law of demand and Law of supply
as it will give the clear-cut understanding and display the current market supply and demand in
the graphic presentation. In conclusion it is also stated that demand and supply curves are easy to
be realise by others individual and companies are able to ascertain the equilibrium point. Thus It
benefit the Polo Mint to determine whether that point will deliver profit or loss in a subsequent
time frame. There are different factors for demand as well as supply curve to shift and also show
the relationship among the supply, demand & equilibrium point.
8
Paraphrase This Document
Need a fresh take? Get an instant paraphrase of this document with our AI Paraphraser
REFERENCE
Books & Journal
Assous, M., Bruno, O. and Legrand, M. D. P., 2014. The law of diminishing elasticity of demand
in Harrod's trade cycle. Cahiers d'économie politique/Papers in Political Economy. (2).
pp.159-173.
Azevedo, E. M. and Leshno, J. D., 2016. A supply and demand framework for two-sided
matching markets. Journal of Political Economy. 124(5). pp.1235-1268.
Bohi, D. R., 2013. Analyzing demand behavior: a study of energy elasticities. RFF Press.
Heakal, R., 2015. Economics basics: Supply and demand. Investopedia. accessed September. 28.
Kaiser, H. M., 2016. An economic analysis of the Cattlemen’s Beef Promotion and Research
Board demand-enhancing programmes. Applied Economics. 48(4). pp.312-320.
Kakarot-Handtke, E., 2014. The Law of Supply and Demand: Here it is Finally.Available at
SSRN 2481840.
Lee, S. S. and Mykland, P. A., 2012. Jumps in equilibrium prices and market microstructure
noise. Journal of Econometrics. 168(2). pp.396-406.
Marchand, A. and Hennig-Thurau, T., 2013. Value creation in the video game industry: Industry
economics, consumer benefits, and research opportunities. Journal of Interactive
Marketing. 27(3). pp.141-157.
Nelson, R. R., 2013. Demand, supply, and their interaction on markets, as seen from the
perspective of evolutionary economic theory. Journal of Evolutionary Economics.
23(1). pp.17-38.
Obizhaeva, A. A. and Wang, J., 2013. Optimal trading strategy and supply/demand dynamics.
Journal of Financial Markets. 16(1). pp.1-32.
Valin, H., and et.al., 2014. The future of food demand: understanding differences in global
economic models. Agricultural Economics. 45(1). pp.51-67.
Zou, B. and Hansen, M., 2012. Flight delays, capacity investment and social welfare under air
transport supply-demand equilibrium. Transportation Research Part A: Policy and
Practice. 46(6). pp.965-980.
Online
Demand Curve. 2019. [Online]. Available through:
<https://www.khanacademy.org/economics-finance-domain/microeconomics/supply-
demand-equilibrium/demand-curve-tutorial/a/what-factors-change-demand>
9
1 out of 11
Related Documents


Your All-in-One AI-Powered Toolkit for Academic Success.
+13062052269
info@desklib.com
Available 24*7 on WhatsApp / Email
![[object Object]](/_next/static/media/star-bottom.7253800d.svg)
Unlock your academic potential
Copyright © 2020–2026 A2Z Services. All Rights Reserved. Developed and managed by ZUCOL.