MDM4U: Analyzing Canada's Population Demographics and Crime Rates

Verified

Added on  2023/05/28

|24
|3342
|310
Report
AI Summary
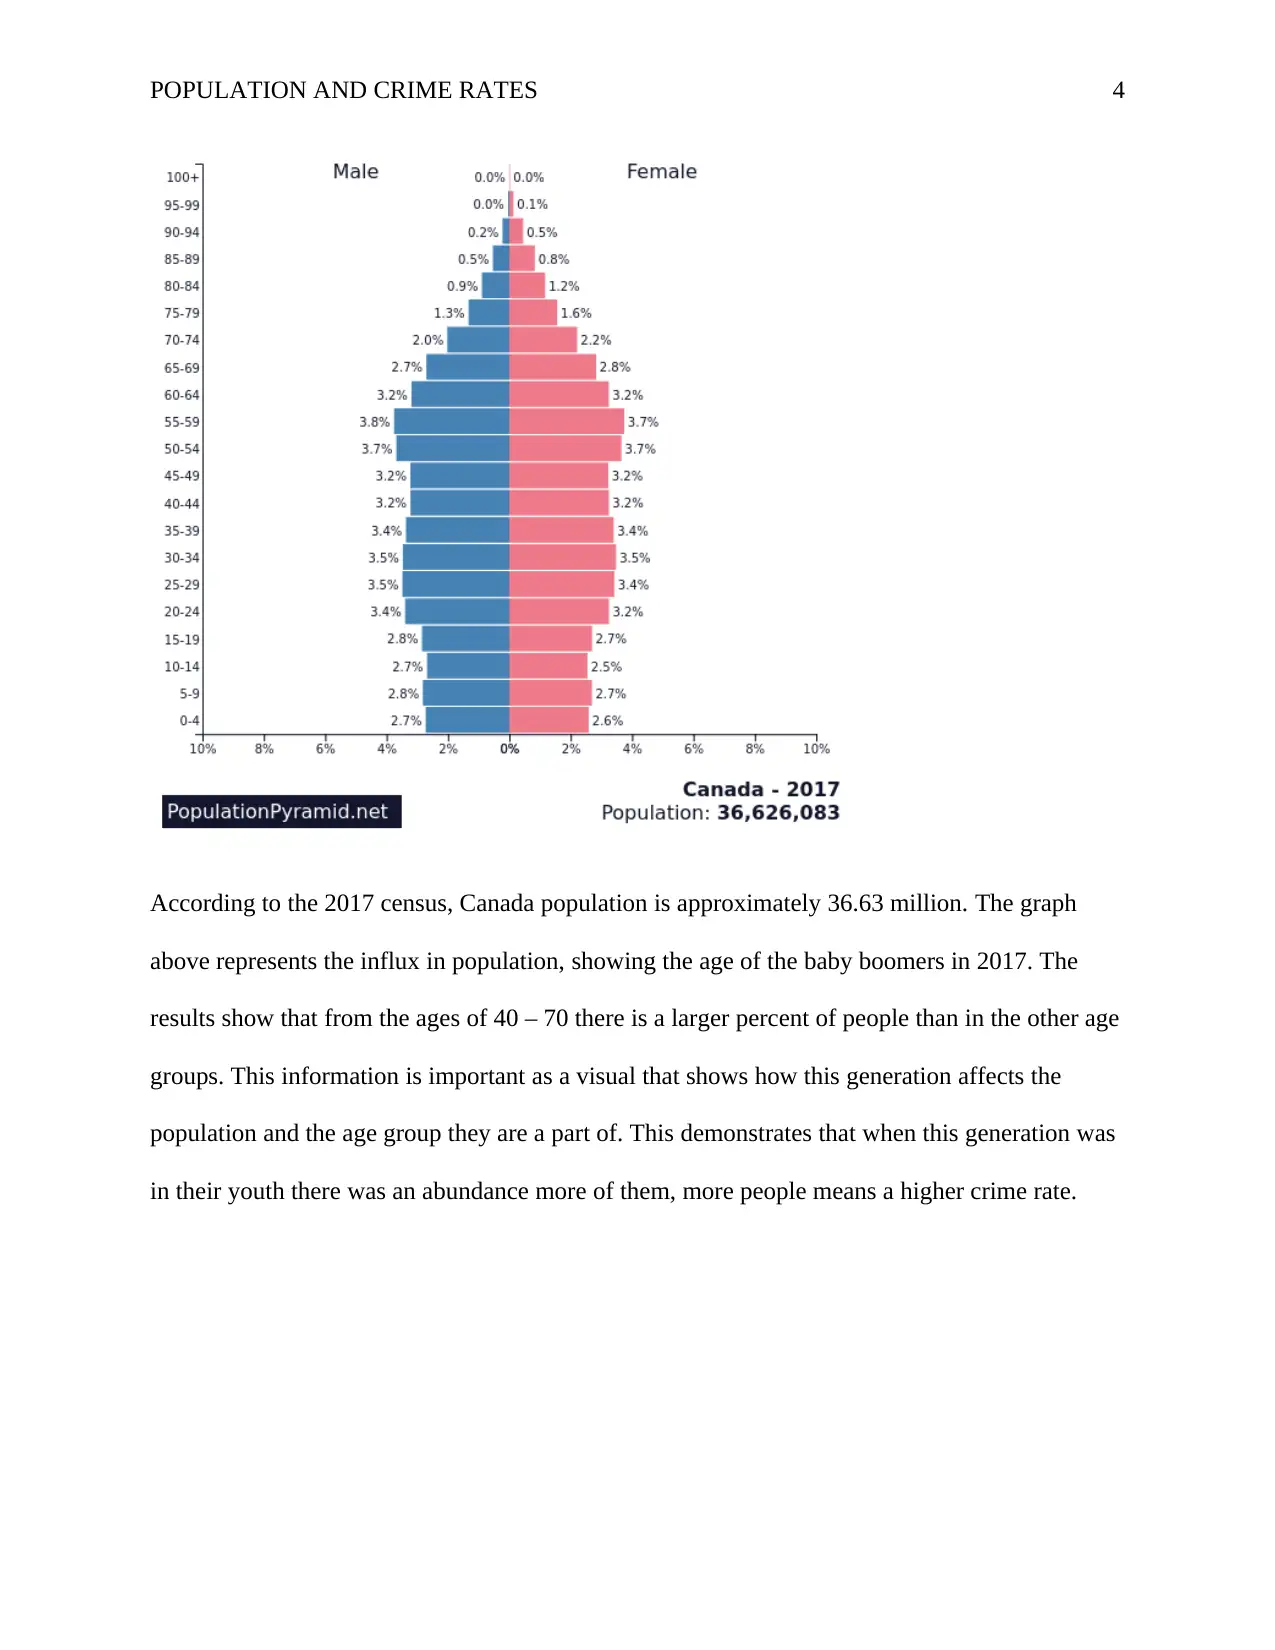
This report investigates the correlation between population demographics and crime rates in Canada, utilizing data from the mid-1940s to 2018. The study examines various factors, including age distribution, income, and the number of police officers, to determine their impact on crime rates. Employing statistical methods such as mean, median, mode, variance, standard deviation, correlation coefficients, and linear regression, the analysis reveals insights into the relationship between population shifts, generational changes (specifically the baby boomer generation), and the incidence of different types of crimes. The findings suggest a decline in crime rates linked to demographic shifts, with the report also exploring the impact of GDP and population size on crime trends, providing a comprehensive overview of the complex interplay between societal changes and criminal activity.
Document Page
Running head: POPULATION AND CRIMES RATES
1
Canada’s Shift in Population Demographics Leads to a Decrease in Crime Rates
Student Name
Institution
tabler-icon-diamond-filled.svg

Paraphrase This Document

Need a fresh take? Get an instant paraphrase of this document with our AI Paraphraser
Document Page
POPULATION AND CRIME RATES 2
1.0 Introduction
1.1 Purpose of the Study
The main purpose of the study is to determine of there exist any relationship between
demographical shift and crime rates in Canada. Demographic is the study of the composition of
population (Cyree & Morris, 2018). Population is characterized by size, age, gender, and income
of people in a population. The composition of population has effect on the social and economic
behavior of individual and thus likely to have an impact on crime rates in a country. Crime is an
extremely important area to focus on as it directly involves our wellbeing as Canadian citizens.
This report will focus on population demographical shifts as well as age and various other factors
to determine the cause of the decline. In addition, the report aims to find out the factors that
influence the decrease in crime rates to be able to predict present and future trends as a way of
ensuring the safety Canada residents.
1.2 Main Research Question
Does the population demographic have any impact on the rate of crime in Canada?
1.3 Research Questions
i. Does income of a population have on crime rates in Canada?
ii. What is the relationship between population size and crime rates in Canada?
iii. Is there a significant relationship between size and crime rates in Canada?
iv. Is there any relationship between number of police officers deployed in an area and
crime rates?
v. Which age group commits most crimes in Canada?
1.4 Sampling Technique
Document Page
POPULATION AND CRIME RATES 3
The data used for analysis in the research study is secondary and was retrieved from ().
The data used is factual data from mid 1940s to 2018.
1.5 Hypothesis Statement
It is predicted that crimes in Canada are declining because of the shift in population
demographics, more specifically focusing in on the baby boomer’s generation and their affects
during various ages.
2.0 Analysis
This chapter will present data analysis of Canadian demographics and the crime rates in
Canada. The analysis will include mean, median, mode, variance, standard deviation, whisker
plot, correlation coefficient, linear regression, and graphical displays. The analysis of available
data is very important in determination whether demographics actually have effect on crime rates
in Canada. In addition, the analysis of effect age groups will assist in understanding why
generational shifts in population affect the amounts of crimes in certain years versus other
demographic factors.
2.1 Population Composition by Age
Document Page
POPULATION AND CRIME RATES 4
According to the 2017 census, Canada population is approximately 36.63 million. The graph
above represents the influx in population, showing the age of the baby boomers in 2017. The
results show that from the ages of 40 – 70 there is a larger percent of people than in the other age
groups. This information is important as a visual that shows how this generation affects the
population and the age group they are a part of. This demonstrates that when this generation was
in their youth there was an abundance more of them, more people means a higher crime rate.
tabler-icon-diamond-filled.svg

Paraphrase This Document

Need a fresh take? Get an instant paraphrase of this document with our AI Paraphraser
Document Page
POPULATION AND CRIME RATES 5
19%
8%
13%61%
Population Growth by Age
Total Population
0-14
15-64
65+
Pie chart showing the populations growth by age in various age groups (65+, 15-64, 0-14, Total population).
The pie chart above represents just how greatly demographic shifts affect the population. The
results show that 61% of Canadas population is older than 65, while only 8% is aged 0-14. These
results once again demonstrate the shifts in demographics over the years and how majority of our
population is older than 65. This information is important to reiterate that when this generation
were in their youth, majority of the population would have been youths/youth adults and crime
rates would have increases.
Document Page
POPULATION AND CRIME RATES 6
Drug offences
Criminal Code traffic offences
Other Criminal Code offences
Property crime
Violent crime
0
500
1000
1500
2000
2500
Offences By Age and Offence Type
Youth aged 12 to 17
Young adults aged 18
to 24
Older adults aged 25
and over
Offence Type
Rate per 100,000 Population
The above bar graph illustrates various crimes and the number of offences within certain age
groups. Figure 5 shows that young adults aged 18 to 24 had the highest rates for all of the
offences other than property crime. The second highest rates for number of crimes committed
were youths aged 12 to 17, and last having a significantly less number of offences, adults 25+.
This suggests that young adults are more likely to be accused of and commit crimes than adults
or young children. The median age for young adults is 21 and most offences occur at around this
age
2.2 Demographic studies
Document Page
POPULATION AND CRIME RATES 7
1
5
9
13
17
21
25
29
33
37
41
45
49
53
0
500
1,000
1,500
2,000
2,500
3,000
3,500
4,000
4,500
5,000
Amount of Births in canada ('000)
Amount of Births in
thousands
The above histogram shows the number of births in Canada from 1940 to 1994. The number o
birth is increasing steadily from 1994 to 1964 then a slight decrease in the number of births from
1965 to 1988. From 1989, a steady increase in births is realized until 1994. Such increase in the
births could be as a result o improved health care and income increase. Improved health care and
income is an indicator of good economic status of a country/individual.
2.3 Measures of Central Tendency
Total Crimes
population
size GDP
Mean 8519.037037 28618476.41
79.8435658
3
Standard Error 156.0285101 478298.7014
2.05461264
4
Median 8475 28833410 77.2728259
tabler-icon-diamond-filled.svg

Paraphrase This Document

Need a fresh take? Get an instant paraphrase of this document with our AI Paraphraser
Document Page
POPULATION AND CRIME RATES 8
1
Mode #N/A #N/A #N/A
Standard
Deviation 810.7479207 2485312.956
10.6760804
7
Sample Variance 657312.1909 6.17678E+12
113.978694
1
Kurtosis -0.322824661 -1.280935054
-
0.90088210
3
Skewness 0.313961382 -0.068771016
0.44467671
5
Range 3096 7963463
35.8019096
6
Minimum 7246 24593000
64.1980903
4
Maximum 10342 32556463 100
Sum 230014 772698863
2155.77627
7
Count 27 27 27
The table above represents the measures of central tendency for population size, GDP,
and total crime in a year. The average annual crimes, population size, and GDP are 8519.04,
28618476.4, and 79.84 respectively. This suggests that the annual crime is approximately 8500
Document Page
POPULATION AND CRIME RATES 9
with an approximated population of 28.6 million people living in Canada. Thus the expected
annual crimes in Canada at any given year are approximately 8500. This suggests that the
annual crime is approximately 8500 with an approximated population of 28.6 million people
living in Canada.
The median annual crimes, population size, and GDP are 8475, 28833410, and 77.27
respectively. This suggests that the median is approximately 8475 with an approximated
population of 28.8million people living in Canada. Thus middle most annual crimes in Canada at
any given is 8475.
2.4 Measures of Spread
The table above represents the measures of spread for population size, GDP, and total
crime in a year. The variance of total crimes, population size, and GDP are 657312.1909,
6.17678E+12, and 113.9786941 respectively. This suggests that the mean annual crime is
approximately 8500 with a variance of 657312.1909 and the mean population size is
approximately 28.6 million with a variance of 6.17678E+12. Similarly, the mean GDP of Canada
is 79.84 with a variance of 113.98.
The standard deviation of total crimes, population size, and GDP are 810.7479207,
2485312.956, and 10.67608047respectively. This suggests that the mean annual crime is
approximately 8500 with a standard deviation of 810.7479207 and the mean population size is
approximately 28.6 million with a standard deviation of 2485312.956. Similarly, the mean GDP
of Canada is 79.84 with a variance of 10.6760.Therefore, the predicted total crime, population
size, and GDP with the respective standard deviations.
2.5 Correlation Coefficient
correlation
Document Page
POPULATION AND CRIME RATES 10
population
size GDP
Total
Crimes
population
size 1
GDP 0.947088776 1
Total Crimes -0.519068695
-
0.6810131
7 1
60.00 65.00 70.00 75.00 80.00 85.00 90.00 95.00 100.00105.00
0
2,000
4,000
6,000
8,000
10,000
12,000
f(x) = − 51.7165464339379 x + 12648.270516827
A scatterplot of total crimes against GDP
GDP
Crime rate
Under the correlation coefficient section, the relationship between variables is represented
graphically. The correlation coefficient between total crimes and GDP is 0.68. The fitted
regression model, y=-51.71x+12648.
A correlation coefficient 0.68 indicates a fairly strong positive correlation between the number of
crimes committee and income (GDP). An increase in income is likely to increase the crime rates
tabler-icon-diamond-filled.svg

Paraphrase This Document

Need a fresh take? Get an instant paraphrase of this document with our AI Paraphraser
Document Page
POPULATION AND CRIME RATES 11
in Canada. This supports the research hypothesis and proves that a fairly strong relationship exist
between the number of crime committed and the income. According to s
24000000 26000000 28000000 30000000 32000000 34000000
0
2,000
4,000
6,000
8,000
10,000
12,000
f(x) = − 0.000169328318995683 x + 13364.9555393209
Population size
C
r
i
m
e
s
The correlation coefficient between total crimes and GDP is 0.68. The fitted regression model,
y=-51.71x+12648.
A correlation coefficient 0.68 indicates a fairly strong positive correlation between the number of
crimes committee and income (GDP). An increase in income is likely to increase the crime rates
in Canada. This supports the research hypothesis and proves that a fairly strong relationship exist
between the number of crime committed and the income. According to
Document Page
POPULATION AND CRIME RATES 12
Bar graph
representing the
number of police
officers in 100,000
per unit in 1986 and
2016
The above bar graph illustrates the number of police officers in 1986 and 2016. The results show
no significant change in number of police officers in 1986 and 2016 in any of the provinces.
These results indicate that the number of police officers does not have an effect on the decline of
crime in Canada. This information is useful in ruling out which factors affect crime and which do
not.
2.6 Linear Regression
2.6.1 Linear regression between crime rates and population size.
SUMMARY
OUTPUT
Regression
Statistics
Multiple R 0.519069
R Square 0.269432
Canada
N.L.
P.E.I.
N.S.
N.B.
Que.
Ont.
Man.
Sask.
Alta.
B.C.
0
50
100
150
200
250
Police Officers Per Province
1986
2016
Province
# of Poilice Officers
chevron_up_icon
1 out of 24
circle_padding
hide_on_mobile
zoom_out_icon
[object Object]