BUSN20019: Analysis of Population Growth and Employment in Australia
VerifiedAdded on 2020/03/23
|15
|3664
|61
Report
AI Summary
This report investigates the effects of population growth on employment in Australia, utilizing secondary data from the Australian Bureau of Statistics. The study examines the relationship between population growth and employment rates, considering gender differences and part-time versus full-time job classifications. The research employs descriptive and inferential statistics, including analysis of variance and correlation, to determine the relationship between population growth and employment. The findings indicate a positive linear relationship between population growth and employment, although not necessarily a causal one. Furthermore, the study reveals differences in employment between males and females, with males generally having higher employment rates, while females are more prevalent in part-time positions. The report also addresses the significance of these findings for future population and employment schemes.

Population growth and its effect on employment in Australia
BUSN20019: ASSIGNMENT 2
DATE 23/09/2017
BUSN20019: ASSIGNMENT 2
DATE 23/09/2017
Paraphrase This Document
Need a fresh take? Get an instant paraphrase of this document with our AI Paraphraser
DECLARATION
Student’s Declaration
This is my original work and has not been presented in any other institution
Sign …………………………………. Date…………………………………
Supervisor Declaration
This Project has been submitted for examination and approval by the institution supervisor
Sign ………………………………… Date…………………………………
DEDICATION
This work is dedicated to my family who gave me moral support throughout the period. It is also
dedicated to my colleagues who encouraged me in this task that can be accomplished by doing a
step at a time.

ACKNOWLEDGEMENT
I have a step appreciation to The Almighty God for life and good health he gave me throughout
this project.
I wish to acknowledge the support of my family who allowed many days of absence to complete
this assignment. My parents, brothers and sisters, for encouragement and to my dear friends who
contributed in various ways, thank you.
I finally acknowledge my supervisor. I greatly honor his guidance, support and positive critic on
this project. To my colleagues, your correction and advice were important.
⊘ This is a preview!⊘
Do you want full access?
Subscribe today to unlock all pages.
Trusted by 1+ million students worldwide
ABSTRACT
Population growth in Australia has been increasing and has had an effect on employment in
Australia. Employment has had effect on both genders which is the, male and the female. The
employment class can not be ignored for the both compositions males and females as being part
time and full time.
On the labour supply, lies between population growth and labor force participation; increased
population growth due to changes in fertility, mortality and migration; labor force participation
rates gender differences in labor supply behaviors.
The labour force increased rapidly than working age population. The working age population
participates in formal labour market in 2009 than in 1990. At the same time labour productivity
increased across all sectors (Bloom & freeman 1986)
The study was a case study which intended to understand the population growth and effect on
employment. Data analyzed was secondary data provided by Australia Bureau of Statistics. Data
were analyzed using descriptive and inferential statistics. Analysis of variance and correlation
were used to establish the relation between population growth and employment, employment and
gender and population employment ratio and gender at 5% level of significance.
The study revealed that relationship between population growth and number of employment is
positive linear, where population increases results to higher employment. Though the
relationship is not causal that is population increase does not mean increase in employments.
Males are more employed compared to females, although females are more employed in part
time jobs as compared to males.
CHAPTER ONE
Paraphrase This Document
Need a fresh take? Get an instant paraphrase of this document with our AI Paraphraser
Background of the study
Population growth is the increase in the number of individuals in the population. The
Australia population has been having an upward trend in the census that has being conducted.
The population increase half has been attributed to the immigration according to Ken Henry,
the chairman of the National Australia Bank. The increased population stimulates economic
growth, from small and simple quantities like increased labour force, which has improved the
GDP to increased human capital ability of the population to innovate and create.
Since the Sydney Olympics the Australia population has grown by 25 percent. The
Australia’s population reached 23.7 million on 5th January 2015, according to Australia
Bureau of Statistics.
The Australia population has increased and the employment has been an issue for all the
residents of Australia. The ageing bracket has increased in Australia while the young
percentage in the population has been increasing in an upward trend. These indicate that the
ageing percentage in the population have different preference for good and services. The
labour to be provided in ageing is more official while the young person provides technical
labour.
The growth in the population has been contributed by an upward birth rate and immigration.
The birth rate has been carried out by improved health facilities and medical education. This
has lead to low death rate and thus an increased ageing bracket.
The employment in Australia has paid workers who offer labour to business and get paid.
The wage levels largely depend on the operation of demand and supply in labour market. The
case of powerful labour include dentist, doctor and has a low supply where few can do the
job the wage are high. The cases of less powerful labour include cleaners and have a high
supply where most of the persons can attend to then the wages are low.
The labour market has a weak, strong and ideal condition. The weak market condition there
few job vacancies and those who can do the job are many. The strong market condition there
are many job vacancies. The ideal both vacancies and those to fill exist.
Statement of Problem
Population growth in Australia is in an upward trend and opportunities for these populations
are a matter to be addressed.
When the opportunity are created the gender composition is to be addressed, males and
females in these population should be given chances equally to allow gender equality.
Employment schemes where part-time and full time on both genders should be addressed to
allow growth of the economy.
The growth in population should also view the creating opportunities and employments, food
security, health facilities and infrastructures to the growing population.
Research objectives
This study had both general and specific objectives;
General Objective
The general objective of this study was to evaluate the growth of population in Australia
and effect on employment
Specific Objectives
The study intends to achieve the following specific objectives
1. To identify population growth and its effect on employment rate.
2. To identify population growth and its effect on employment on the sex composition.
3. To identify if the population growth affects unemployment rate.
Hypothesis
The study aimed at testing the following hypothesis question:
H0: Employment on gender does not differ
H1: Employment on gender differ
H0: Employment on job class on gender does not differs
H1: Employment on job class on gender differ
H0: Employment ratio does not differs
H1: Employment ratio differ
Significance of the study
The project finding will guide population schemes and employment schemes to improve
the plan for the future population growth in years to come.
The project finding will guide in identifying factors leading to population growth in
Australia and allocation of resources.
The study finding will guide in allocation of employment rate in males and females.
⊘ This is a preview!⊘
Do you want full access?
Subscribe today to unlock all pages.
Trusted by 1+ million students worldwide
The study will help in identifying the unemployment rate in Australia and the
government role to this bracket of population.
CHAPTER TWO
LITERATURE REVIEW
2.1 Introduction
This chapter of the literature review views academic literature provide in the population
growth in Australia and other region. The review also viewed effect of population growth
on employment at Australia.
2.1Literature review
Australian population is experiencing change in demography where proportions of old
people are on rise while proportions of young are on decline (Robyn L., 2008). The
government has started to impose policies which address issues of ageing population.
With high number of aged person and low number of young person, the labour force is
at risk of losing manpower.
The Australia Bureau of Statistics (ABS, 2013) estimated the population to 23 million.
The Australia bureau of statistics also made future estimations for the population based
on different assumptions i.e. migration and birth. The estimated population could reach
41.5 million by 2061, and estimated to 53.6 million by 2101.
The population of Australia has increased by double in the period of 50 years ago, which
has been resulted to natural births and immigration. The natural births rate of growths
yielding 42 percent of the population growth while 58 percent being attributed to
immigration.
Cities are characterized by high population which led to unemployment. The population
increases and job opportunities are few. The factors which led to high unemployment rate
are rural urban migration, improper or lack of government policies, mismanagement of
population and urban bias (Ilegbinosa et ela, 2014). In order to improve employment rate
and discourage unemployment there is need to review socio-economic organization,
manage rural-urban migration, and invest in human capital and encouraging spirit of
entrepreneurship.
The Australia natural rate has been influenced by economical, political and social factors.
More has been attributed to health science and medical facilities, improved standards of
living and infrastructure according to Ken Henry (National Australia Bank, 2015)
According to National Research Council (1986), the role of males and female in the
household and occupations has impact on the natural growth of the population. The
Paraphrase This Document
Need a fresh take? Get an instant paraphrase of this document with our AI Paraphraser
economic prospect of the population cost of living, community attribute and family size.
The economy such as inflation and unemployment greatly influence population growth.
The cost of living if it is high then people will maintain small family size to be in a
position to provide to them. The community attributes also influences since some have
two children while other more than two children.
The migration rate is due to improved standards of living for economical, political and
social factor. The initial policy of migration was ‘populate or perish’ then after some time
the policy was changed to skilled labour. The policy was changed to cater for the
modernization that was changing in the industrial. The change in the population the
ageing population has a higher expectancy in terms of health, transport, entertainment
and diet methods. The young population tends to have different types of transport, health,
dressing code and entertainment (Wiley, 2014)
In the international labour review (2004), the growing population has local market for
good and service. The production in the company calls for economy of scale. The
production process will be cheaper in the production of more units as compared to fewer
units since the maintenance is a constant value. The rise in the labour force in the
Australia is effective by immigrants helps overcome shortage of skills. The growing
population create job for the skilled and the unskilled in the population. The wage’s
competition is improved compared oversee wages.
Pauline M. & Neil A. (2011) in their study population growth and change identified
population growth as big challenge to social, economic, environment and infrastructure in
cities and rural areas. In cities the major issue is affordable housing, employment, social
amenities and political management which are threatened by growing population. Rural
areas are faced by threat of ageing population, depopulation and threats to socio-
economic pattern.
Australia 12 million work as paid worker, where wage levels largely depend on the
operation of demand and supply in the labour market. The other section is contributed by
volunteers who give their services for free. In cleaning, cultivating and nursing the old.
The unemployment has also been a challenge for most of the families. The part time job
are those that offer job for given hours in a day. These people tend to rest the remaining
hour as well as having fun thus spending much as compared to earned amount. This kind
of the seasonal job tends to influence unemployment at certain durations of the year. In
the journal of population research (2005), the unemployment is a issue of discussion by
the government to cater for the growing population.
Methodology
John D. (2016) described descriptive statistics require one variable to conduct the
study. It have three main importance’s which are explaining, validating and describing
research findings. Descriptive statistics are used to describe behavior and
characteristics of sample population. It involves measure of locations such mean
median and mode and also measures of variation such range, minimum, maximum,
standard deviation and quartile.
Inferential statistics are used to test the data. The researcher mainly uses inferential
statistics to test if there is a relationship between an outcome and intervention. The first
step is to check the distribution of data under study (Decaro S., 2011). It includes
hypothesis testing and estimation statistics.
The data used in the study is secondary data obtained from Australian Bureau of
Statistics. The population under study was Australian population, who are either
employed or unemployed consisting of male and female. Simple random sampling was
used to obtain a sample of 474. These sampling techniques give every object in the
population equal chance of being in the sample. This gives a representative sample
which is free from biases.
The data was then entered in Excel software for cleaning and analysis. Descriptive and
inferential statistics were used to describe the data and to answer research question. The
variables under study were rate of employment, unemployment, composition of
employment per gender and ratio of employment.
Correlation is used to check statistical association between variables. The relations
between the variables may be causal or not causal. Analysis of variance is statistical
technique used to check differences among means and association between means. It
also referred to Fisher analysis of variance which was used to improve t and z test
which were only used for nominal categorical data test only.
Results and findings
Population changes
⊘ This is a preview!⊘
Do you want full access?
Subscribe today to unlock all pages.
Trusted by 1+ million students worldwide
0.0
5.0
10.0
15.0
20.0
25.0
30.0
35.0
40.0
45.0
50.0
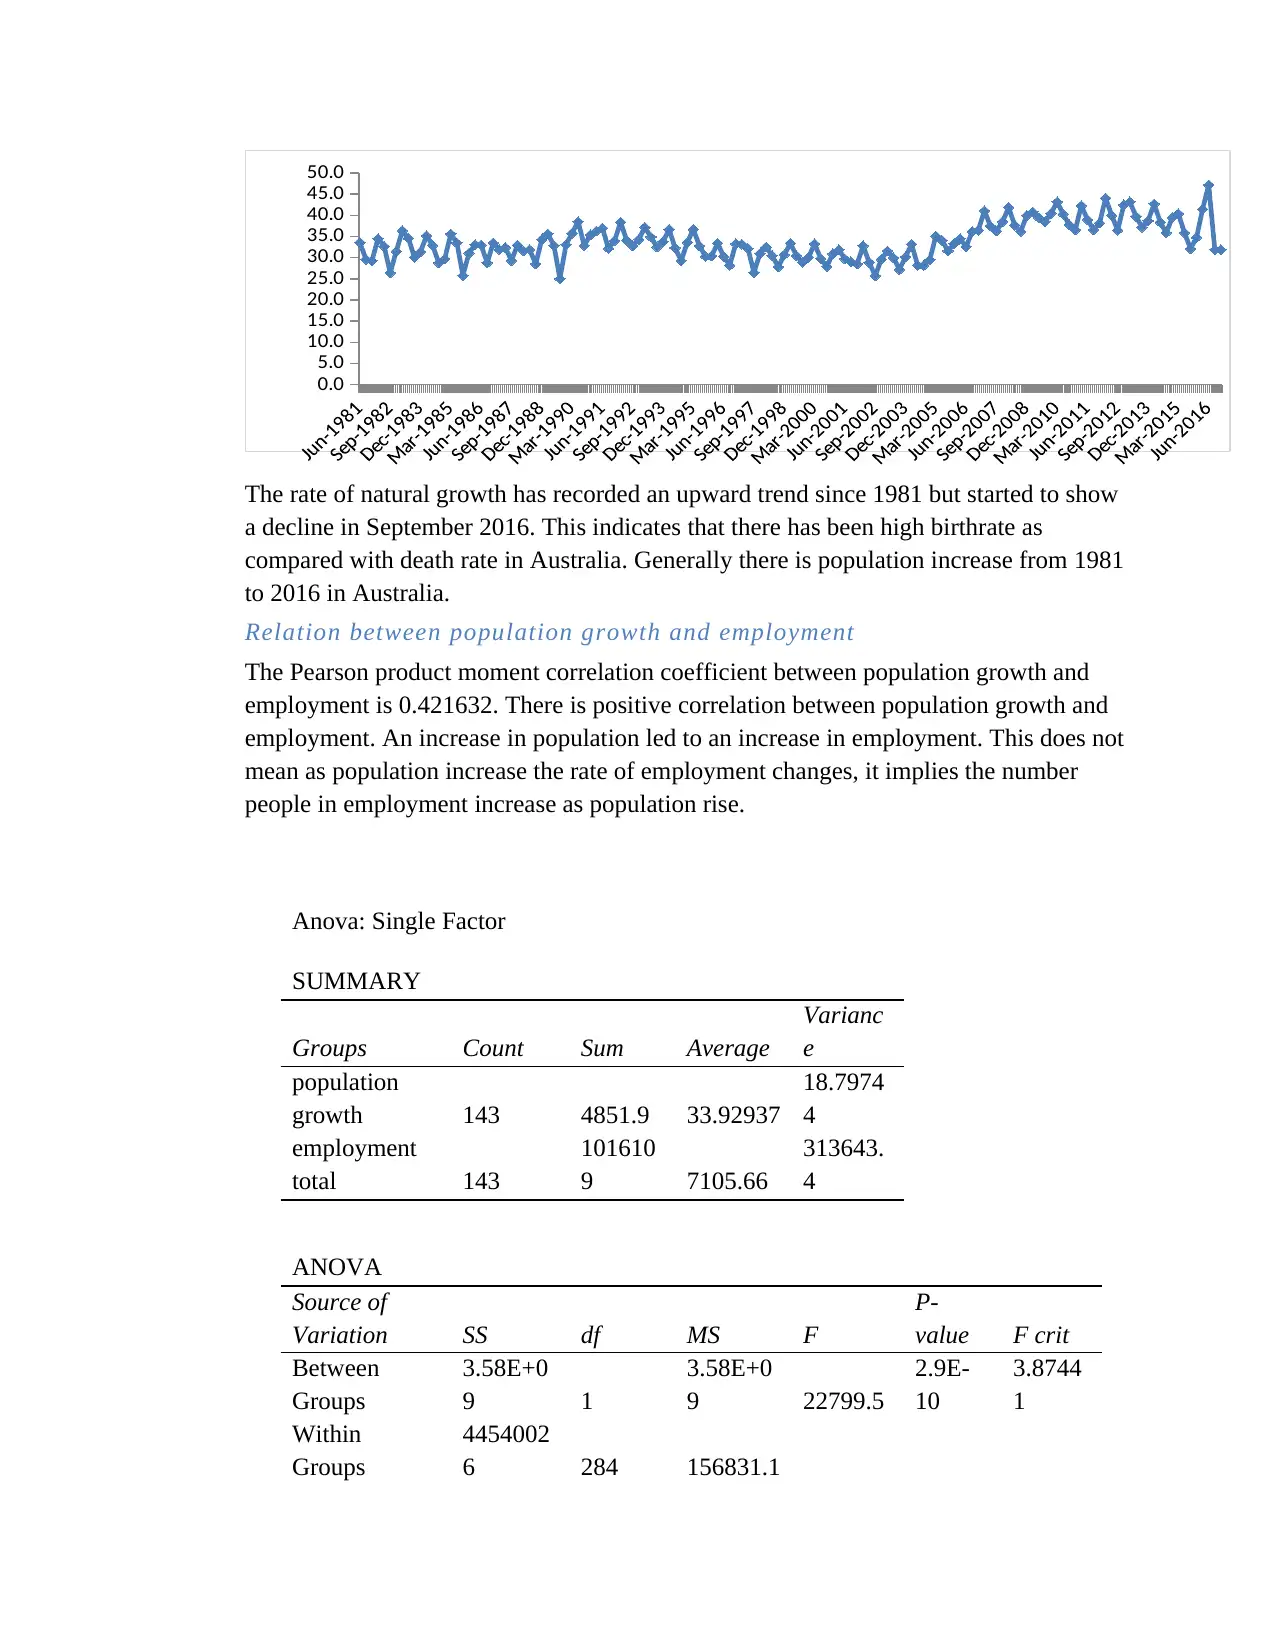
The rate of natural growth has recorded an upward trend since 1981 but started to show
a decline in September 2016. This indicates that there has been high birthrate as
compared with death rate in Australia. Generally there is population increase from 1981
to 2016 in Australia.
Relation between population growth and employment
The Pearson product moment correlation coefficient between population growth and
employment is 0.421632. There is positive correlation between population growth and
employment. An increase in population led to an increase in employment. This does not
mean as population increase the rate of employment changes, it implies the number
people in employment increase as population rise.
Anova: Single Factor
SUMMARY
Groups Count Sum Average
Varianc
e
population
growth 143 4851.9 33.92937
18.7974
4
employment
total 143
101610
9 7105.66
313643.
4
ANOVA
Source of
Variation SS df MS F
P-
value F crit
Between
Groups
3.58E+0
9 1
3.58E+0
9 22799.5
2.9E-
10
3.8744
1
Within
Groups
4454002
6 284 156831.1
5.0
10.0
15.0
20.0
25.0
30.0
35.0
40.0
45.0
50.0
The rate of natural growth has recorded an upward trend since 1981 but started to show
a decline in September 2016. This indicates that there has been high birthrate as
compared with death rate in Australia. Generally there is population increase from 1981
to 2016 in Australia.
Relation between population growth and employment
The Pearson product moment correlation coefficient between population growth and
employment is 0.421632. There is positive correlation between population growth and
employment. An increase in population led to an increase in employment. This does not
mean as population increase the rate of employment changes, it implies the number
people in employment increase as population rise.
Anova: Single Factor
SUMMARY
Groups Count Sum Average
Varianc
e
population
growth 143 4851.9 33.92937
18.7974
4
employment
total 143
101610
9 7105.66
313643.
4
ANOVA
Source of
Variation SS df MS F
P-
value F crit
Between
Groups
3.58E+0
9 1
3.58E+0
9 22799.5
2.9E-
10
3.8744
1
Within
Groups
4454002
6 284 156831.1
Paraphrase This Document
Need a fresh take? Get an instant paraphrase of this document with our AI Paraphraser
Total
3.62E+0
9 285
The analysis of variance between population growth and employment total as given
above at 5% level of significance, the p-value is 0.0000000029 which is less than
0.05.We reject null hypothesis that state there is no significance between population
growth and employment totals and conclude that the population differ significantly.
Which implies the number of employment per year is not proportion to population rise.
Difference between employment and gender
SUMMARY
Groups Count Sum Average Variance
males 426 2153674 5055.573 576787
females 426 1655277 3885.626 928841.4
ANOVA
Source of
Variation SS df MS F P-value F crit
Between
Groups 2.92E+08 1
2.92E+0
8 387.2791
2.47E-
71 3.852422
Within Groups 6.4E+08 850 752814.2
Total 9.31E+08 851
The null hypothesis states that there is no difference between employment rate and
gender in Australia. From analysis of variance between gender and employment at 5%
level of significance, the p-value is 2.47E-71 which is less than level of significance
0.05. Thus we reject null hypothesis and conclude that there is significance between
gender and employment. This implies that the mean employment of males and females
is not the same in Australia. One gender has higher rate of employment as compared to
the other. There exists gender imbalance in employment with one gender being favored.
Males are more in labour force as compared to females.
Jul-1981
Jun-1984
May-1987
Apr-1990
Mar-1993
Feb-1996
Jan-1999
Dec-2001
Nov-2004
Oct-2007
Sep-2010
Aug-2013
Jul-2016
0.0
1000.0
2000.0
3000.0
4000.0
5000.0
6000.0
7000.0
male employment
females employment
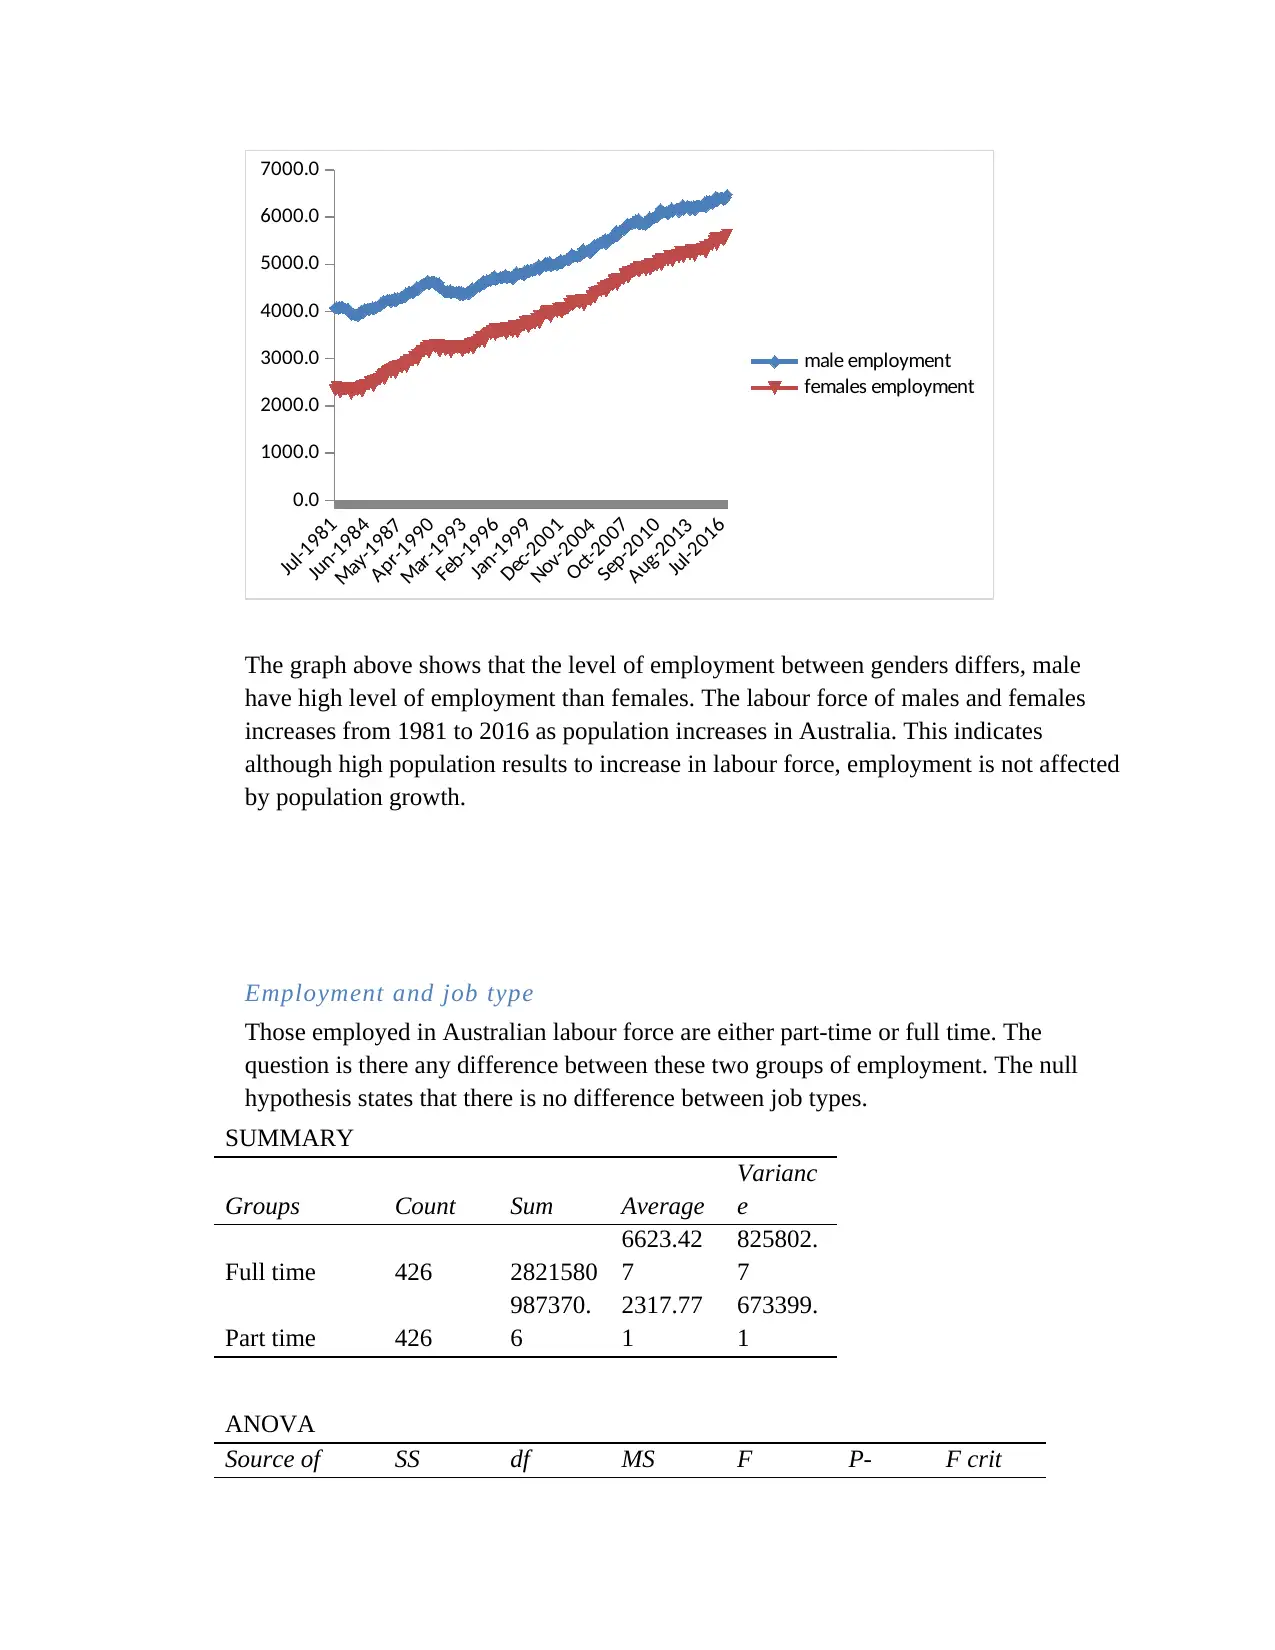
The graph above shows that the level of employment between genders differs, male
have high level of employment than females. The labour force of males and females
increases from 1981 to 2016 as population increases in Australia. This indicates
although high population results to increase in labour force, employment is not affected
by population growth.
Employment and job type
Those employed in Australian labour force are either part-time or full time. The
question is there any difference between these two groups of employment. The null
hypothesis states that there is no difference between job types.
SUMMARY
Groups Count Sum Average
Varianc
e
Full time 426 2821580
6623.42
7
825802.
7
Part time 426
987370.
6
2317.77
1
673399.
1
ANOVA
Source of SS df MS F P- F crit
Jun-1984
May-1987
Apr-1990
Mar-1993
Feb-1996
Jan-1999
Dec-2001
Nov-2004
Oct-2007
Sep-2010
Aug-2013
Jul-2016
0.0
1000.0
2000.0
3000.0
4000.0
5000.0
6000.0
7000.0
male employment
females employment
The graph above shows that the level of employment between genders differs, male
have high level of employment than females. The labour force of males and females
increases from 1981 to 2016 as population increases in Australia. This indicates
although high population results to increase in labour force, employment is not affected
by population growth.
Employment and job type
Those employed in Australian labour force are either part-time or full time. The
question is there any difference between these two groups of employment. The null
hypothesis states that there is no difference between job types.
SUMMARY
Groups Count Sum Average
Varianc
e
Full time 426 2821580
6623.42
7
825802.
7
Part time 426
987370.
6
2317.77
1
673399.
1
ANOVA
Source of SS df MS F P- F crit
⊘ This is a preview!⊘
Do you want full access?
Subscribe today to unlock all pages.
Trusted by 1+ million students worldwide
1 out of 15
Related Documents


Your All-in-One AI-Powered Toolkit for Academic Success.
+13062052269
info@desklib.com
Available 24*7 on WhatsApp / Email
![[object Object]](/_next/static/media/star-bottom.7253800d.svg)
Unlock your academic potential
Copyright © 2020–2026 A2Z Services. All Rights Reserved. Developed and managed by ZUCOL.