Term Project: Population Growth and Economic Development Analysis

Verified

Added on  2022/09/13

|9
|1301
|54
Project
AI Summary
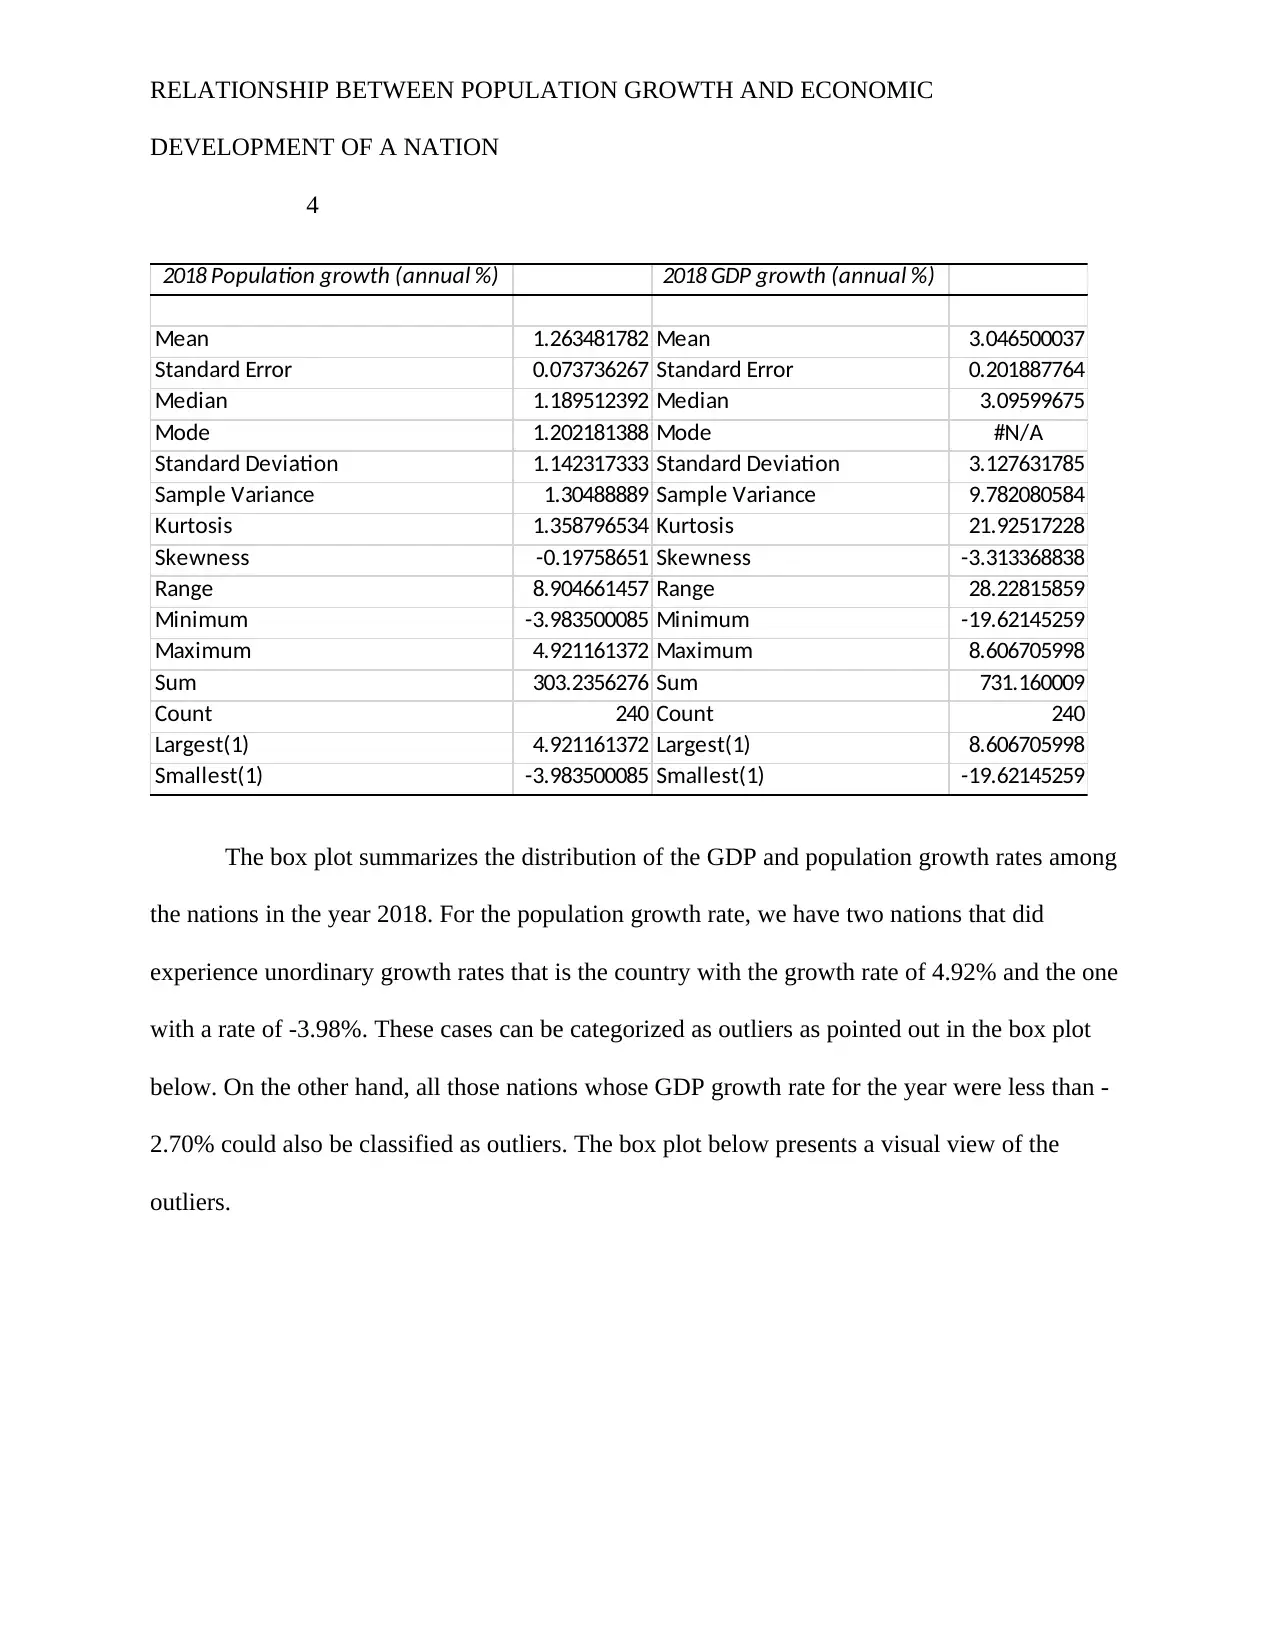
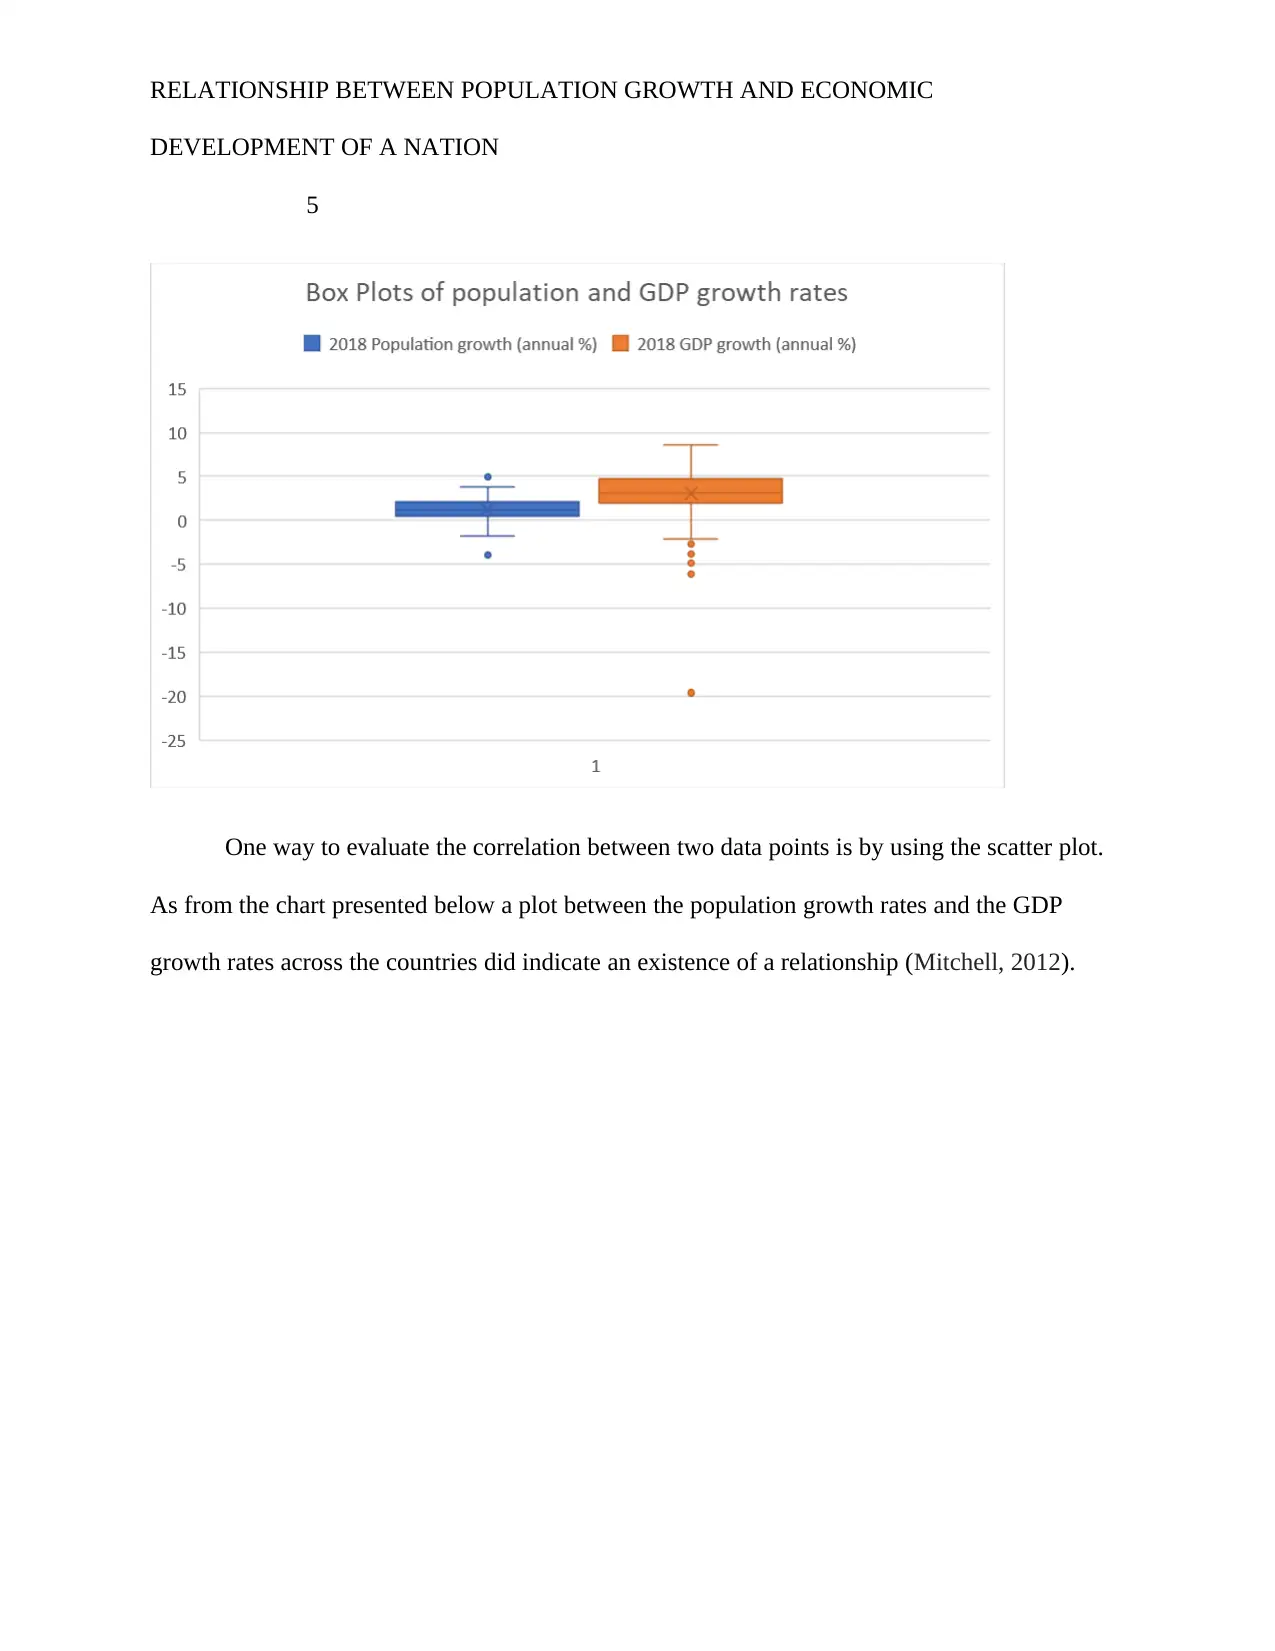
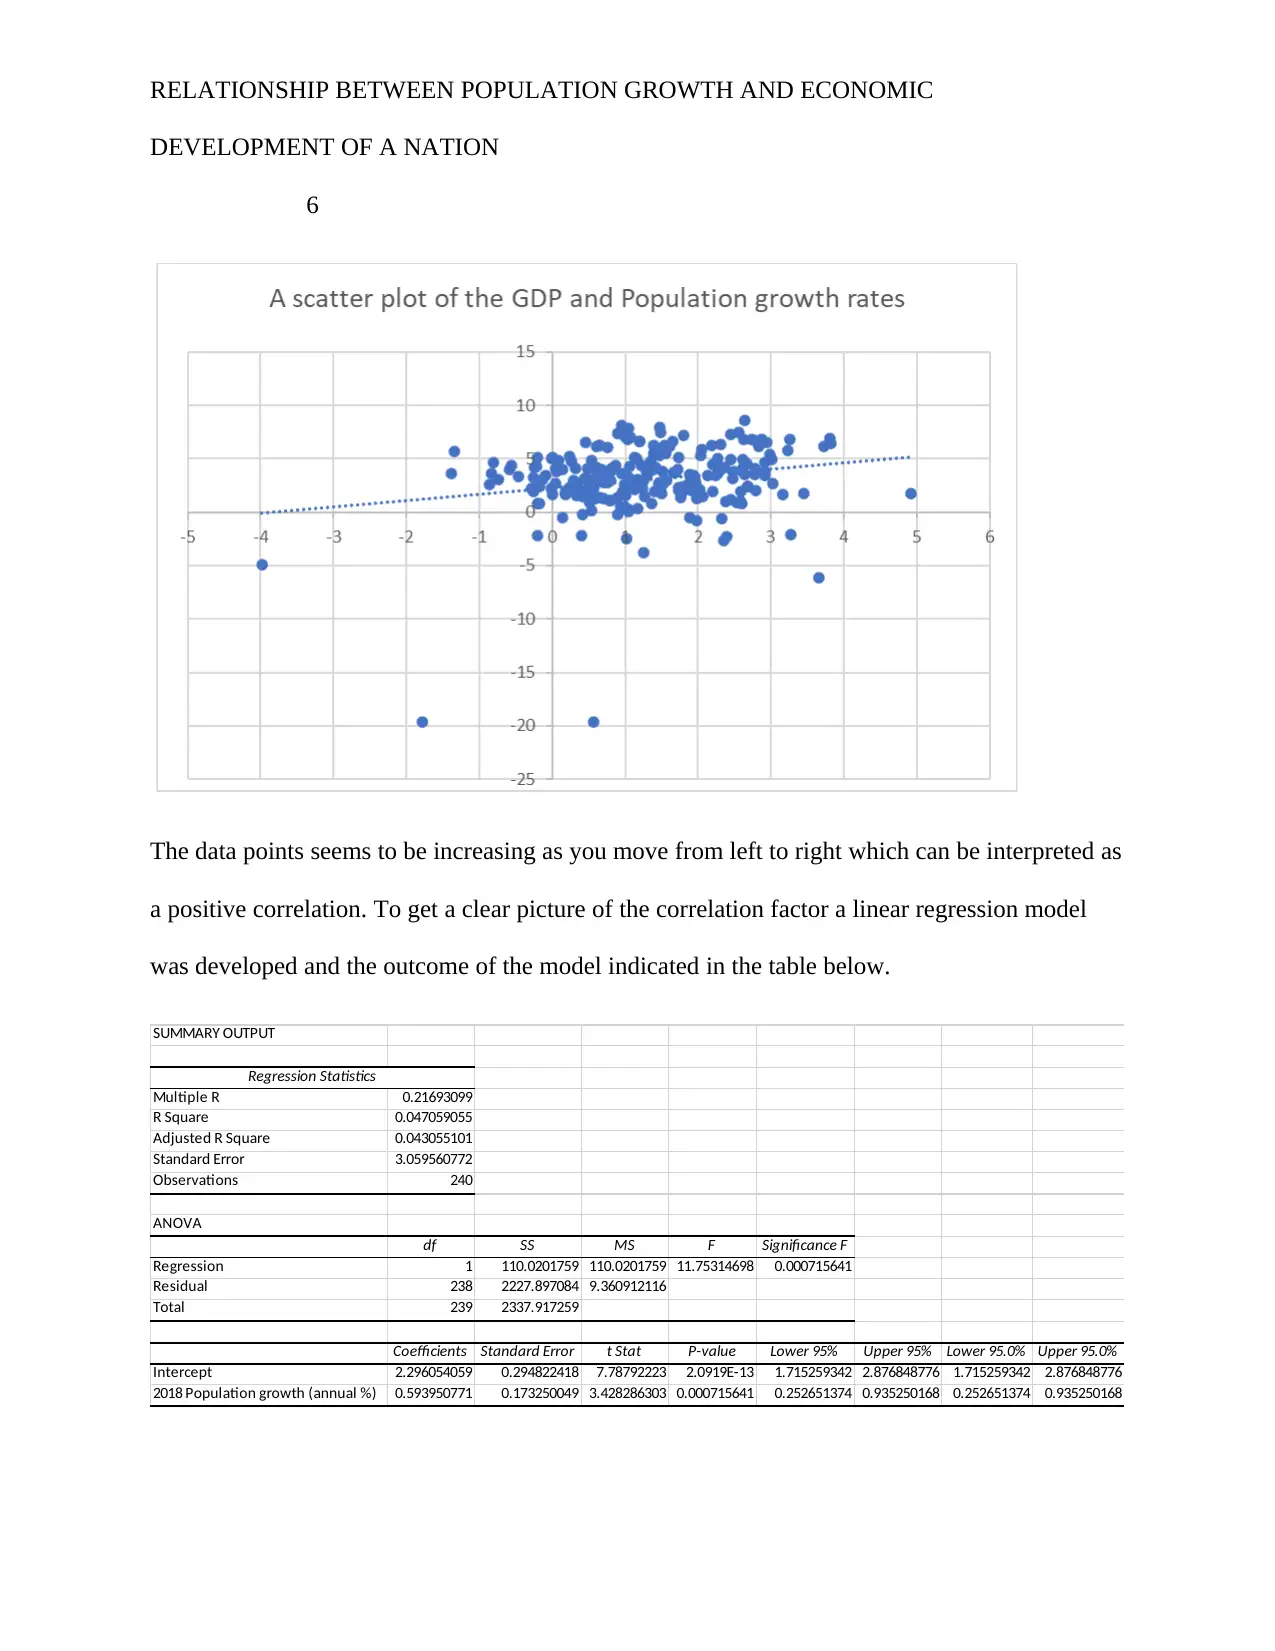
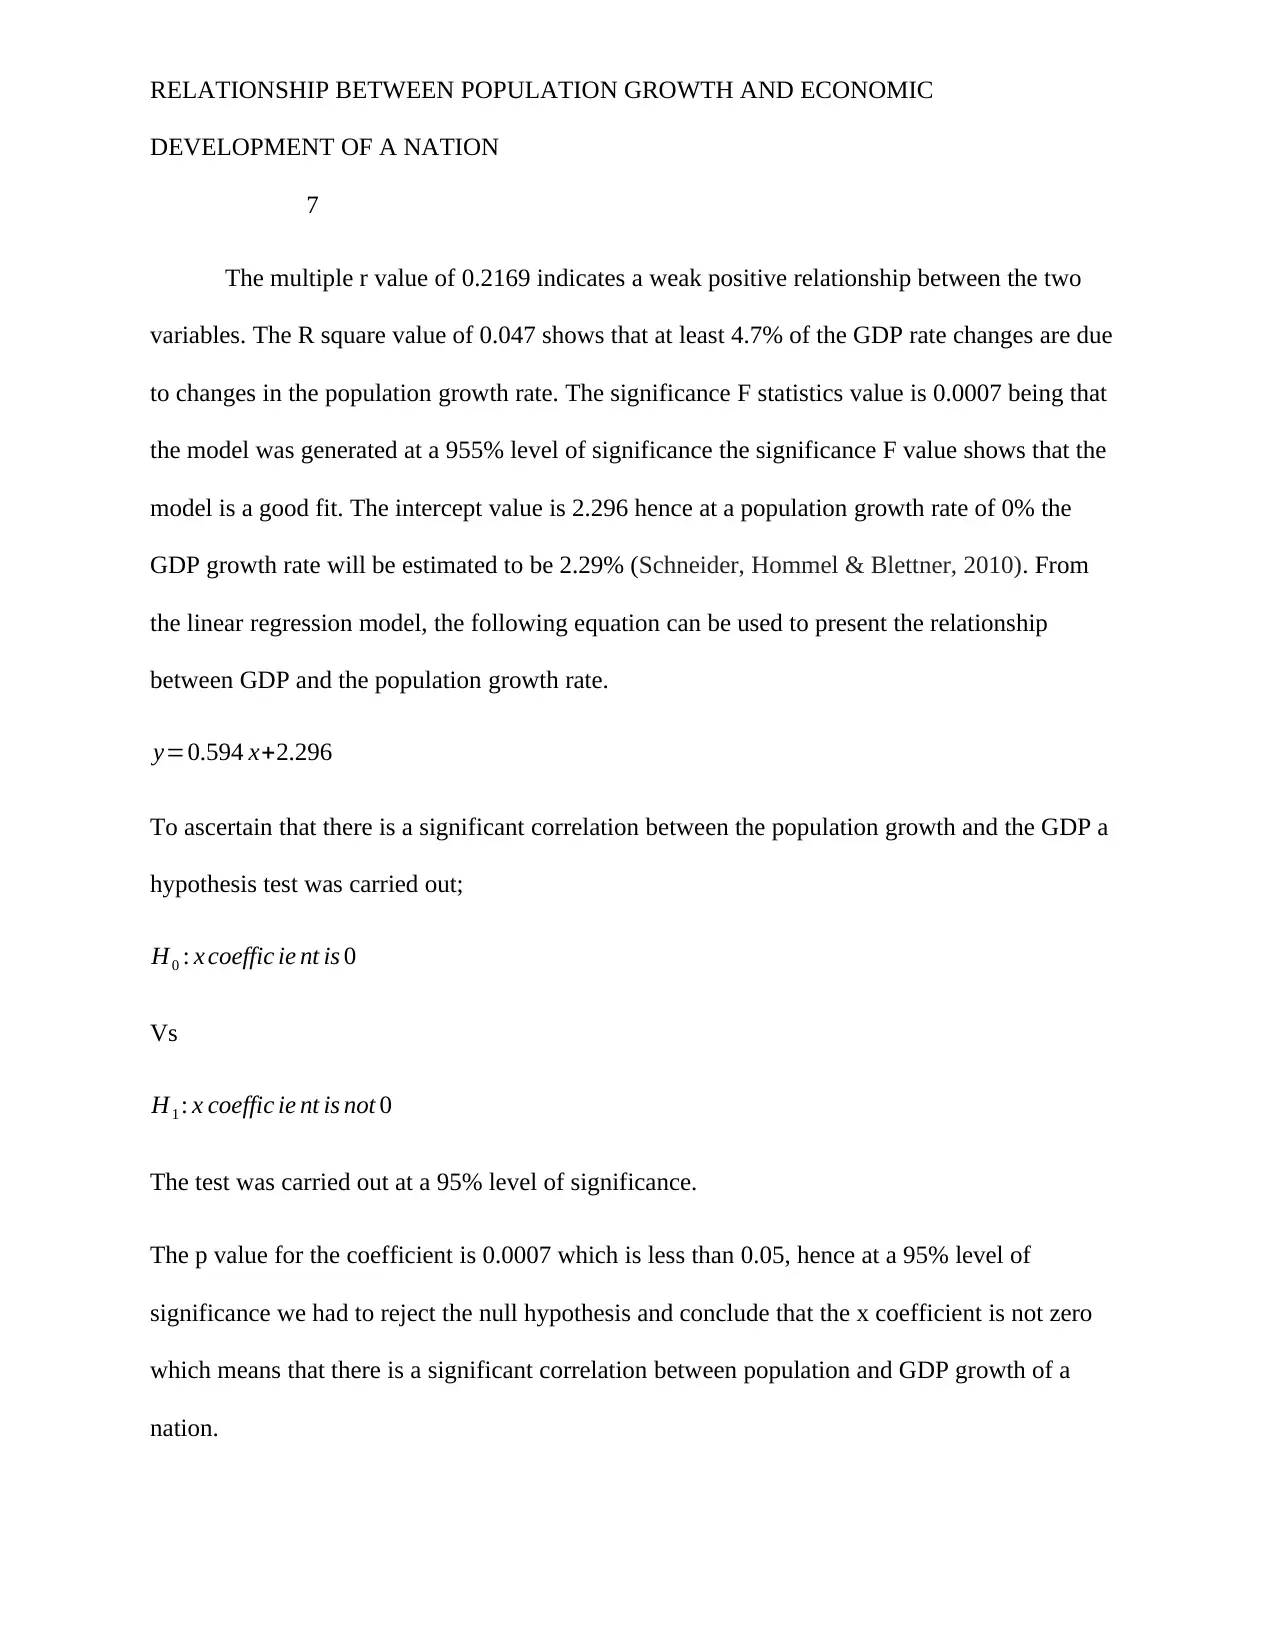
This term project investigates the relationship between population growth and economic development, using 2018 data from the World Bank. The study employs descriptive statistics, scatter plots, and simple linear regression to analyze the correlation between population growth rate and GDP growth rate across various countries. The analysis reveals a weak positive correlation between the two variables, suggesting that nations can influence GDP growth by controlling population growth. The project includes a hypothesis test to confirm the significant correlation. The findings indicate that while a relationship exists, population growth is not the sole determinant of economic development, with other factors playing significant roles. The project concludes that by controlling population growth, nations can influence their GDP growth rate.
Document Page
RELATIONSHIP BETWEEN POPULATION GROWTH AND ECONOMIC
DEVELOPMENT OF A NATION
1
Relationship between population growth and economic development of a nation
Student Name
Institution Name
Date
tabler-icon-diamond-filled.svg

Paraphrase This Document

Need a fresh take? Get an instant paraphrase of this document with our AI Paraphraser
Document Page
RELATIONSHIP BETWEEN POPULATION GROWTH AND ECONOMIC
DEVELOPMENT OF A NATION
2
Introduction
Population growth rate refers to the increase in the number of individuals in a nation’s
population. On the other hand, the GDP growth rate is a ratio that measures how fast the
economy of a country is growing or declining. It compares one quarter of the nation’s gross
domestic product to the previous quarter. The GDP does measure the economic output of the
nation. The GDP growth rate is driven by the four components of GDP; personal consumption,
investment, government expenditure and net export of products and services (Madsen, Ang, &
Banerjee, 2010). The association between the population growth rate and the GDP growth is a
controversial topic. In this report, the 2018 data was used to draw the links between growth in
population and growth in the capita output of a nation. Low population growth in nations with
high income has the potentiality to lead to social and economic issues. On the other hand, high
population growth rates in nations with low income may mean slow development. These
imbalances can be solved by international migration though this is something that many people
do oppose. The imbalance between population and GDP growth rate is therefore a factor that can
cause global equality (Peterson, 2017). This justifies the reason for examining how the GDP
growth rate is associated with population growth as this can then be applied in solving some of
the economic and social issues being faced globally.
Methodology
The study uses data from world bank to assess the association between population growth
rate and GDP growth rate. The data obtained from the world bank database did contain the GDP
and population growth for different countries for varies years (The World Bank, 2019) (The
Document Page
RELATIONSHIP BETWEEN POPULATION GROWTH AND ECONOMIC
DEVELOPMENT OF A NATION
3
World Bank, 2019). A sample of the data for the nations was obtained only for the year 2018.
Simple linear regression and regression analysis; model building were the techniques used to
investigate the correlation between the two variables. The descriptive statistics was also applied
to give a descriptive summary of the data. Visuals such as scatter plot were applied to give a
visual display of the relationship between the population growth rate and the GDP growth rate.
The analysis was done using Microsoft excel.
Analysis and discussion
From the sampled data, the mean annual population growth rate is 1.263% with a
standard deviation 1.142. The country with the highest population growth rate have a rate of
4.92% while the lowest have -3.98%. The negative rate indicates that the population of the nation
is declining. On the other hand, looking at the GDP growth rate, it can be observed that the
nation with the highest rate of growth has a rate of 8.61% while the lowest growth rate is -
19.62% which indicates a decline in GDP. The mean GDP growth rate for the nations is 3.04%
with a standard deviation of 3.128. The table summarizes the descriptive analysis of the
population and GDP growth rates.
Document Page
RELATIONSHIP BETWEEN POPULATION GROWTH AND ECONOMIC
DEVELOPMENT OF A NATION
4
2018 Population growth (annual %) 2018 GDP growth (annual %)
Mean 1.263481782 Mean 3.046500037
Standard Error 0.073736267 Standard Error 0.201887764
Median 1.189512392 Median 3.09599675
Mode 1.202181388 Mode #N/A
Standard Deviation 1.142317333 Standard Deviation 3.127631785
Sample Variance 1.30488889 Sample Variance 9.782080584
Kurtosis 1.358796534 Kurtosis 21.92517228
Skewness -0.19758651 Skewness -3.313368838
Range 8.904661457 Range 28.22815859
Minimum -3.983500085 Minimum -19.62145259
Maximum 4.921161372 Maximum 8.606705998
Sum 303.2356276 Sum 731.160009
Count 240 Count 240
Largest(1) 4.921161372 Largest(1) 8.606705998
Smallest(1) -3.983500085 Smallest(1) -19.62145259
The box plot summarizes the distribution of the GDP and population growth rates among
the nations in the year 2018. For the population growth rate, we have two nations that did
experience unordinary growth rates that is the country with the growth rate of 4.92% and the one
with a rate of -3.98%. These cases can be categorized as outliers as pointed out in the box plot
below. On the other hand, all those nations whose GDP growth rate for the year were less than -
2.70% could also be classified as outliers. The box plot below presents a visual view of the
outliers.
tabler-icon-diamond-filled.svg

Paraphrase This Document

Need a fresh take? Get an instant paraphrase of this document with our AI Paraphraser
Document Page
RELATIONSHIP BETWEEN POPULATION GROWTH AND ECONOMIC
DEVELOPMENT OF A NATION
5
One way to evaluate the correlation between two data points is by using the scatter plot.
As from the chart presented below a plot between the population growth rates and the GDP
growth rates across the countries did indicate an existence of a relationship (Mitchell, 2012).
Document Page
RELATIONSHIP BETWEEN POPULATION GROWTH AND ECONOMIC
DEVELOPMENT OF A NATION
6
The data points seems to be increasing as you move from left to right which can be interpreted as
a positive correlation. To get a clear picture of the correlation factor a linear regression model
was developed and the outcome of the model indicated in the table below.
SUMMARY OUTPUT
Regression Statistics
Multiple R 0.21693099
R Square 0.047059055
Adjusted R Square 0.043055101
Standard Error 3.059560772
Observations 240
ANOVA
df SS MS F Significance F
Regression 1 110.0201759 110.0201759 11.75314698 0.000715641
Residual 238 2227.897084 9.360912116
Total 239 2337.917259
Coefficients Standard Error t Stat P-value Lower 95% Upper 95% Lower 95.0% Upper 95.0%
Intercept 2.296054059 0.294822418 7.78792223 2.0919E-13 1.715259342 2.876848776 1.715259342 2.876848776
2018 Population growth (annual %) 0.593950771 0.173250049 3.428286303 0.000715641 0.252651374 0.935250168 0.252651374 0.935250168
Document Page
RELATIONSHIP BETWEEN POPULATION GROWTH AND ECONOMIC
DEVELOPMENT OF A NATION
7
The multiple r value of 0.2169 indicates a weak positive relationship between the two
variables. The R square value of 0.047 shows that at least 4.7% of the GDP rate changes are due
to changes in the population growth rate. The significance F statistics value is 0.0007 being that
the model was generated at a 955% level of significance the significance F value shows that the
model is a good fit. The intercept value is 2.296 hence at a population growth rate of 0% the
GDP growth rate will be estimated to be 2.29% (Schneider, Hommel & Blettner, 2010). From
the linear regression model, the following equation can be used to present the relationship
between GDP and the population growth rate.
y=0.594 x+2.296
To ascertain that there is a significant correlation between the population growth and the GDP a
hypothesis test was carried out;
H0 : x coeffic ie nt is 0
Vs
H1 : x coeffic ie nt is not 0
The test was carried out at a 95% level of significance.
The p value for the coefficient is 0.0007 which is less than 0.05, hence at a 95% level of
significance we had to reject the null hypothesis and conclude that the x coefficient is not zero
which means that there is a significant correlation between population and GDP growth of a
nation.
tabler-icon-diamond-filled.svg

Paraphrase This Document

Need a fresh take? Get an instant paraphrase of this document with our AI Paraphraser
Document Page
RELATIONSHIP BETWEEN POPULATION GROWTH AND ECONOMIC
DEVELOPMENT OF A NATION
8
Conclusion
The objective of the study was to gauge the relationship between the GDP and population
growth rate. Using the scatter plot, it was identified that a positive correlation did exist between
the two variables. This was confirmed by the simple linear regression model that did indicate that
GDP growth rate is weakly corelated with the population growth rate. As per the findings, by
controlling their population growth nations will be able to influence their GDP growth rate.
Document Page
RELATIONSHIP BETWEEN POPULATION GROWTH AND ECONOMIC
DEVELOPMENT OF A NATION
9
References
Madsen, J. B., Ang, J. B., & Banerjee, R. (2010). Four centuries of British economic growth: the
roles of technology and population. Journal of Economic Growth, 15(4), 263-290.
Mitchell, M. N. (2012). Interpreting and visualizing regression models using Stata (Vol. 5).
College Station, TX: Stata Press.
Peterson, E. W. F. (2017). The role of population in economic growth. SAGE Open, 7(4),
2158244017736094.
The World Bank, 2019. GDP growth (annual %). [Online]
Available at: https://data.worldbank.org/indicator/NY.GDP.MKTP.KD.ZG
[Accessed 2 April 2020].
The World Bank, 2019. Population growth (annual %). [Online]
Available at: https://data.worldbank.org/indicator/SP.POP.GROW
[Accessed 3 April 2020].
Schneider, A., Hommel, G., & Blettner, M. (2010). Linear regression analysis: part 14 of a series
on evaluation of scientific publications. Deutsches Ärzteblatt International, 107(44), 776.
chevron_up_icon
1 out of 9
circle_padding
hide_on_mobile
zoom_out_icon
[object Object]