Australia's Population Density: Geographical and Spatial Analysis

Verified

Added on  2023/04/20

|11
|2426
|356
Report
AI Summary
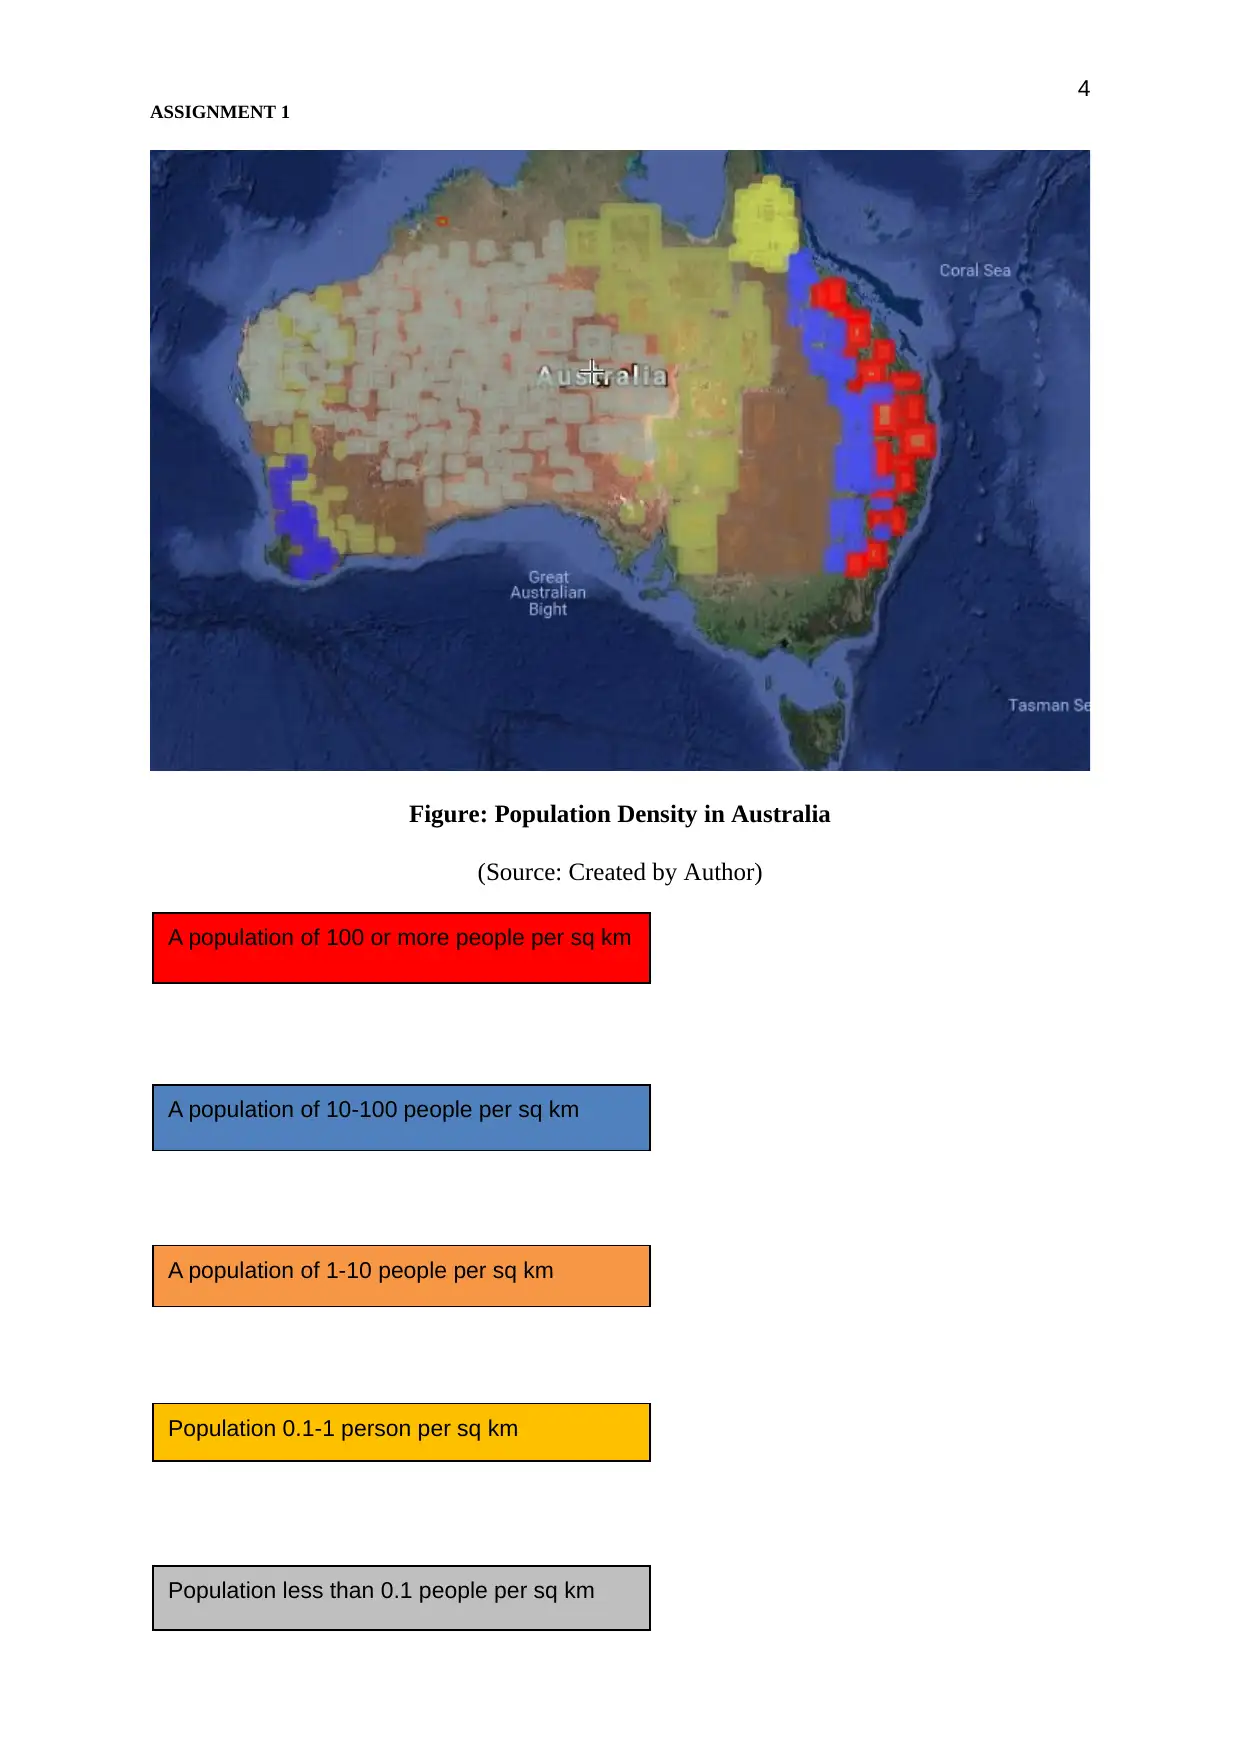
This report provides an analysis of the population distribution in Australia, highlighting the significant variations in population density across different regions. The study identifies that the highest population densities are concentrated in the capital territory and along the southern and coastal areas, particularly in Victoria and New South Wales, due to favorable climate, economic opportunities, and better access to water resources. In contrast, the central and northern parts of Australia, characterized by deserts and grasslands, exhibit the lowest population densities due to harsh weather conditions, limited water availability, and lack of economic infrastructure. Factors such as immigration patterns, water scarcity, land infertility, and transportation limitations contribute to this uneven spatial distribution. The report also touches upon historical trends and the impact of industrialization and tourism development on population patterns, emphasizing the need for sustainable development strategies to address the challenges posed by the country's unique geographical and environmental conditions. Desklib provides a platform for students to access this and other solved assignments.
Document Page
Running head: ASSIGNMENT 1
ASSIGNMENT 1
tabler-icon-diamond-filled.svg

Paraphrase This Document

Need a fresh take? Get an instant paraphrase of this document with our AI Paraphraser
Document Page
2
ASSIGNMENT 1
Text summary: explaining the map
This map intends to show the population distribution of Australia. There is an excellent
variety of population distribution in Australia. Among all the states and territory, which are
the parts of Australia, the highest people live in the capital territory of Australia. The
population density there is 171/ square km. We have to analyze the geographical boundary of
Australia (Cooper, Donaldson & Murrieta-Flores, 2016). We can then understand the causes
of the diversity of widespread distribution. In the east of Australia, the Indian ocean marks
the boundary. In the south, there is a southern ocean & Tasmanian sea. In the west, south
pacific ocean and Gulf of Carpentaria in the north. In the east, there are states like The
Kimberley, Broome, Karratha, Geraldton, Busselton, and Perth. In north, Esperance, Albany,
Adelaide, and others. In the south, the most popular and inhabited places are. The favorite
places like Barossa Valley, Newcastle, Sydney, Melbourne, Rockhampton are in the south
coastal area. In the central part of Australia, there are mainly Grasslands and Deserts (Abram
et al. 2015). Where the population is even under one people, other most populated parts after
the capital area are in Victoria (27), New South Wales (9.7), Tasmania (7.6). In the northern
part, population density is the lowest. The population in that part is under 0.2 people per
square kilometer. The highest inhabited areas are centered around the South as the businesses
areas are there. Potts point (15800/ square km), Pyrmont-ultimo (15700/square km),
Darlinghurst (14200/ square km) are some of them.
Population density is the most in Melbourne (17500/ square km). However, in the case of the
central part of Australia there are deserts like the Great Sandy Desert, Great Victorian desert
and the temperature there are very high. So, the population of high density is next to
impossible in this part. As opined by Baró et al. (2016), the population in Western Australia,
Document Page
3
ASSIGNMENT 1
New South Wales, Queensland, are less than one person in every square kilometer. In this
map, we have tried to show how the population density varies with the geographical changes
like the Southern part of Australia and the Northern coastal parts of Australia is densely
populated because the most of the activities and means of livelihood are centered in those
regions. The climate is the most critical factor in this diversified distribution of the Australian
Population. The weather in the central part and the northern part are harsh and extreme. The
temperature there is very high and varies significantly with the seasonal cycle. In these parts,
there are two deserts like the Great Sandy Desert and the Great Victoria desert.
In this map, we have pointed out those areas by the population density marks. The average
population of Australia is about 3.3 people/ square km. So, Australia one of the most
underpopulated country though it has a comparatively large area than many other countries.
The immigration from one area to other is also an issue (Cooling & Hoffmann, 2015). This
has also contributed to the diversity of the population. In this map, an area with 100 or more
population has been depicted by red, from 10-100 by blue, from 1-10 by Brown, 0.1-1 by
yellow and less than 0.1 by grey. By this map, the population density can be depicted.
Document Page
4
ASSIGNMENT 1
Figure: Population Density in Australia
(Source: Created by Author)
A population of 100 or more people per sq km
A population of 10-100 people per sq km
A population of 1-10 people per sq km
Population 0.1-1 person per sq km
Population less than 0.1 people per sq km
tabler-icon-diamond-filled.svg

Paraphrase This Document

Need a fresh take? Get an instant paraphrase of this document with our AI Paraphraser
Document Page
5
ASSIGNMENT 1
Document Page
6
ASSIGNMENT 1
The map is presenting the population density in the different parts of Australia.
In this map, we have tried to describe the population density of Australia. The density of the
population in Australia is especially centered in the coastal area and to be more specific in
South Australia where the Pacific ocean lies. In the north part and the central part, the density
is less than 0.1 per square kilometer ( Elhag & Bahrawi, 2017). These spots are well spread
western Austalia to Queensland to the north. In this area the weather is extreme, and the
temperature varies the most for the deserts are present there.
Water distribution is one of the essential parts of creating this diversity. The central and north
part of Australia receives almost no rainfall because there are grasslands and deserts. So we
can clearly understand that the type of vegetation will vary according to weather. In the
central and northern area, only cactus type plants grow. These are not edible. So it is not
possible to build a colony of people there. So, no economic benefits can be achieved there. In
history, we have seen that the civilizations have been formed near the places where water
resource was present. The southern and coastal areas are much more favorable in the
perspective of nature.
Moreover, the southern part of the accessibility is good with water transport. The central and
north parts are not well connected by transport. There is also a small amount of tropical area
which is inhabitable. So, all of these factors have contributed to the sparse population density
and the diversification of the population density.
Causes of the spatial distribution of population:
The causes of population density are as follows:
The water availability matters the most in the even distribution of the population. In
Australia water is scarce to avail. The desert area receives almost no rainfall. The
Document Page
7
ASSIGNMENT 1
coastal area, in contrast, receives a handsome amount of rainfall which helped that
part to grow sustainably (Huang, Schneider & Friedl, 2016). So, there is a vast
difference in the population of the southern part than the northern and central part.
The immigration from one city to another plays a vital role in this. People emigrated
in the parts where life is more, and the conditions of living are comfortable.
The tropical parts of Australia can be used to make an industry. However, the
government has not thought about it much. The industrialists have to work
significantly about the possibilities to work there. They have to build a water supply
system or bring it from another part. It is difficult. A large number of cities are facing
water problem. The dams in the country lack water. (businessinsider.com.au, 2019)
The land in most of the parts of Australia is not fertile. It is not easy to make
agriculture in this country. The other countries in Asia are much more friendly about
agriculture. So the people of Australia have to depend on the industry. Most industries
are in the Southern part. It is understandable why so many people live in the southern
part, and the north and central part are so isolated.
Because of this weather condition, mortality and aging rate in this country is high.
This makes a difference in population distribution.
The transportation system to get in this country is a bit tricky. The main cities are
situated in the banks of the Pacific Sea. The other parts are inaccessible.
Australia has strict law regarding immigration. They do not allow other country
people quickly to get in (except white people countries). So many of the people are
interested in living in Australia.
The other parts of Australia have recently started to see the population. However, the
adverse conditions of weather caused barriers in the even distribution of the
population.
tabler-icon-diamond-filled.svg

Paraphrase This Document

Need a fresh take? Get an instant paraphrase of this document with our AI Paraphraser
Document Page
8
ASSIGNMENT 1
There is a role of the increasing population depends on tourism development. From a
long ago, this option was not exercised by the government. So, where the population
could have spread, was not used.
7.7 million square kilometer area in Australia is almost empty. So there is a difference
in population distribution is present there.
Document Page
9
ASSIGNMENT 1
The Australian population graph maintained its consistency for more than eight years, for
these years there has been a slight change. It did not add much change to the population chart
over these years. Even though there has been a slight upliftment due to the factors that
include the increased rate of birth, a higher emergence of refugees and longer survival of
people. The growth in population over the last six years has not been enormous (Kaden,
Kruggel & Alexander, 2016). In the present scenario for each minute and a few seconds a
child is born, and for every 3 minutes and a few seconds, a man dies. Compared to China, the
Australian population is to the lowest degree. Australia occupies a mixed population of all
culture; its primary occupant is English speaking people. This country is an example of
diversification.
Mostly populated capitalized cities of Australia include Perth, Brisbane, Adelaide, and
Sydney. This diversified population is one of the reasons for its spatial property. Australia is
one of the countries that depends hugely on mining. So huge percentage receive their bread
and butter through this occupation. The economic condition of the country is also dependent
on its spatiality. During the second world war, many migrants migrated to Australia, thereby
affecting the population of the country. Last year the population of the country was about
21.5 million. Sydney among all the cities in Australia is most populated. Even though
Australia is not very populated but its population increased due to the migrants. Australia is a
continent which mostly flat and dry.
It is the driest in the world. Australia is one of the countries in the world in terms of its sex
ratio (Tewkesbury et al. 2015). The life existence of the female was higher than the male in
2011. Due to its balanced structure, it has a spatial distribution. The decline in population was
majorly from 2001 to 2009. Population in coastal areas of Australia is more than other
areas. The variation in the Australian lifestyle is also a key factor for the spatial population in
Australia. Population displacement is one of the factors of its spatial pattern. Industrialization
Document Page
10
ASSIGNMENT 1
is one of the causes. The graph of population change in Australia has not been even. This
uneven structure is one of the causes of its spatiality. Even though the country is balanced but
certain major factors of this country are the reason for its spatiality. Australia is one of the
capitalized countries in the world. These factors described above are the primary citing
reasons of its spatial distribution.
tabler-icon-diamond-filled.svg

Paraphrase This Document

Need a fresh take? Get an instant paraphrase of this document with our AI Paraphraser
Document Page
11
ASSIGNMENT 1
Reference List
Book
Cooper, D., Donaldson, C., & Murrieta-Flores, P. (Eds.). (2016). Literary mapping in the
digital age. UK:
Journals
Abram, N. K., Meijaard, E., Wells, J. A., Ancrenaz, M., Pelletier, A. S., Running, R. K., ... &
Mengersen, K. (2015). Mapping perceptions of species' threats and population trends
to inform conservation efforts: the Bornean orangutan case study. Diversity and
Distributions, 21(5), 487-499.
Baró, F., Palomo, I., Zulian, G., Vizcaino, P., Haase, D., & Gómez-Baggethun, E. (2016).
Mapping ecosystem service capacity, flow, and demand for landscape and urban
planning: A case study in the Barcelona metropolitan region. Land use policy, 57(4),
405-417.
Cooling, M., & Hoffmann, B. D. (2015). Here today, gone tomorrow: declines and local
extinctions of invasive ant populations in the absence of intervention. Biological
Invasions, 17(12), 3351-3357.
Elhag, M., & Bahrawi, J. A. (2017). Soil salinity mapping and hydrological drought indices
assessment in arid environments based on remote sensing techniques. Geoscientific
Instrumentation, Methods and Data Systems, 6(1), 149-158.
Huang, X., Schneider, A., & Friedl, M. A. (2016). Mapping sub-pixel urban expansion in
China using MODIS and DMSP/OLS nighttime lights. Remote Sensing of
Environment, 175(2), 92-108.
Kaden, E., Kruggel, F., & Alexander, D. C. (2016). Quantitative mapping of the peraxon
diffusion coefficients in brain white matter. Magnetic resonance in medicine, 75(4),
1752-1763.
Tewkesbury, A. P., Comber, A. J., Tate, N. J., Lamb, A., & Fisher, P. F. (2015). A critical
synthesis of remotely sensed optical image change detection techniques. Remote
Sensing of Environment, 160(1), 1-14.
Website
businessinsider.com.au, (2019), business insider, retrieved from
https://www.businessinsider.com.au/this-map-shows-population-density-across-
australia-2017-7 [Retrieved on 29th January 2019]
chevron_up_icon
1 out of 11
circle_padding
hide_on_mobile
zoom_out_icon
[object Object]