Quality Planning & Analysis: Porcelain Tiles - Stakeholder Report
VerifiedAdded on 2023/06/12
|48
|10314
|183
Report
AI Summary
This report provides a comprehensive analysis of quality planning and analysis for porcelain tiles. It begins with an introduction to porcelain tiles, highlighting their key functions and characteristics. The report delves into customer satisfaction, conducting a stakeholder analysis to identify the needs of various stakeholders, including customers, investors, and employees. It explores methods for capturing customer needs, such as Genchi Genbutsu and customer interaction, and employs Kano analysis to categorize customer needs into must-haves, wants, and desirables. The report then translates customer needs into design requirements using Quality Function Deployment (QFD) and conducts a Design Risk Analysis using Failure Mode and Effect Analysis (FMEA). Furthermore, it addresses supplier selection and evaluation, outlining the process of identifying components, developing selection criteria, and constructing a supplier selection system. The report also covers statistical process control, including identifying processes, monitoring them using SPC charts, and constructing and using SPC charts. Finally, it discusses problem-solving, identifying problems and utilizing problem-solving tools. The analysis offers a robust framework for ensuring the quality of porcelain tiles throughout the design, production, and distribution processes.
0QUALITY PLANNING AND ANALYSIS: PORCELAIN TILES
Quality planning and analysis: porcelain tiles
Name of Student
Name of University
Author Note
0
Quality planning and analysis: porcelain tiles
Name of Student
Name of University
Author Note
0
Paraphrase This Document
Need a fresh take? Get an instant paraphrase of this document with our AI Paraphraser
1QUALITY PLANNING AND ANALYSIS: PORCELAIN TILES
Table of Contents
1.0 Introduction.................................................................................................................................................6
2.0 Customer Satisfaction.................................................................................................................................8
2.1 Stakeholder Analysis..............................................................................................................................8
2.2 Capturing the customer needs.............................................................................................................10
2.3 Customer needs analysis (Kano analysis)...........................................................................................13
Figure-1- Kano Model............................................................................................................................14
3.0 Design Requirements:..............................................................................................................................20
3.1 Translating the Customer needs into Design Requirements (QFD):...................................................20
3.2 Design Risk Analysis (FMEA)..............................................................................................................22
4.0 Supplier Selection and Evaluation..............................................................................................................2
4.1 Identifying the Components, Elements, Parts, etc.................................................................................2
4.2 Developing the Supplier Selection Criteria.............................................................................................4
4.3 Constructing and Using a Supplier Selection System............................................................................5
4.4. Outcome of Supplier Selection Process................................................................................................9
5.0 Statistical Process Control........................................................................................................................10
5.1 Identifying the Processes.....................................................................................................................10
5.2 Monitoring Processes using SPC Charts.............................................................................................10
5.3 Constructing and Using an SPC Chart.................................................................................................11
Figure 2: SPC chart................................................................................................................................14
Figure 3: Pareto chart............................................................................................................................15
6.0 Problem Solving........................................................................................................................................16
6.1 Identifying the Problems and Problem Solving Tools..........................................................................16
6.2 Constructing and Using the Problem Solving Tools.............................................................................16
7.0 Conclusion................................................................................................................................................20
1
2QUALITY PLANNING AND ANALYSIS: PORCELAIN TILES
8.0 References................................................................................................................................................21
2
8.0 References................................................................................................................................................21
2
⊘ This is a preview!⊘
Do you want full access?
Subscribe today to unlock all pages.
Trusted by 1+ million students worldwide
3QUALITY PLANNING AND ANALYSIS: PORCELAIN TILES
Table of Tables
Table-1- Stakeholder’s Analysis.......................................................................................................................9
Table 2: questionnaire format.........................................................................................................................16
Table 3: data file..............................................................................................................................................18
Table 4: category table....................................................................................................................................18
Table 5: Correlation table................................................................................................................................20
Table 6: Relation with customer requirements...............................................................................................21
Table 7: Risk Analysis (FMEA)......................................................................................................................24
Table 8: SPC chart table.................................................................................................................................35
Table-9- Checklist...........................................................................................................................................36
3
Paraphrase This Document
Need a fresh take? Get an instant paraphrase of this document with our AI Paraphraser
4QUALITY PLANNING AND ANALYSIS: PORCELAIN TILES
Table of Figure
Figure-1- Kano Model.....................................................................................................................................11
Figure 2: SPC chart.........................................................................................................................................29
Figure 3: Pareto chart.....................................................................................................................................30
4
5QUALITY PLANNING AND ANALYSIS: PORCELAIN TILES
1.0 Introduction
The product chosen for this study is Porcelain.The product was initially produced only in North America
alone. Porcelain is made up of a blend of natural substances which as mineral based, such as sand,
clay, feldspar, talc and many others. Porcelain tile is pressed and put under flamein a furnace at high
temperatures to mold the product in whatever preferred shape. Therefore, drawing from this context, it
can be said that porcelain tileshave the characteristics of being fire resistant, non-combustible, long-
lasting and especially easy to preserve.
The Material constitution of tiles of porcelain are found to live up to the set quality standards of the
global market. Its durability is also found to be up to the global standards.These tiles global markets
and are also found to be easily available. They are thus widely used and additionally they serve a dual
role in their functionality as floor coverings and wall coverings. They not only meet their main functional
requirements of being building blocks but additionally are appreciated for the aesthetic quality they
make scope for. Thus they also act as a design component and hence serve to be building finishing
materials. As its role in being a building finishing material, tiles of porcelain are found to be able to
withstand various environmental stress factors.
Tiles of porcelain are primarily made up of ceramic. They are used in both commercial places and
residential buildings. Thiskind of tiles are widely used and can be found in countries all around the
world, however few countries such asItaly, China, India, and other countries around Asiahave turned
out to be its major users today. Presently, the notable countries China, Spain, Turkey and Italy among
all other producers of the product are the leaders of manufacturing Porcelain tiles.
Strength and Weakness
The characteristics that can be considered as its strengths are listed as below:
They are resistant to wearing and tearing.
Porcelain tiles have very high accessibility and durability.
Porcelain tiles are found to be especially useful in areas which are dry and are zones of low
traffic.
Porcelain tiles have a naturally glazed surface and thus not much efforts are not required in
polishing them in the manufacturing process.
5
⊘ This is a preview!⊘
Do you want full access?
Subscribe today to unlock all pages.
Trusted by 1+ million students worldwide
6QUALITY PLANNING AND ANALYSIS: PORCELAIN TILES
Porcelain tiles are easy to maintain.
A variety of style of porcelain tiles are easily available and that adds to the aesthetic allure for
consumers.
Porcelain tiles are resistant to moisture and are thus waterproof.
Cleaning is easy for porcelain tiles
Porcelain tiles are fireproof.
The characteristics that can be considered as its weakness are listed as below:
Tiles of porcelain are heavy and dense in nature making it challenging to transport and handle
them
Porcelain is expensive which may make some consumers reconsider and choose cheaper
options
Installation process can be challenging since it involves cutting the heavy and dense tiles into
shape
Chloride water and acids stains porcelain tiles and can make its color fade over time making its
appearance dull.
Porcelain as a substance has high density
It is a heavy material
Installation requires investment in additional materials such as grout.
6
Paraphrase This Document
Need a fresh take? Get an instant paraphrase of this document with our AI Paraphraser

7QUALITY PLANNING AND ANALYSIS: PORCELAIN TILES
2.0 Customer Satisfaction
2.1 Stakeholder Analysis
Stakeholders have a major role to play in regulation and maintenance of the quality products no matter
what kind. Theseindividuals influence how and what goods are produced as per the production limits of
the manufacturers and this holds no matter what or who the company or firm is as per the production
abilities. The people who can be considered as the stakeholders include staffs, management agencies,
clients, investors, sponsors of the products in the market and even customers themselves (Jemmasi,
Strong and Taylor, 2011). They fuel the investmentbeing made for manufacturing and promotions to
improve the demand in the market. Moreover, shareholderswork to cause diversity in the growth and
theactivities reflecting expansion within a given time period of the organization. The stakeholders of an
organization contribute towardsstrategies of growth of the production and distribution framework and
other developmental strategies of the products. They do this by means ofcommunication to the world,
the pros and cons of whatever product they are associated with.
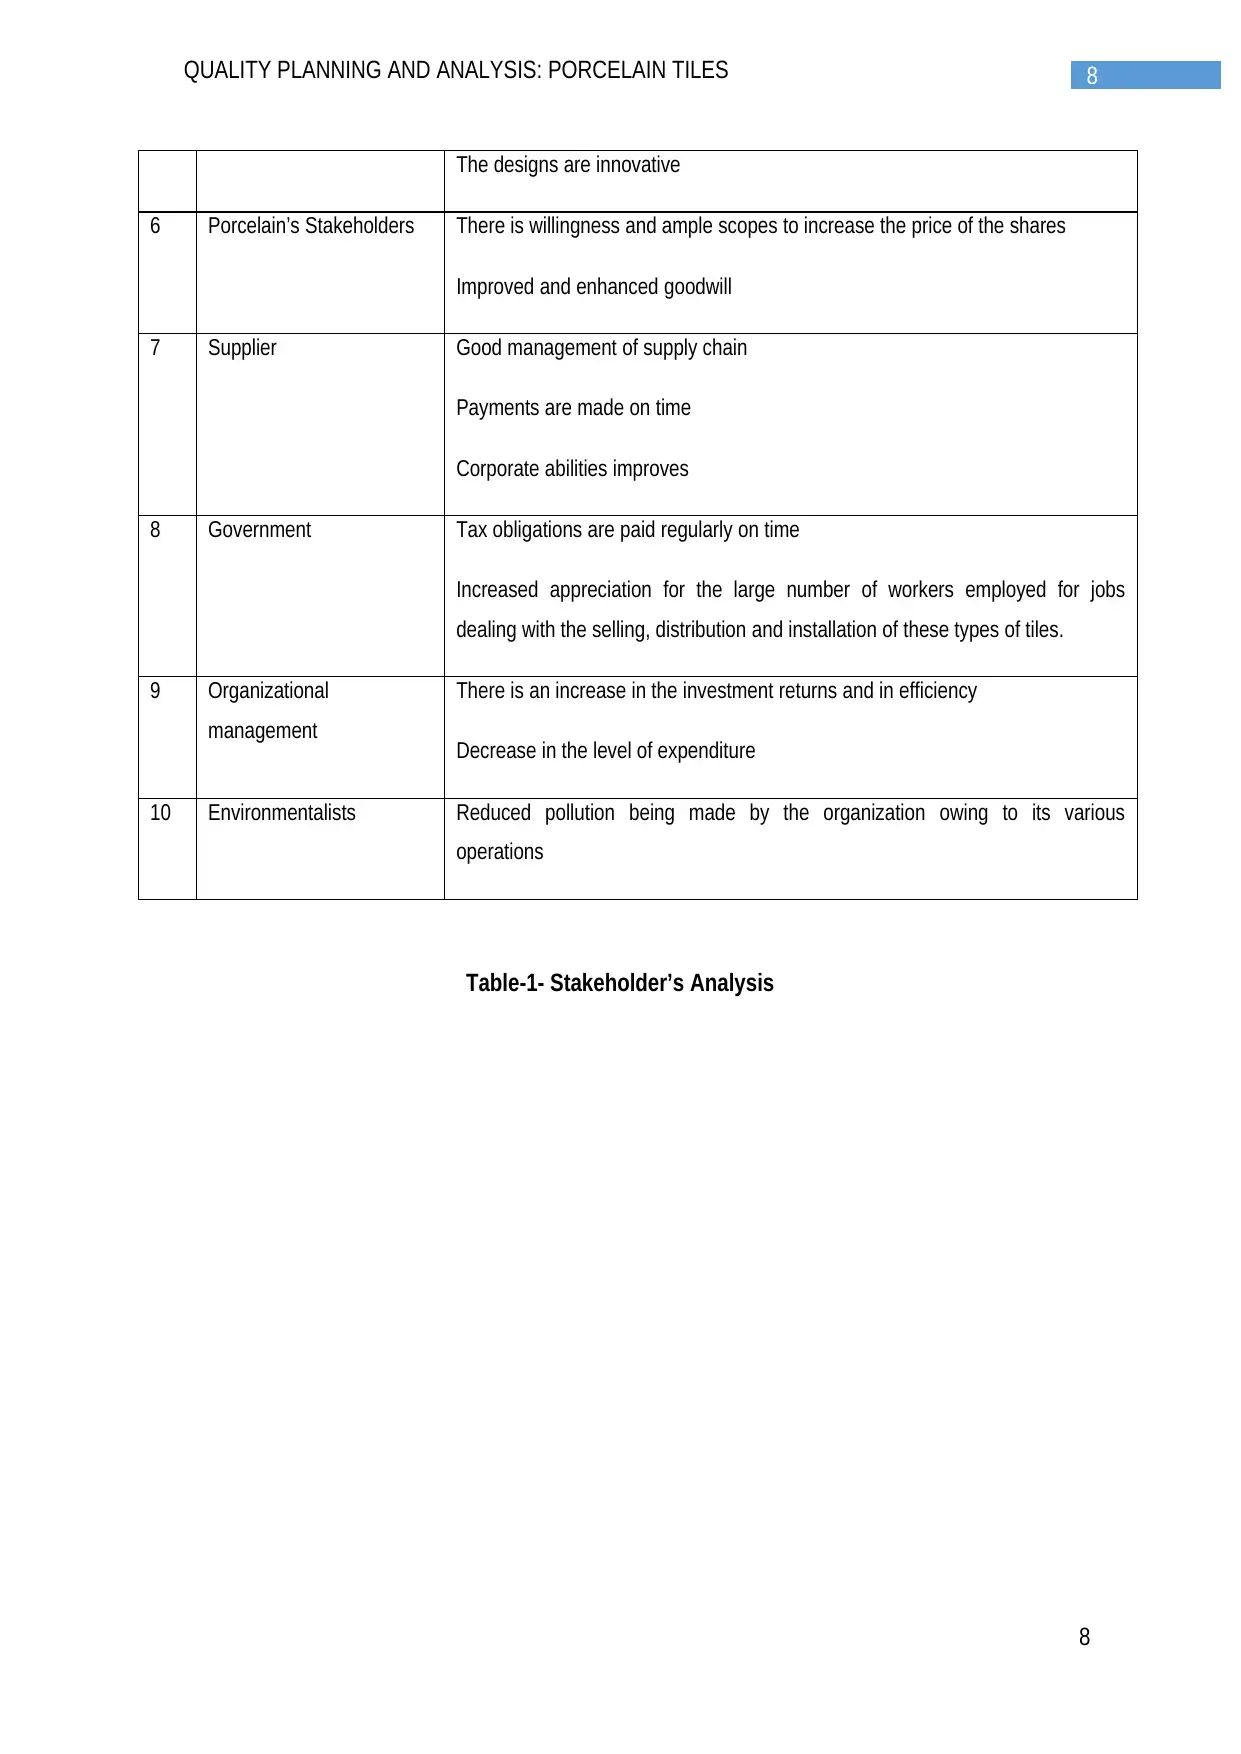
No. Stakeholder Expectations
1 Customer priced reasonably
Has Better design
Product is reliable
2 Investors Enhances the value of investors
Increases the organization’s profit margin.
3 Employees The work environment is safe and suitable
There is a training infrastructure in place to help employees improve
Bonus and incentive schemes are present
4 Retailers Higher level of sales margin achieved through distribution activities.
There are effective warranty schemes as well as responsive customer care
services in place
5 Direct Competitors Competition is fair
7
2.0 Customer Satisfaction
2.1 Stakeholder Analysis
Stakeholders have a major role to play in regulation and maintenance of the quality products no matter
what kind. Theseindividuals influence how and what goods are produced as per the production limits of
the manufacturers and this holds no matter what or who the company or firm is as per the production
abilities. The people who can be considered as the stakeholders include staffs, management agencies,
clients, investors, sponsors of the products in the market and even customers themselves (Jemmasi,
Strong and Taylor, 2011). They fuel the investmentbeing made for manufacturing and promotions to
improve the demand in the market. Moreover, shareholderswork to cause diversity in the growth and
theactivities reflecting expansion within a given time period of the organization. The stakeholders of an
organization contribute towardsstrategies of growth of the production and distribution framework and
other developmental strategies of the products. They do this by means ofcommunication to the world,
the pros and cons of whatever product they are associated with.
No. Stakeholder Expectations
1 Customer priced reasonably
Has Better design
Product is reliable
2 Investors Enhances the value of investors
Increases the organization’s profit margin.
3 Employees The work environment is safe and suitable
There is a training infrastructure in place to help employees improve
Bonus and incentive schemes are present
4 Retailers Higher level of sales margin achieved through distribution activities.
There are effective warranty schemes as well as responsive customer care
services in place
5 Direct Competitors Competition is fair
7
8QUALITY PLANNING AND ANALYSIS: PORCELAIN TILES
The designs are innovative
6 Porcelain’s Stakeholders There is willingness and ample scopes to increase the price of the shares
Improved and enhanced goodwill
7 Supplier Good management of supply chain
Payments are made on time
Corporate abilities improves
8 Government Tax obligations are paid regularly on time
Increased appreciation for the large number of workers employed for jobs
dealing with the selling, distribution and installation of these types of tiles.
9 Organizational
management
There is an increase in the investment returns and in efficiency
Decrease in the level of expenditure
10 Environmentalists Reduced pollution being made by the organization owing to its various
operations
Table-1- Stakeholder’s Analysis
8
⊘ This is a preview!⊘
Do you want full access?
Subscribe today to unlock all pages.
Trusted by 1+ million students worldwide
9QUALITY PLANNING AND ANALYSIS: PORCELAIN TILES
2.2 Capturing the customer needs
To understand the needs of the customers and the clients of companies manufacturing Porcelain, a
number of approaches can be employed.Notable among various and different approaches are
discussed hence. These deal with steps that can help to gauge the desires and expectations of the
customers and their satisfaction levels, taking into account the effect of the period of time when the
customer is perceived to feel so. There exists five main methods that companies producing and selling
porcelain tiles employ with high frequency to communicate to its current and potential customers
regarding its new products or new modifications to their old products as per the needs that are
perceived through their market research (Zimmerman et al. 2011).
Genchi Genbutsu
This approach follows a “go and see” format of strategy and was first introduced by the Japanese. It
relies on the customers being interviewed by a representative of the company firsthand and collecting
firsthand feedback from the customers regarding their needs, preferences and requirements as well as
feedback regarding their own products. It has proved to be able to support the organization in improving
the quality of their product while keeping in focus the demand of its customers, that is, the market.
Hence this technique is used quite often to identify the basic needs of the consumers. It thusaids the
manufacturers to act as per the perceptions of the consumers of its products in a way that would satisfy
them (Goetsch and Davis, 2014). The current and potential customers are interviewed on a one to one
basis by agents of the companies.
Customer Interaction over Telephone
Organizations may opt to review its customers regarding the performance of its products and ask for
feedback asking for what the customer may have liked or disliked about the product and what changes
or improvements they may like to see in the future via telephonically held interviews. Thus they collect
insights regarding the performance of their products and use them to employ changes to bring about
improvement in quality of their products and their other related services that they provide. Thus through
such direct interaction the companies may communicate with their clients and customers directly. This
allows them to understand what their customersmay want or need and they can thus deliver products
which meet those specifications accordingly, hence giving the companies an added edge over their
competitors (Fayers and Machin, 2013). Hence by employing this approach, the organization can
effectively identify what the consumer’s value and demand from the marketand thus engineer their
products to best meet those specifications as understood through their market research.
9
Paraphrase This Document
Need a fresh take? Get an instant paraphrase of this document with our AI Paraphraser
10QUALITY PLANNING AND ANALYSIS: PORCELAIN TILES
Benchmarking Criteria
Another approach which is quite notable and an essential strategy that is followed by the various
companies to make sure, that their products can keep up with, and meet the needs and expectation of
the customers is the Benchmarking criteria method.The approach also enables the company to
measure easily, the cost for ensuring the quality of the product and to estimate the time frame required
for the production process (Ravishankara, Dawson, and Winner, 2012). Additionally, benchmarking
criteria gives way to make comparison of the various creativity and innovative ideas in relation to the
production, management, distribution and selling strategies that may be generated within the
organization itself. The companies can then document their insights and understanding as an outcome
of the research about theexisting expectations of the consumers and the levels and nature of
competition that exist in the market. These pieces of information can then be aggregated and stored in
their private corporate databases as reference for any future decisionmaking.
Focus Group
Focus groups are groups of individuals hired by a certain company who act as eyes of the company.
They are required to visit the actual market places and observe the buying patterns of the customers,
such as the profile of the customers, the products preferred by them, the brand preferred by them. Thus
they aid to identify customer segments or the target customer base. A group of around 5 to 6 people
are usually stationed in a particular public location to merely observe these customers and their
patterns of purchase. Then the observed data is compiled and used to generate insight regarding the
customer segments and target profiles, or if any changes ought to be made to their products and what
kind (Kaplan and Atkinson, 2015).
Customer Complaints
Yet another notable approach to capture the needs of the customers is the customer
complaintsavenue. Taking cognizance of the complaints put forth by the customers themselves is a
very essential and significant action that can help the company to identify key shortcomings of their
products and services that can potentially drive away customers and clients. It helps the company to
identify a number of things including any changes in the perceptions of the customers and the period of
time of that particular change happening with regard to the changes occurring in the trends of the
market or other related social, political or environmental factors. Thus the organization can gather key
insights through adopting this method. Hence the Tiles Company can implement the necessary
modifications to the product and their services as per the market structure with respect to the
10
11QUALITY PLANNING AND ANALYSIS: PORCELAIN TILES
corresponding periods of time to minimize customer dissatisfaction and maximize profits and sales
(Carnevale et al. 2012).
11
corresponding periods of time to minimize customer dissatisfaction and maximize profits and sales
(Carnevale et al. 2012).
11
⊘ This is a preview!⊘
Do you want full access?
Subscribe today to unlock all pages.
Trusted by 1+ million students worldwide
1 out of 48
Related Documents


Your All-in-One AI-Powered Toolkit for Academic Success.
+13062052269
info@desklib.com
Available 24*7 on WhatsApp / Email
![[object Object]](/_next/static/media/star-bottom.7253800d.svg)
Unlock your academic potential
Copyright © 2020–2026 A2Z Services. All Rights Reserved. Developed and managed by ZUCOL.